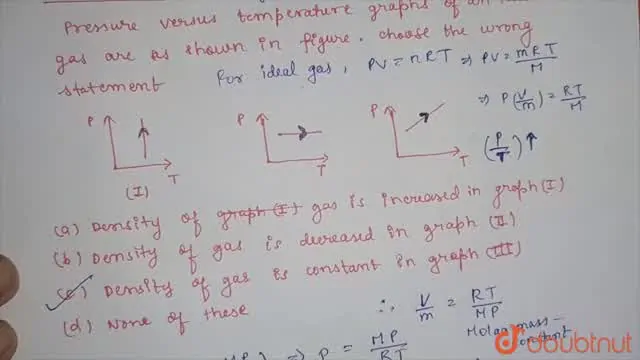
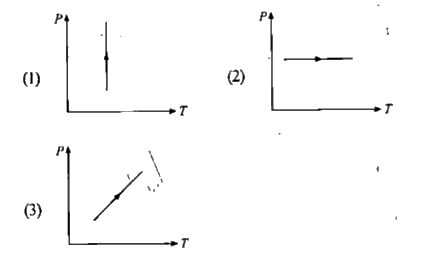
Pressure versus temperature graphs of an ideal gas are as shown in figure. Choose the wrong statement
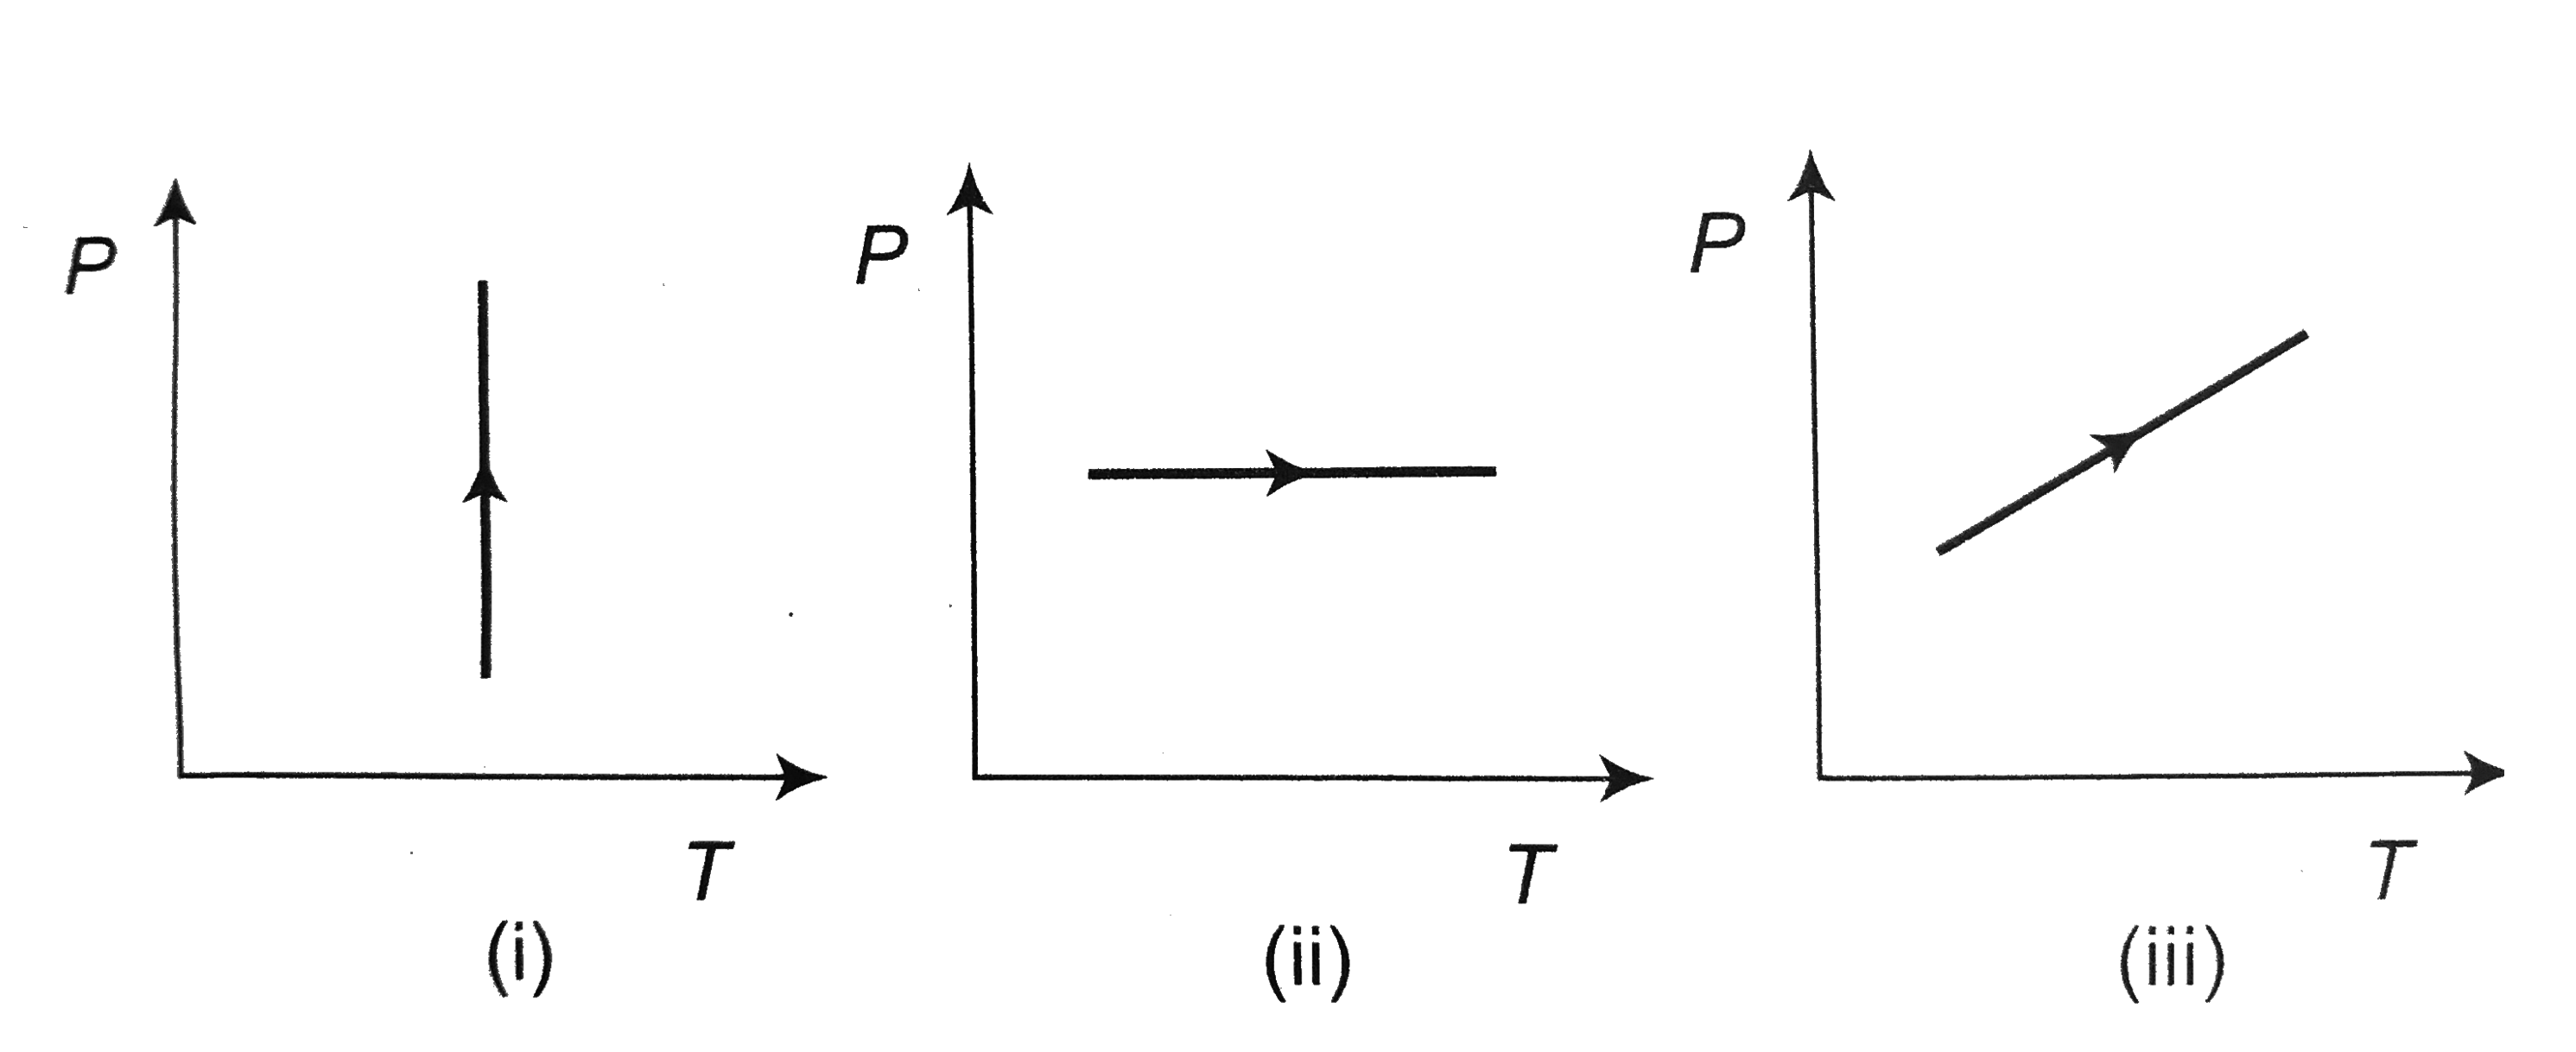
Density of gas is increased in graph (i)
Density of gas is decrease in graph (ii)
Density of gas is constant in graph (iii)
None of these
The correct Answer is:C
ρ=PMRT
Density ρ remains constant when P/T or volume is increasing at constant temperature hence volume is decreasing so density is increasing. Graphs (ii) and (iii) volume is increasing hence, density is decreasing. Note that volume would had been constant in case the straight line in graph (iii) had passed through origin.
Related Playlists
- BOOK - A2ZCHAPTER - KINETIC THEORY OF GASES AND THERMODYNAMICSEXERCISE - First Law Of Thermodynamics , Internal Energy And Work Done55videos
KINETIC THEORY OF GASES AND THERMODYNAMICS
- BOOK - A2ZCHAPTER - KINETIC THEORY OF GASES AND THERMODYNAMICSEXERCISE - Application Of First Law Of Thermodynamics In Different Situations25videos
KINETIC THEORY OF GASES AND THERMODYNAMICS
- BOOK - A2ZCHAPTER - KINETIC THEORY OF GASES AND THERMODYNAMICSEXERCISE - Chapter Test29videos
KINETIC THEORY OF GASES AND THERMODYNAMICS
- BOOK - A2ZCHAPTER - GRAVITATIONEXERCISE - Chapter Test29videos
GRAVITATION
- BOOK - A2ZCHAPTER - MOCK TESTEXERCISE - Motion With Constant Acceleration15videos
MOCK TEST
Similar Questions
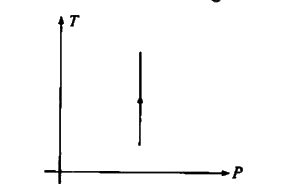
Pressure versus temperature graph of an ideal gas are as shown in figure-2.39. Choose the wrong statement
 View Solution
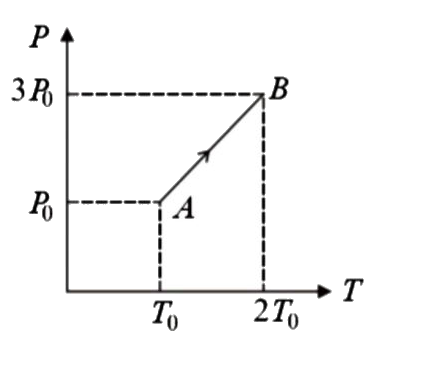
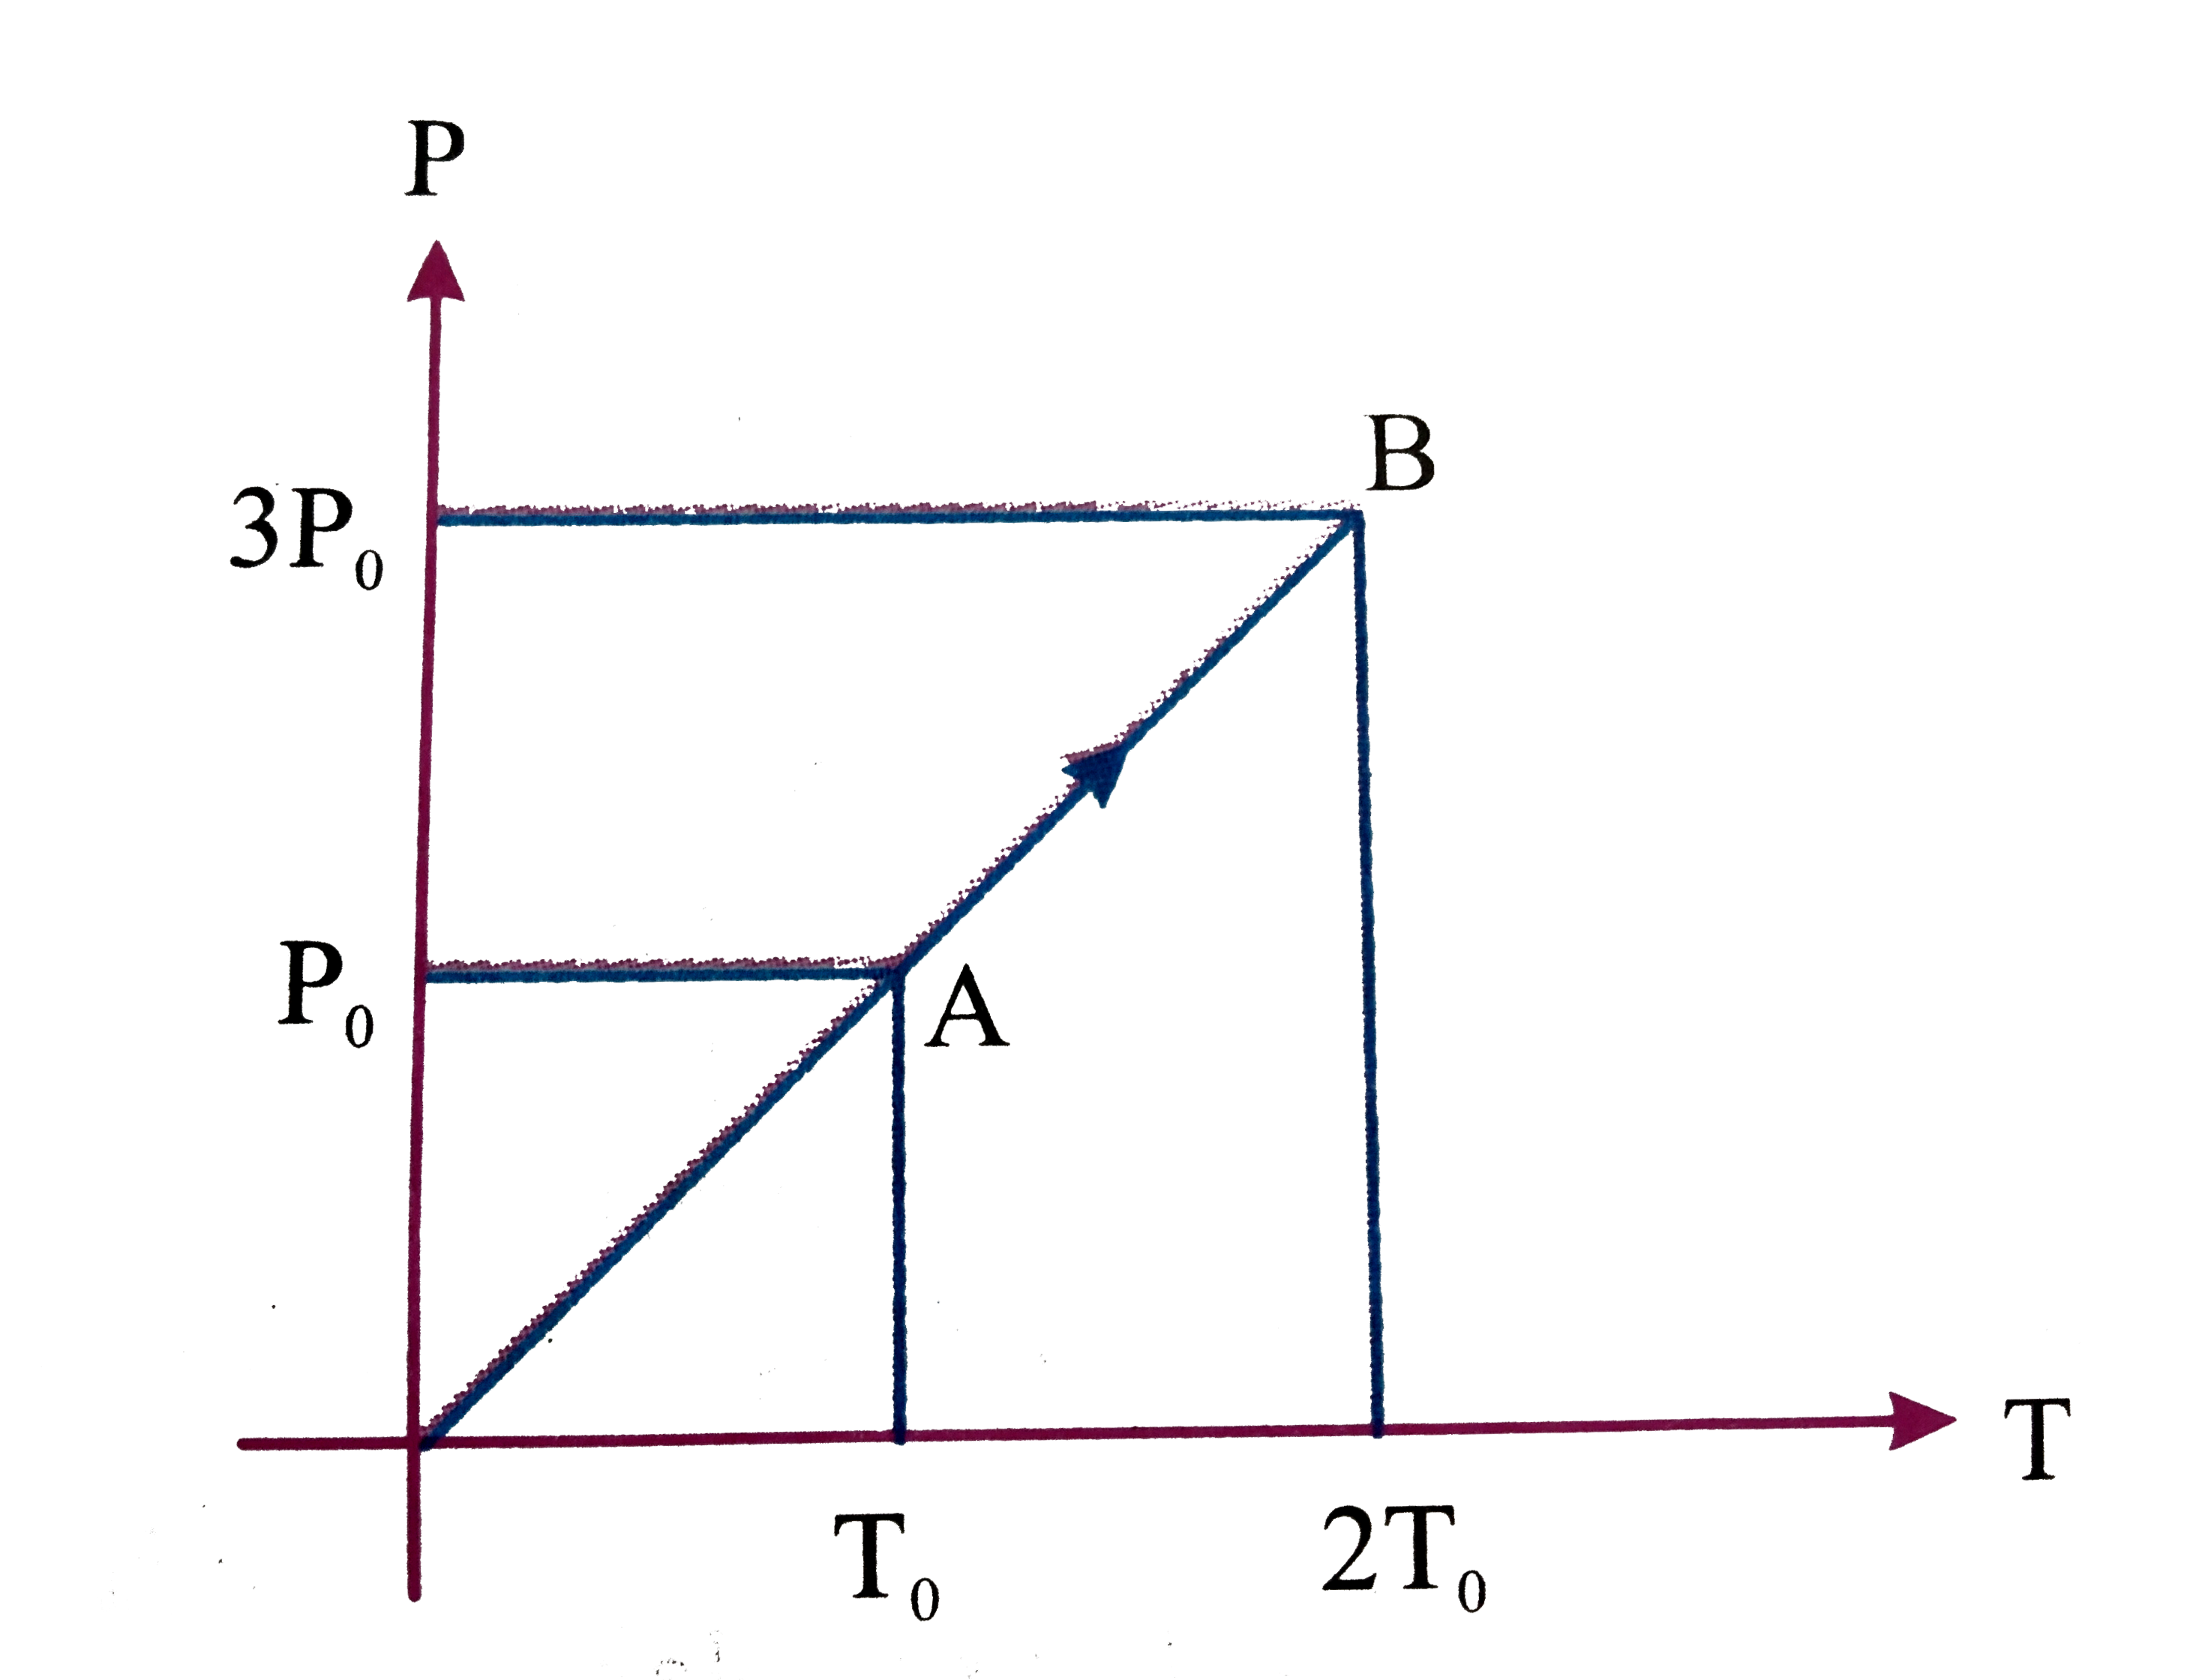
Pressure versus temperature graph of an ideal gas is as shown in figure. Density of the gas at point A is ρ0. Density at point B will be :-
 View Solution
Pressure versus temperature graph of an ideal gas is shown in figure. Density of the gas at point A is P0. Density at B will be
 View Solution
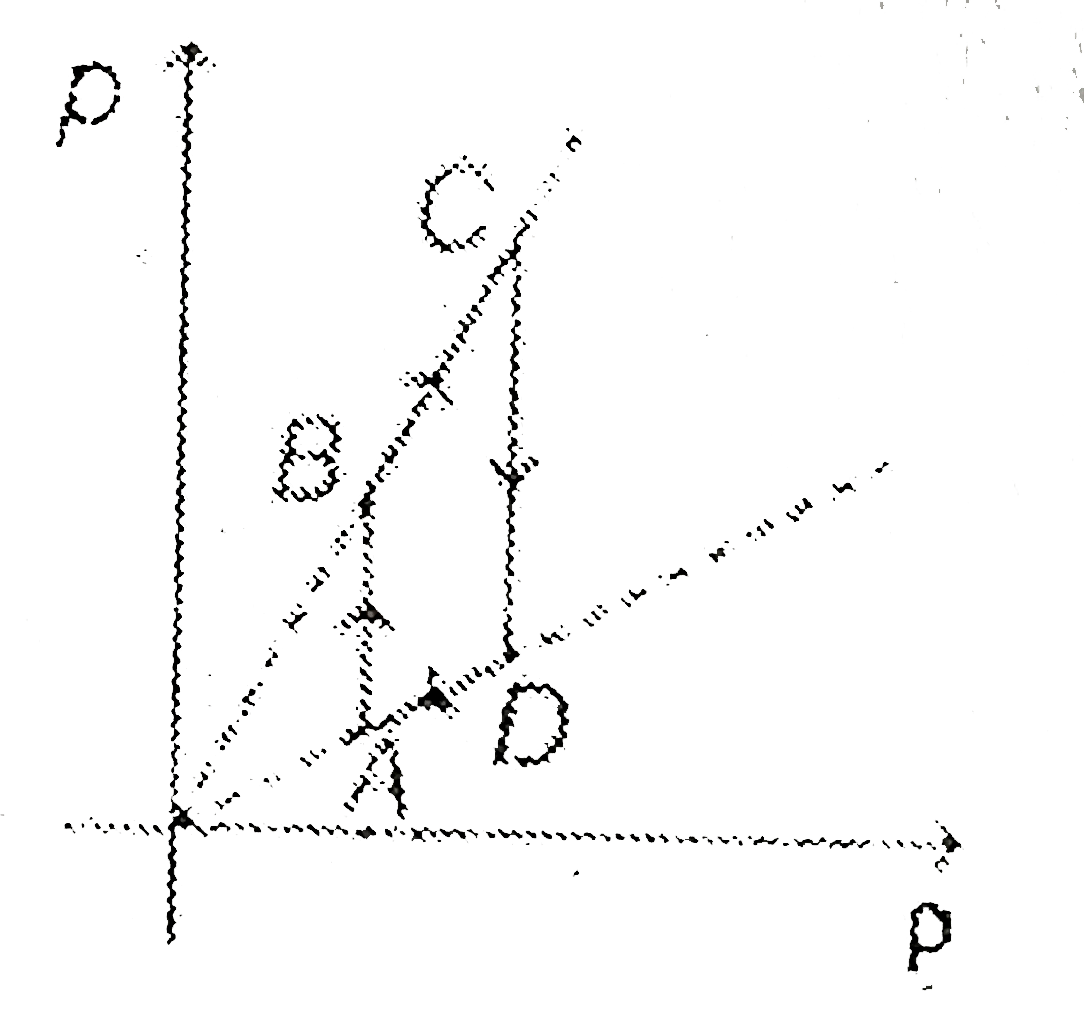
Pressure versus density graph of an ideal gas is shown in figure
 View Solution
Pressure versus temperature graph of an ideal gas is shown in figure. Density of the gas at point A is ρ0. Density at B will be
 View Solution
Pressure (P) versus temperature (T) graph of an ideal gas is shown in the figure. Density of the gas at point A is ρ0 and at B is ρ. Find ρρ0.
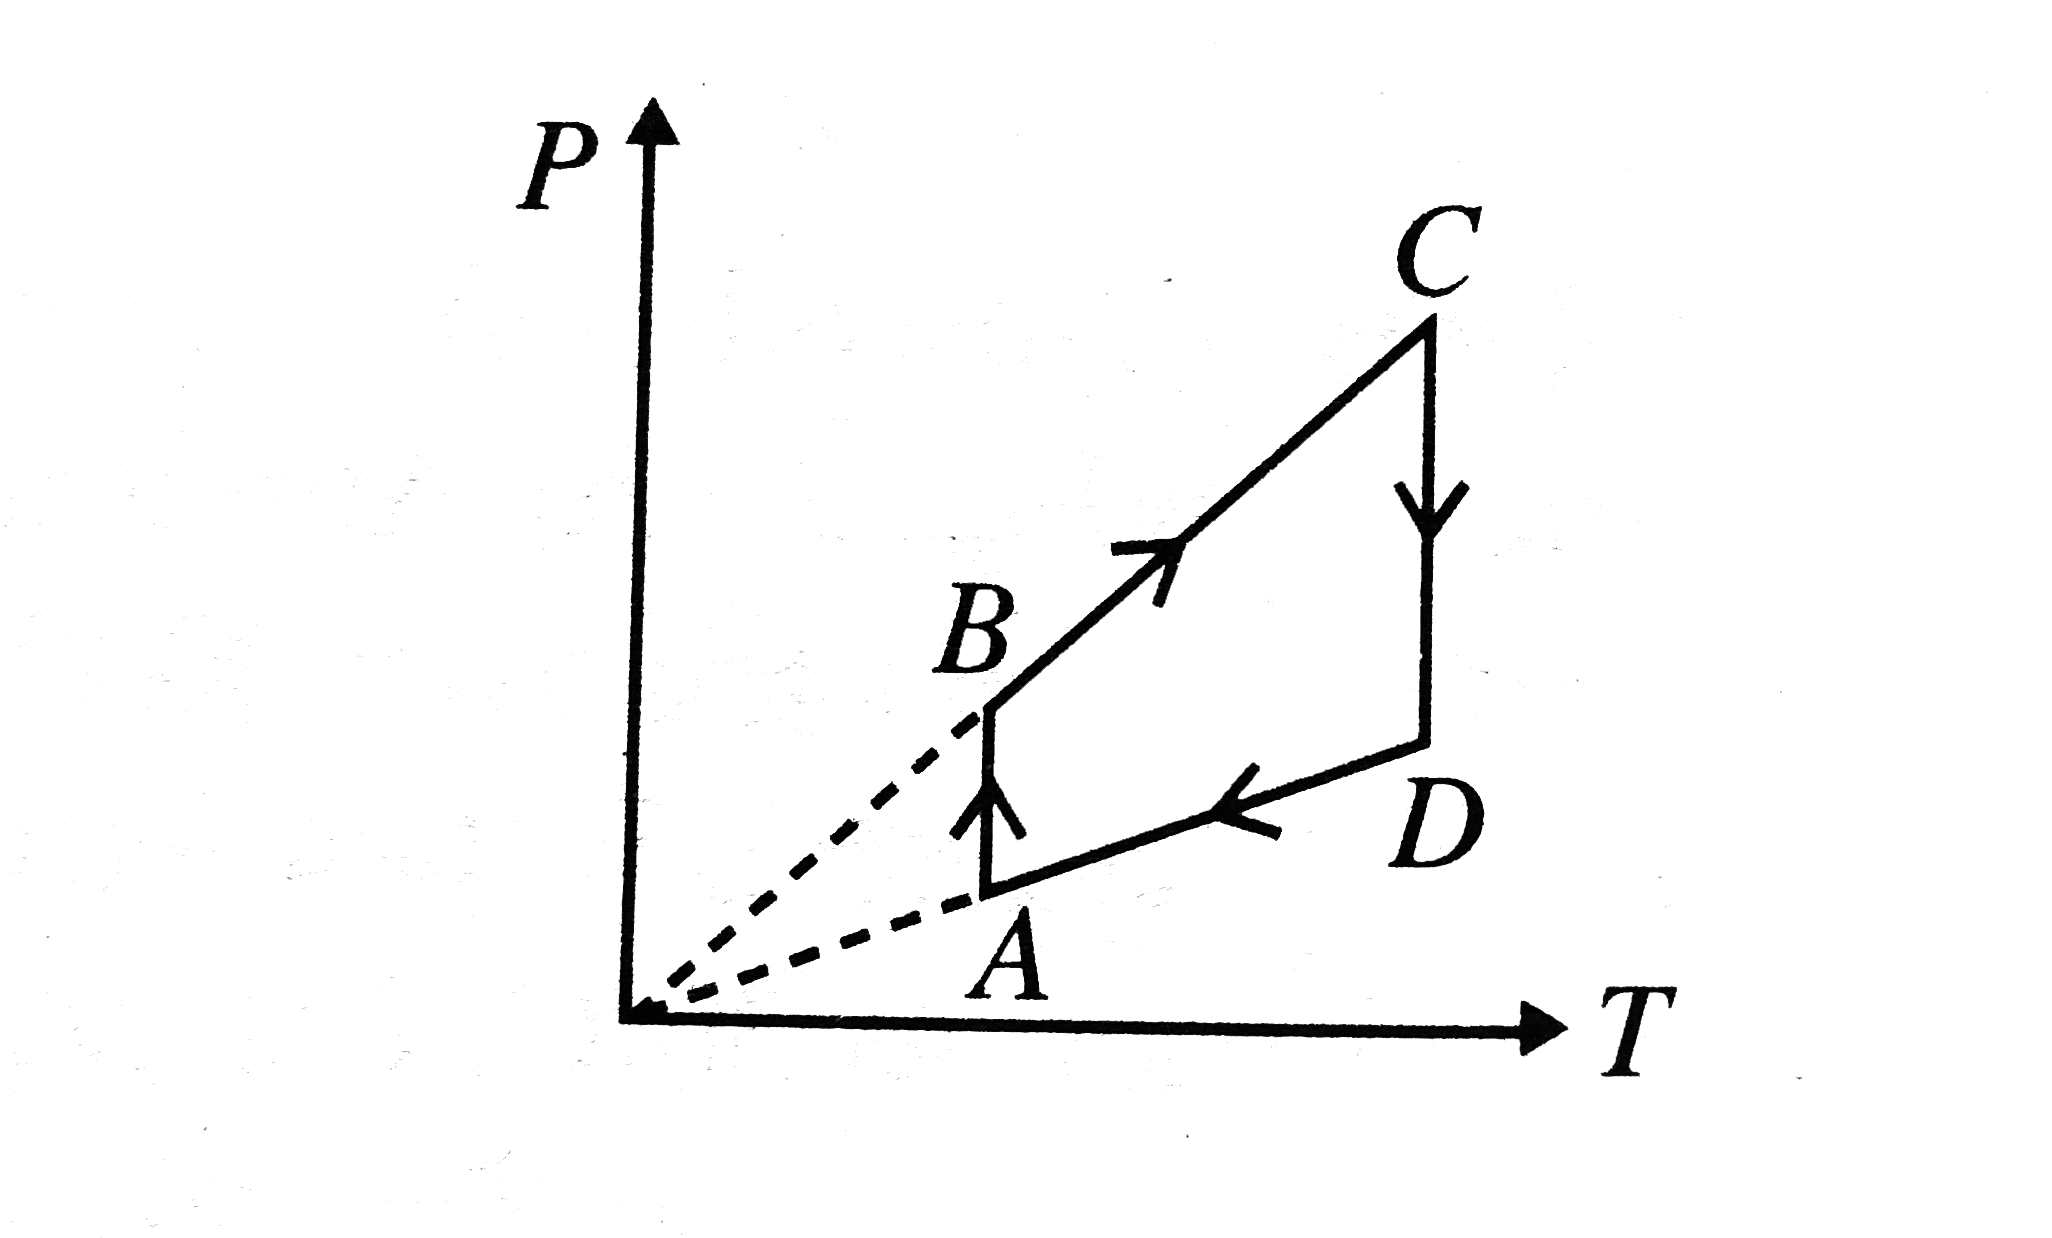
'(##CEN_KSR_PHY_JEE_C13_E01_014_Q04##)'View SolutionPressure versus temperature graph of an ideal gas as shown in Fig.
Corresponding density (ρ) versus volume (V) graph will be
 View Solution
P-T graphs of an ideal gas are as shown in figures-2.42 below. Choose the wrong statement from the options given:
 View Solution
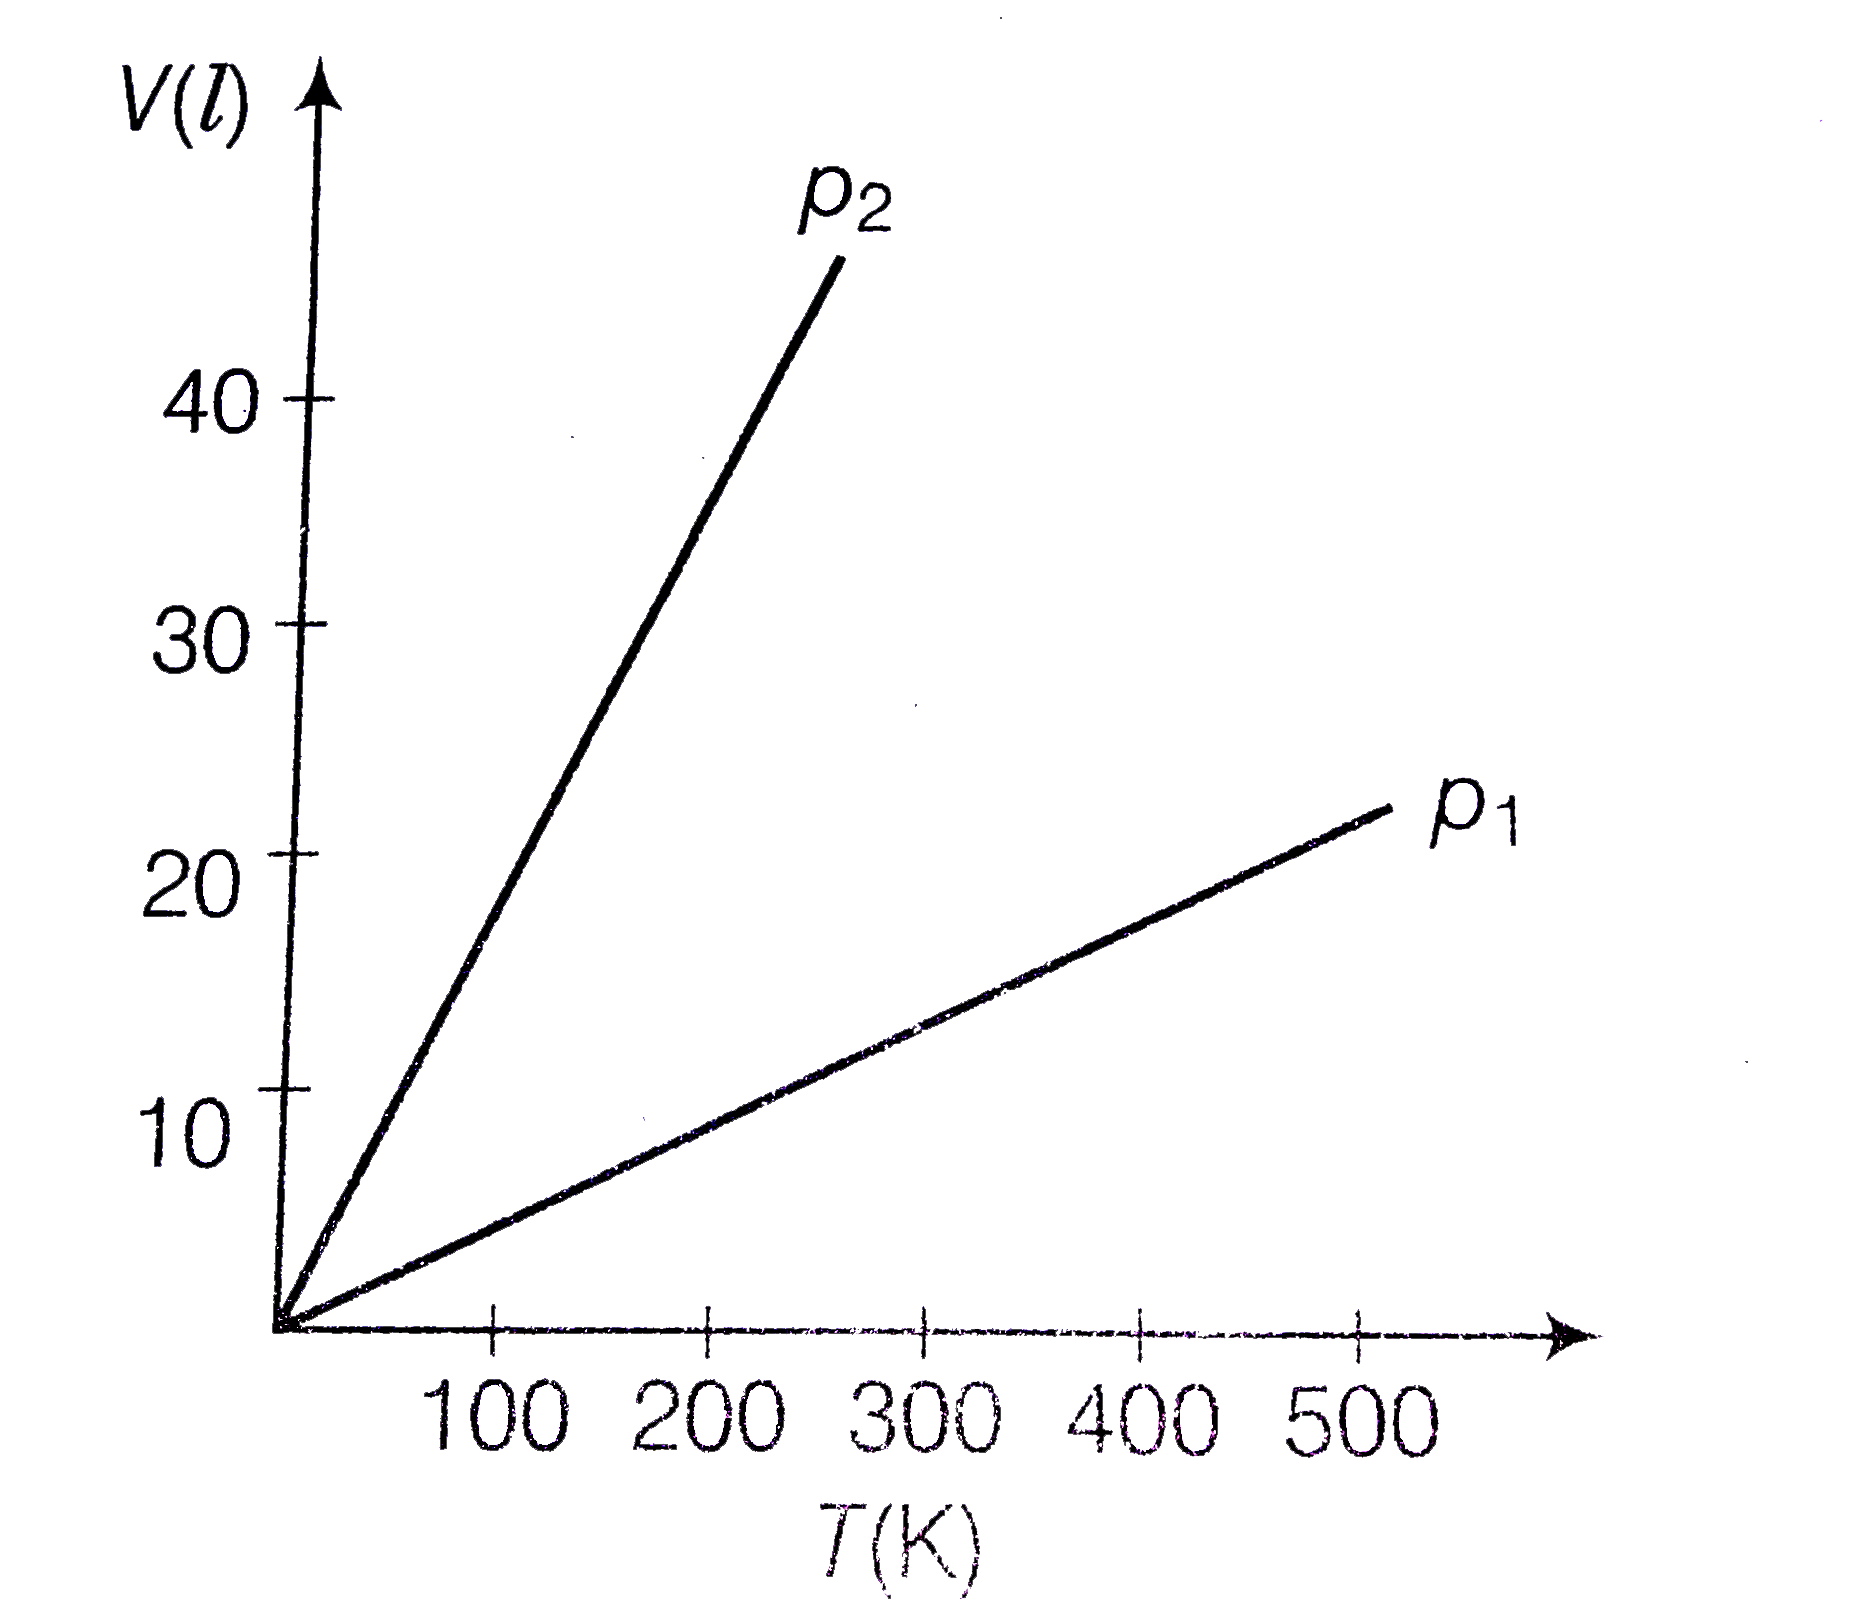
Volume versus temperature graphs for a given mass of an ideal gas are shown in figure. At two different values of constant pressure. What can be inferred about relation between P1 and P2 ?
 View Solution
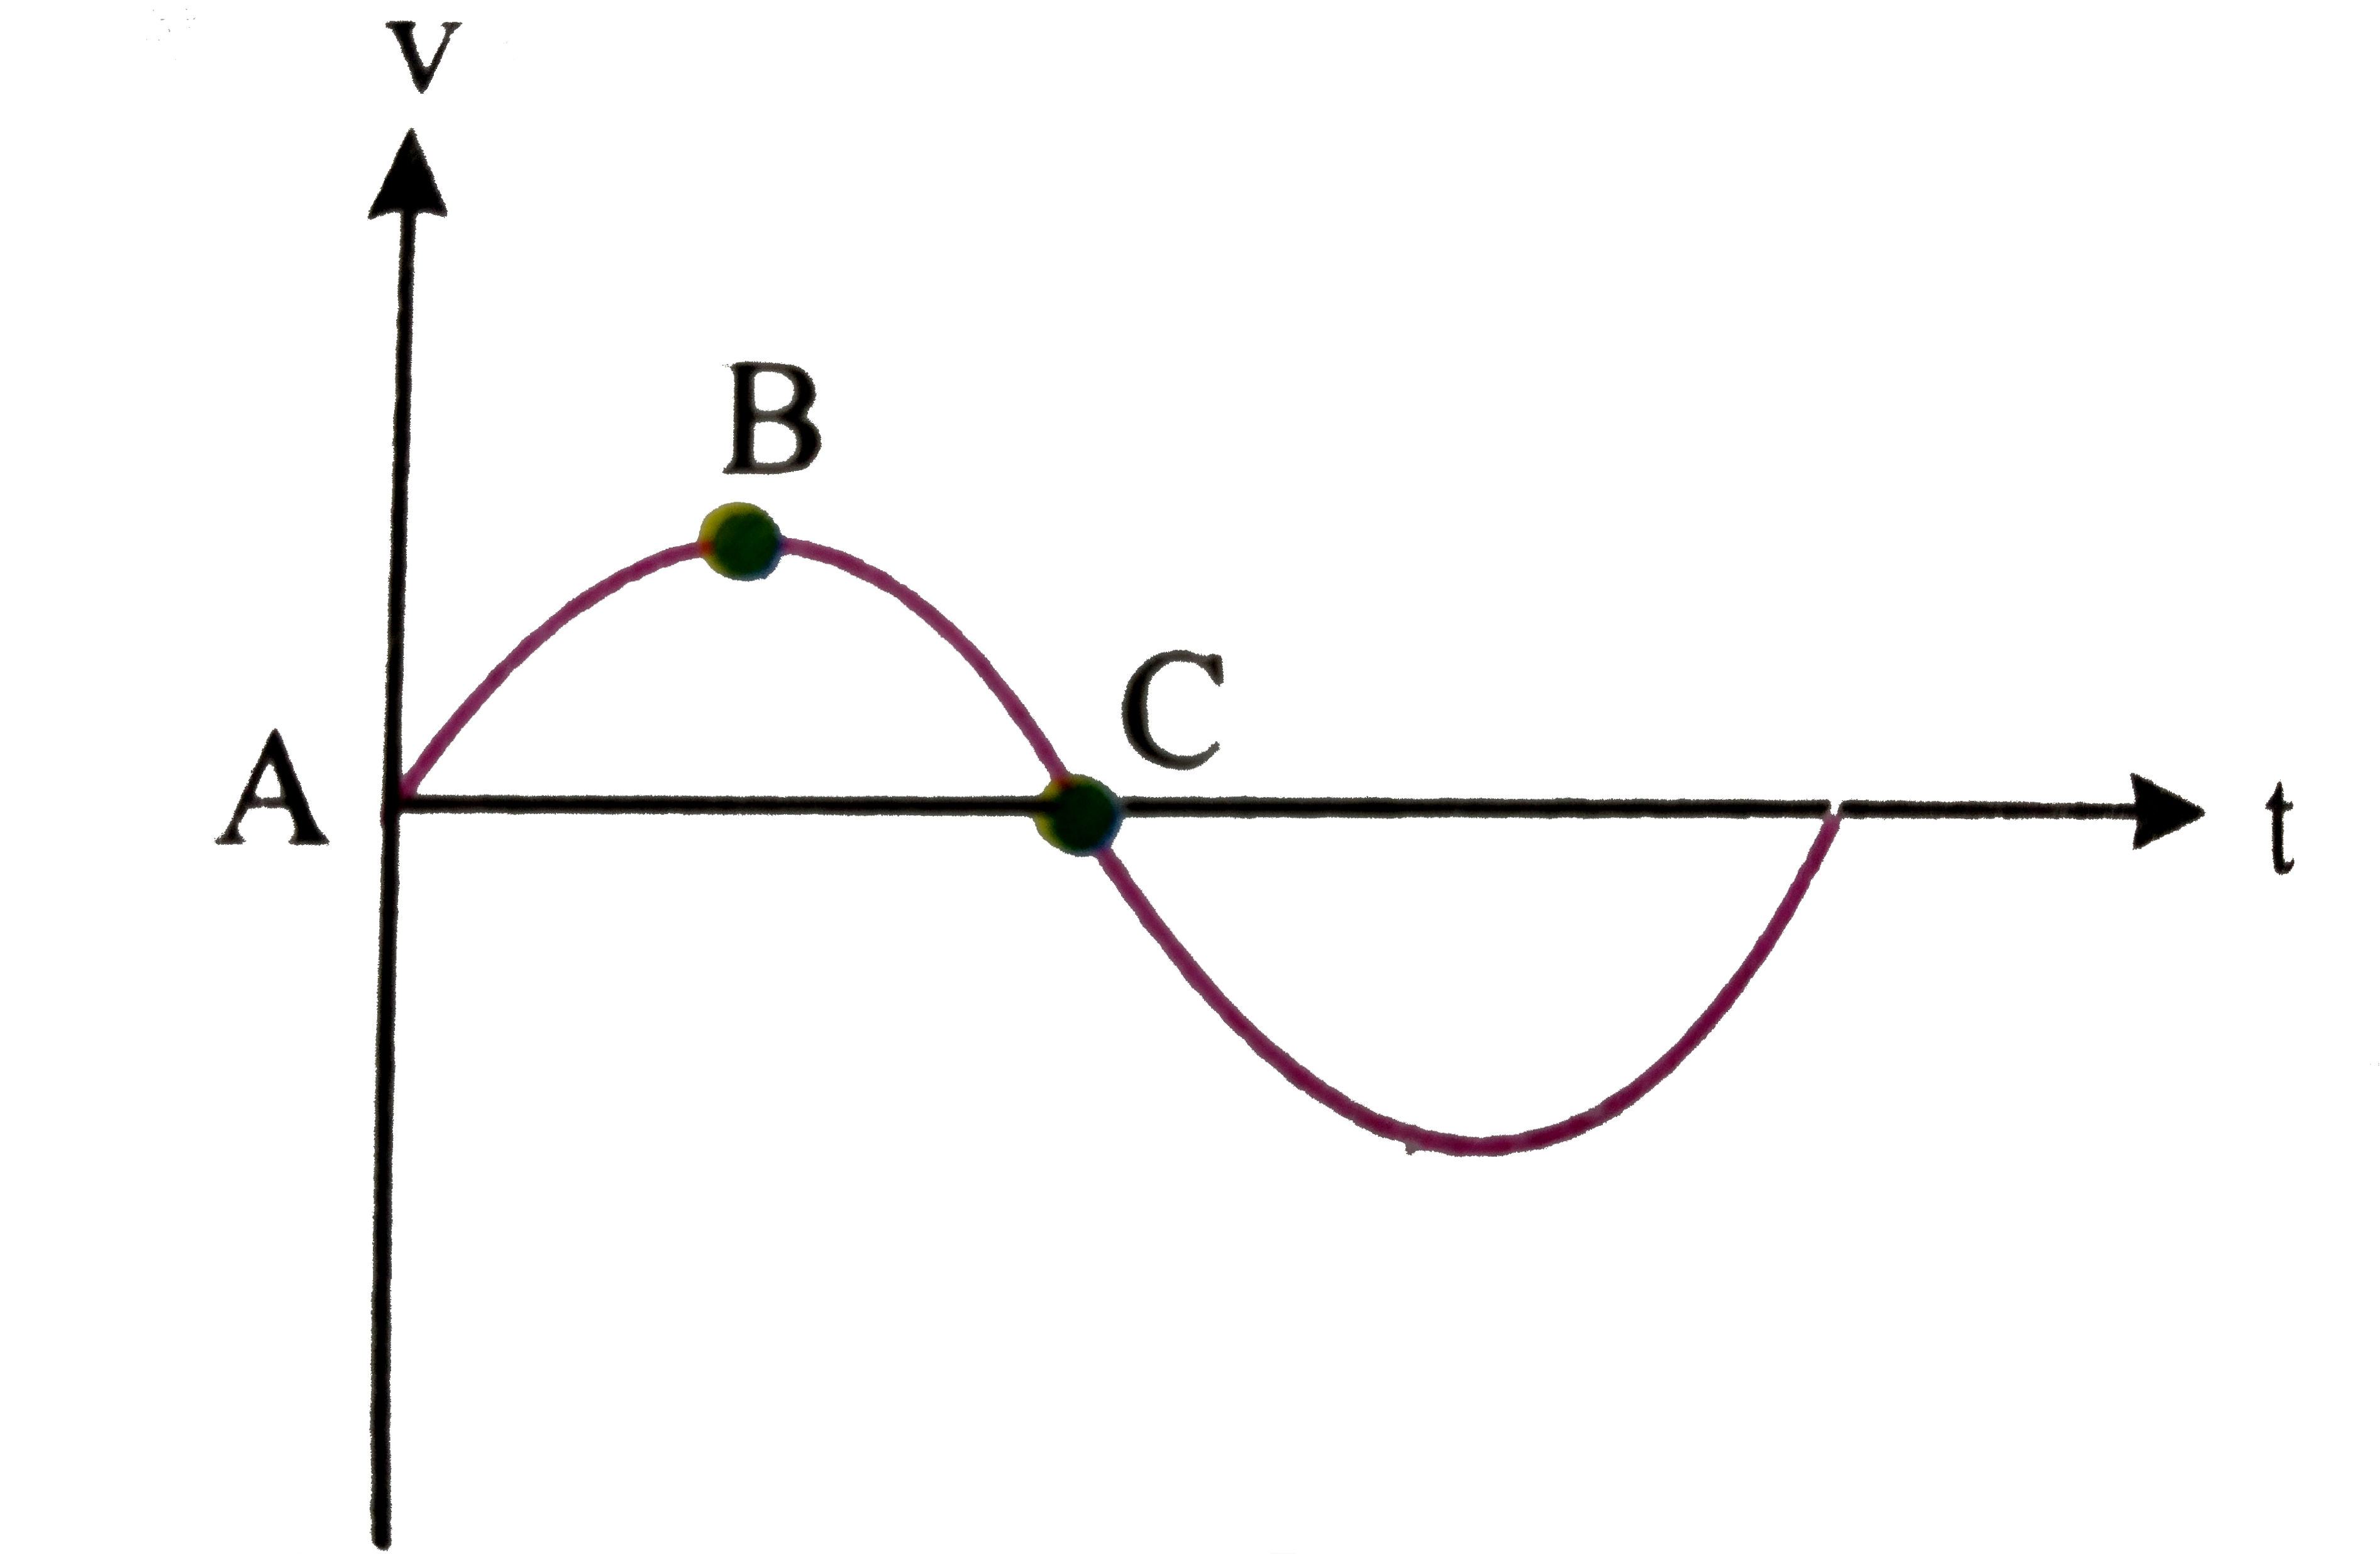
v−t graph of a particle in SHM is as shown is figure. Choose the wrong option.
 View Solution

