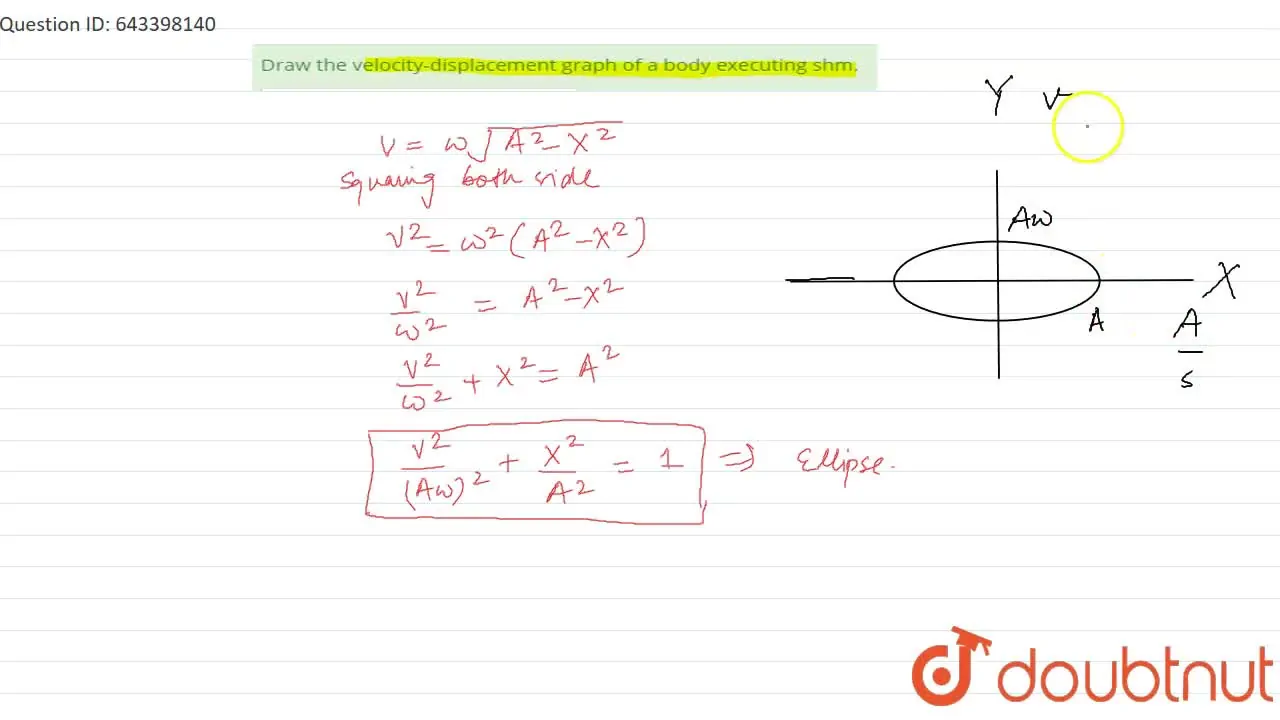
Draw the velocity-displacement graph of a body executing shm.
The graph is as shown in Fig. As the displacement of the particle changes from - a to ta the velocity increases from zero to maximum at the equilibrium position and then decreases to zero at the extreme position + a, where a is the amplitude of the particle. In the second half of the oscillation the direc-X. tion of the velocity is changed. The -a +a shape of the graph will be the same, but Fig. it will below X.OX.

Related Playlists
- BOOK - ICSECHAPTER - OSCILLATIONS EXERCISE - LONG ANSWER QUESTIONS3videos
OSCILLATIONS
- BOOK - ICSECHAPTER - OSCILLATIONS EXERCISE - SHORT ANSWER QUESTIONS47videos
OSCILLATIONS
- BOOK - ICSECHAPTER - OSCILLATIONS EXERCISE - ADDITIONAL SOLVED PROBLEMS11videos
OSCILLATIONS
- BOOK - ICSECHAPTER - MOTION IN FLUIDS EXERCISE - SELECTED PROBLEMS (FROM POISEUILLE.S FORMULA)19videos
MOTION IN FLUIDS
- BOOK - ICSECHAPTER - PROPERTIES OF MATTEREXERCISE - MODULE 4 ( TEMPERATURE ) UNSOLVED PROBLEMS12videos
PROPERTIES OF MATTER
Similar Questions
Draw the displacement-time, velocity-time and acceleration-time graph of a body executing shm.
View SolutionDraw graph showing the variation of displacement with time of a body executing (i) free oscillation (ii) damped oscillations.
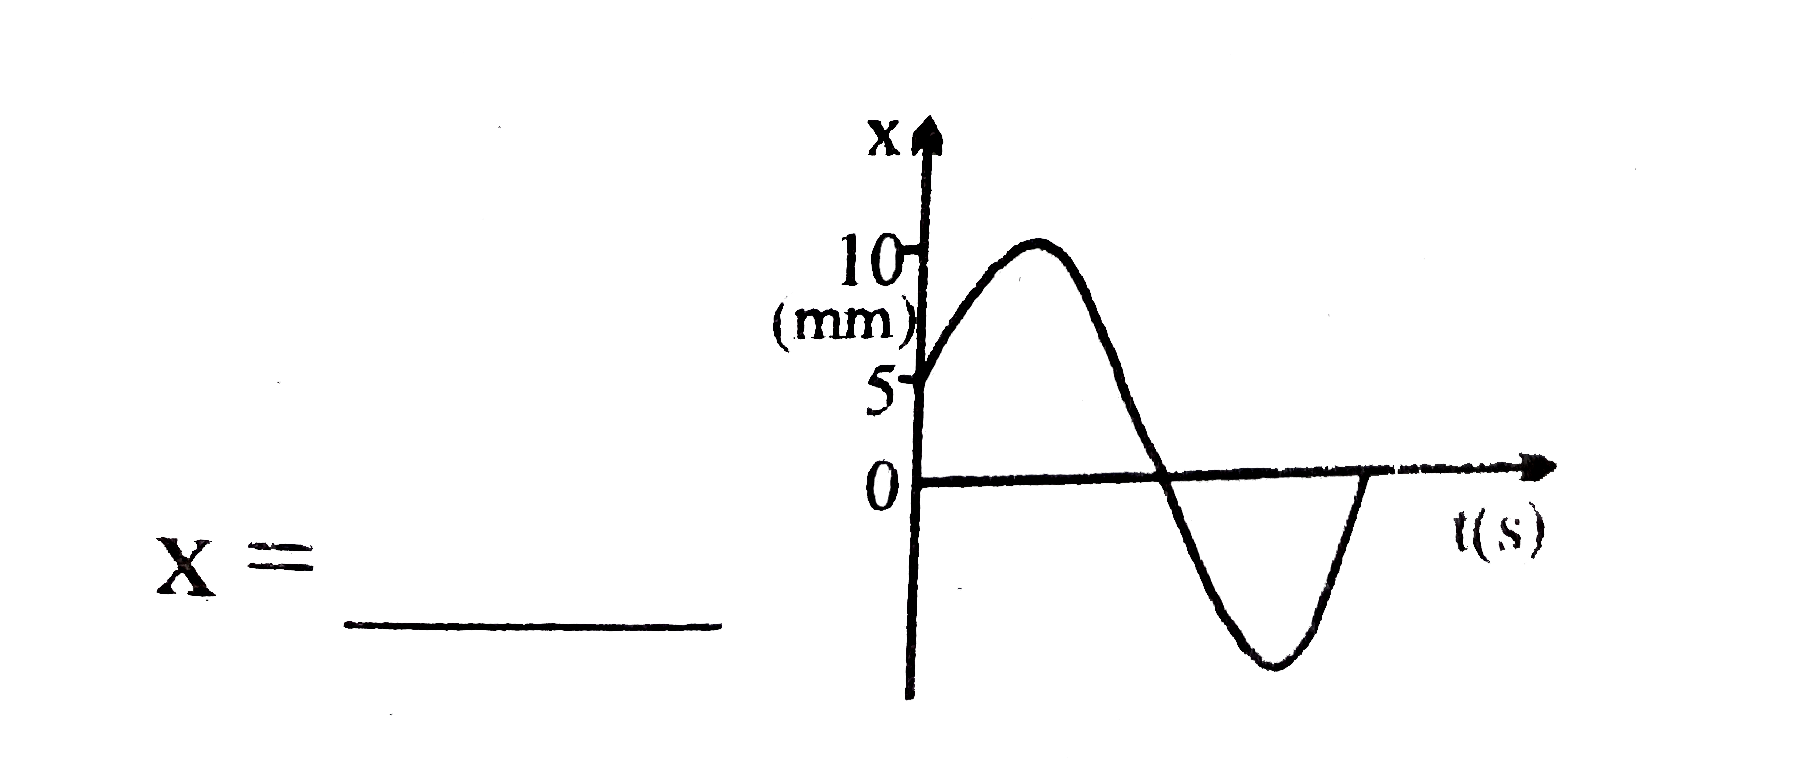
View SolutionThe figure shows the displacement-time graph of a particle executing SHM. If the time period of oscillation is 2s, then the equation of motion is given by
 View Solution
The figure shows the displacement-time graph of a particle executing SHM. If the time period of oscillation is 2s, then the equation of motion is given by
 View Solution
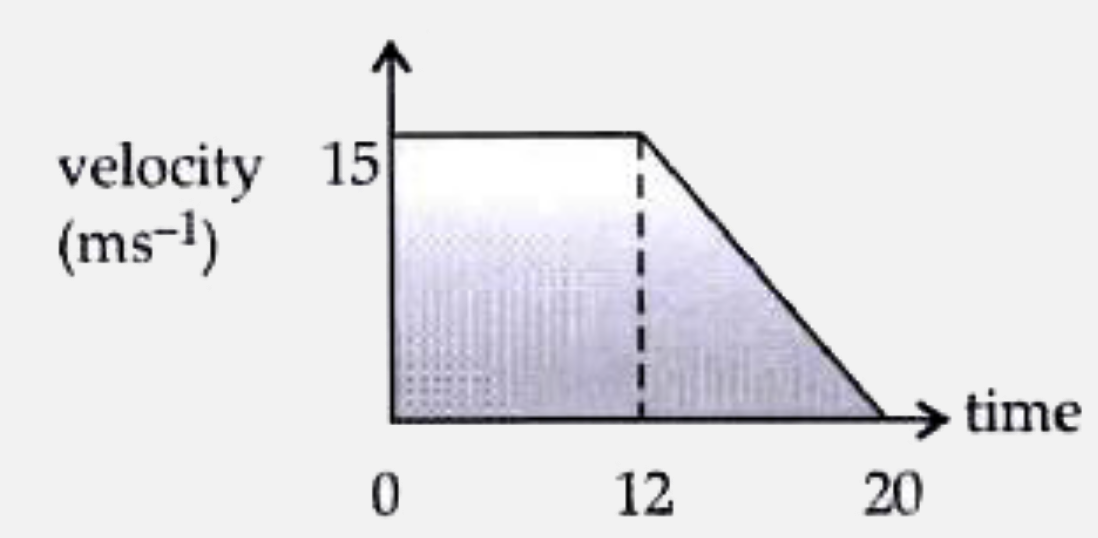
The figure below shows the velocity-time graph of a body moving in a straight line.

Find the total displacement of the body.View SolutionDraw a graph between displacement and time for a body executing natural vibrations.
View SolutionWrite down the differential equation of a body executing shm. Give its solution.
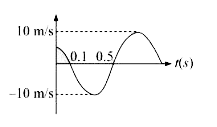
View SolutionThe velocity time graph of a particle executing SHM is shown. The maximum acceleration of the particle is nπm/s2, where n is______.
 View Solution
Draw the shape of the velocity-time graph for a body moving with (a) uniform velocity, (b) uniform acceleration.
View SolutionIf a graph is plotted between velocity (v) and displacement (y) of a particle executing SHM from mean position, then the nature of the graph is
View Solution


