In an experiment, the resistance of a material is plotted as a function of temperature (in some range).As shown in the figure, it is a straight line.
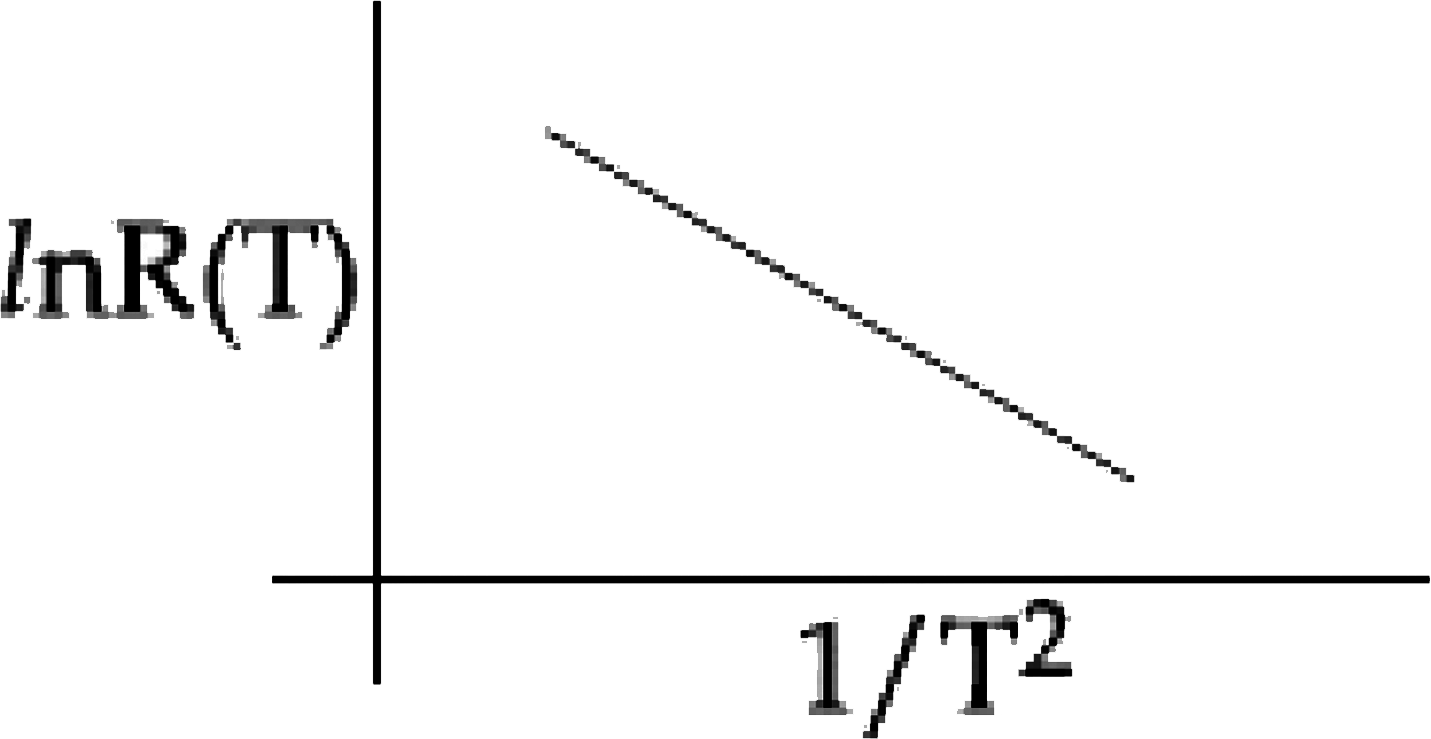
One may conclude that :
R(T)=R0T2
R(T)=R0e−T20/T2
R(T)=R0e−T2/T20
R(T)=R0e−T2/T20
The correct Answer is:C
Step by step video, text & image solution for In an experiment, the resistance of a material is plotted as a function of temperature (in some range).As shown in the figure, it is a straight line. One may conclude that : by Physics experts to help you in doubts & scoring excellent marks in Class 12 exams.
Topper's Solved these Questions
Similar Questions
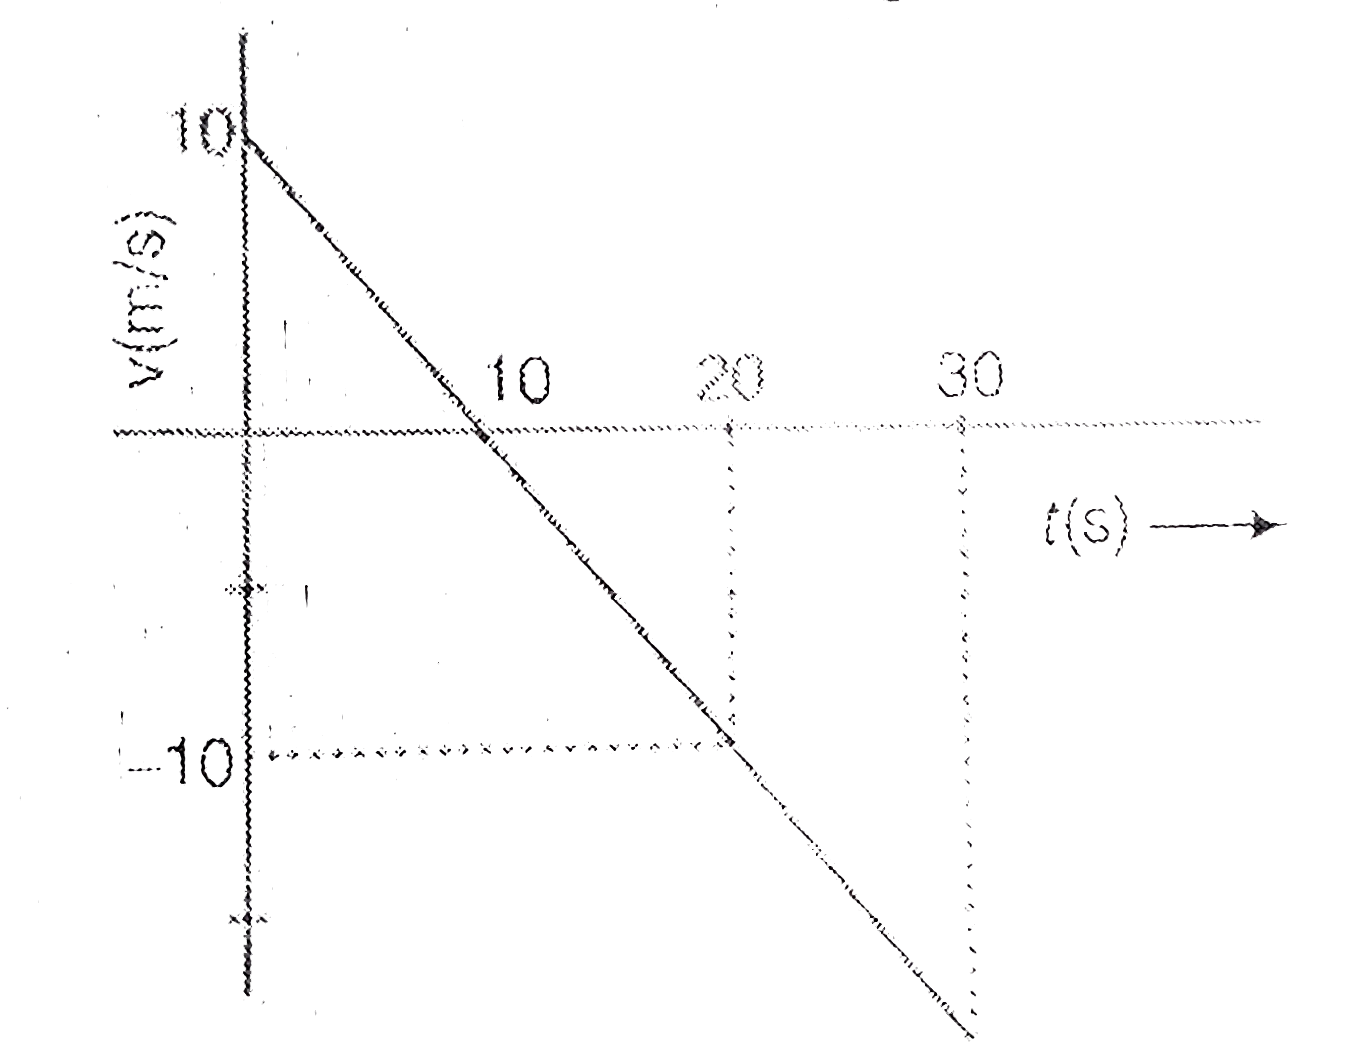
The velocity-time plot for a particle moving on a straight line is shown in the figure, then
 View Solution
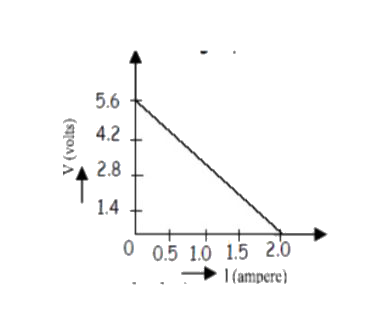
A straight line plot showing the terminal potential difference (V) of a cell as a function of current (I) drawn from it, is shown in the figure. The nternal resistance of the cell would be then-
 View Solution
Knowledge Check
- Question 1 - Select One
From athe velocity time graph, given in of a particle moving in a straight line, one can conclude that
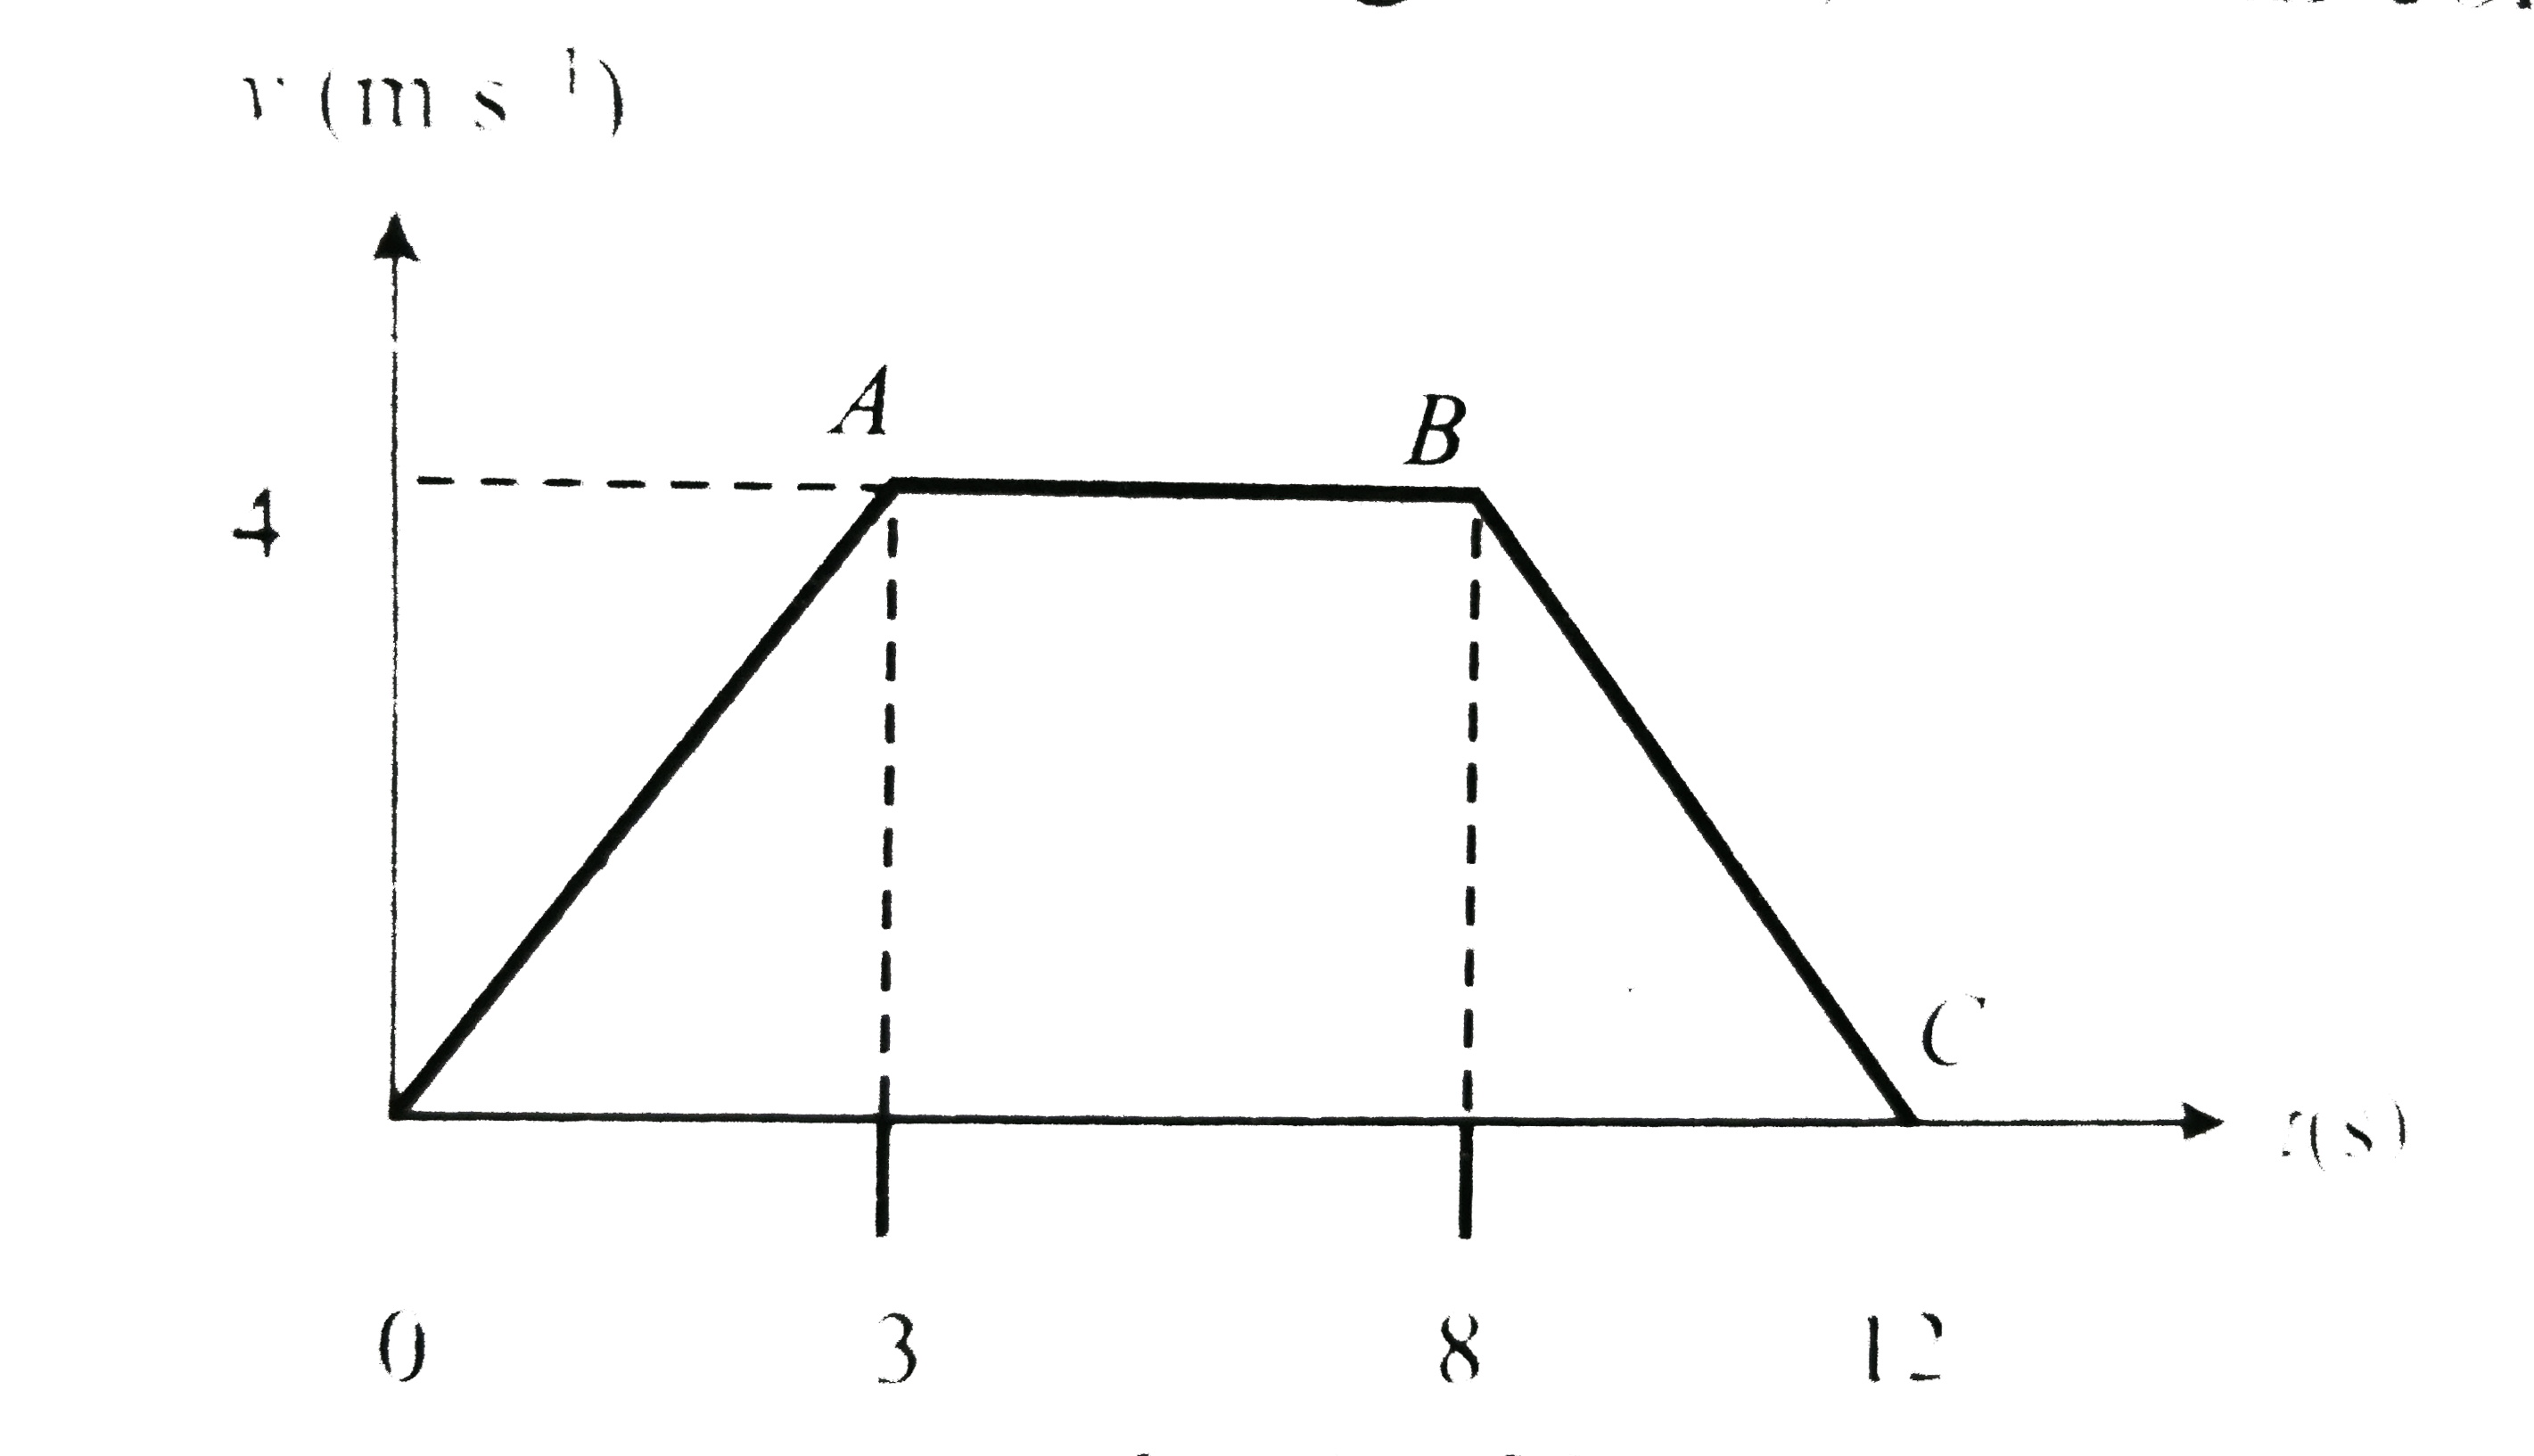 .AIts average velocity during the 12s interval is 24/7ms−1.BIts velocity for the first 3s is uniform and is eual to 4ms−1.CThe body has a constant acceleration between t=3s and t=8s.DThe body has a uniform retardation from t=8s to t=12s.
 - Question 2 - Select One or More
The velocity time plot for a particle moving on straight line is shown in the figure.
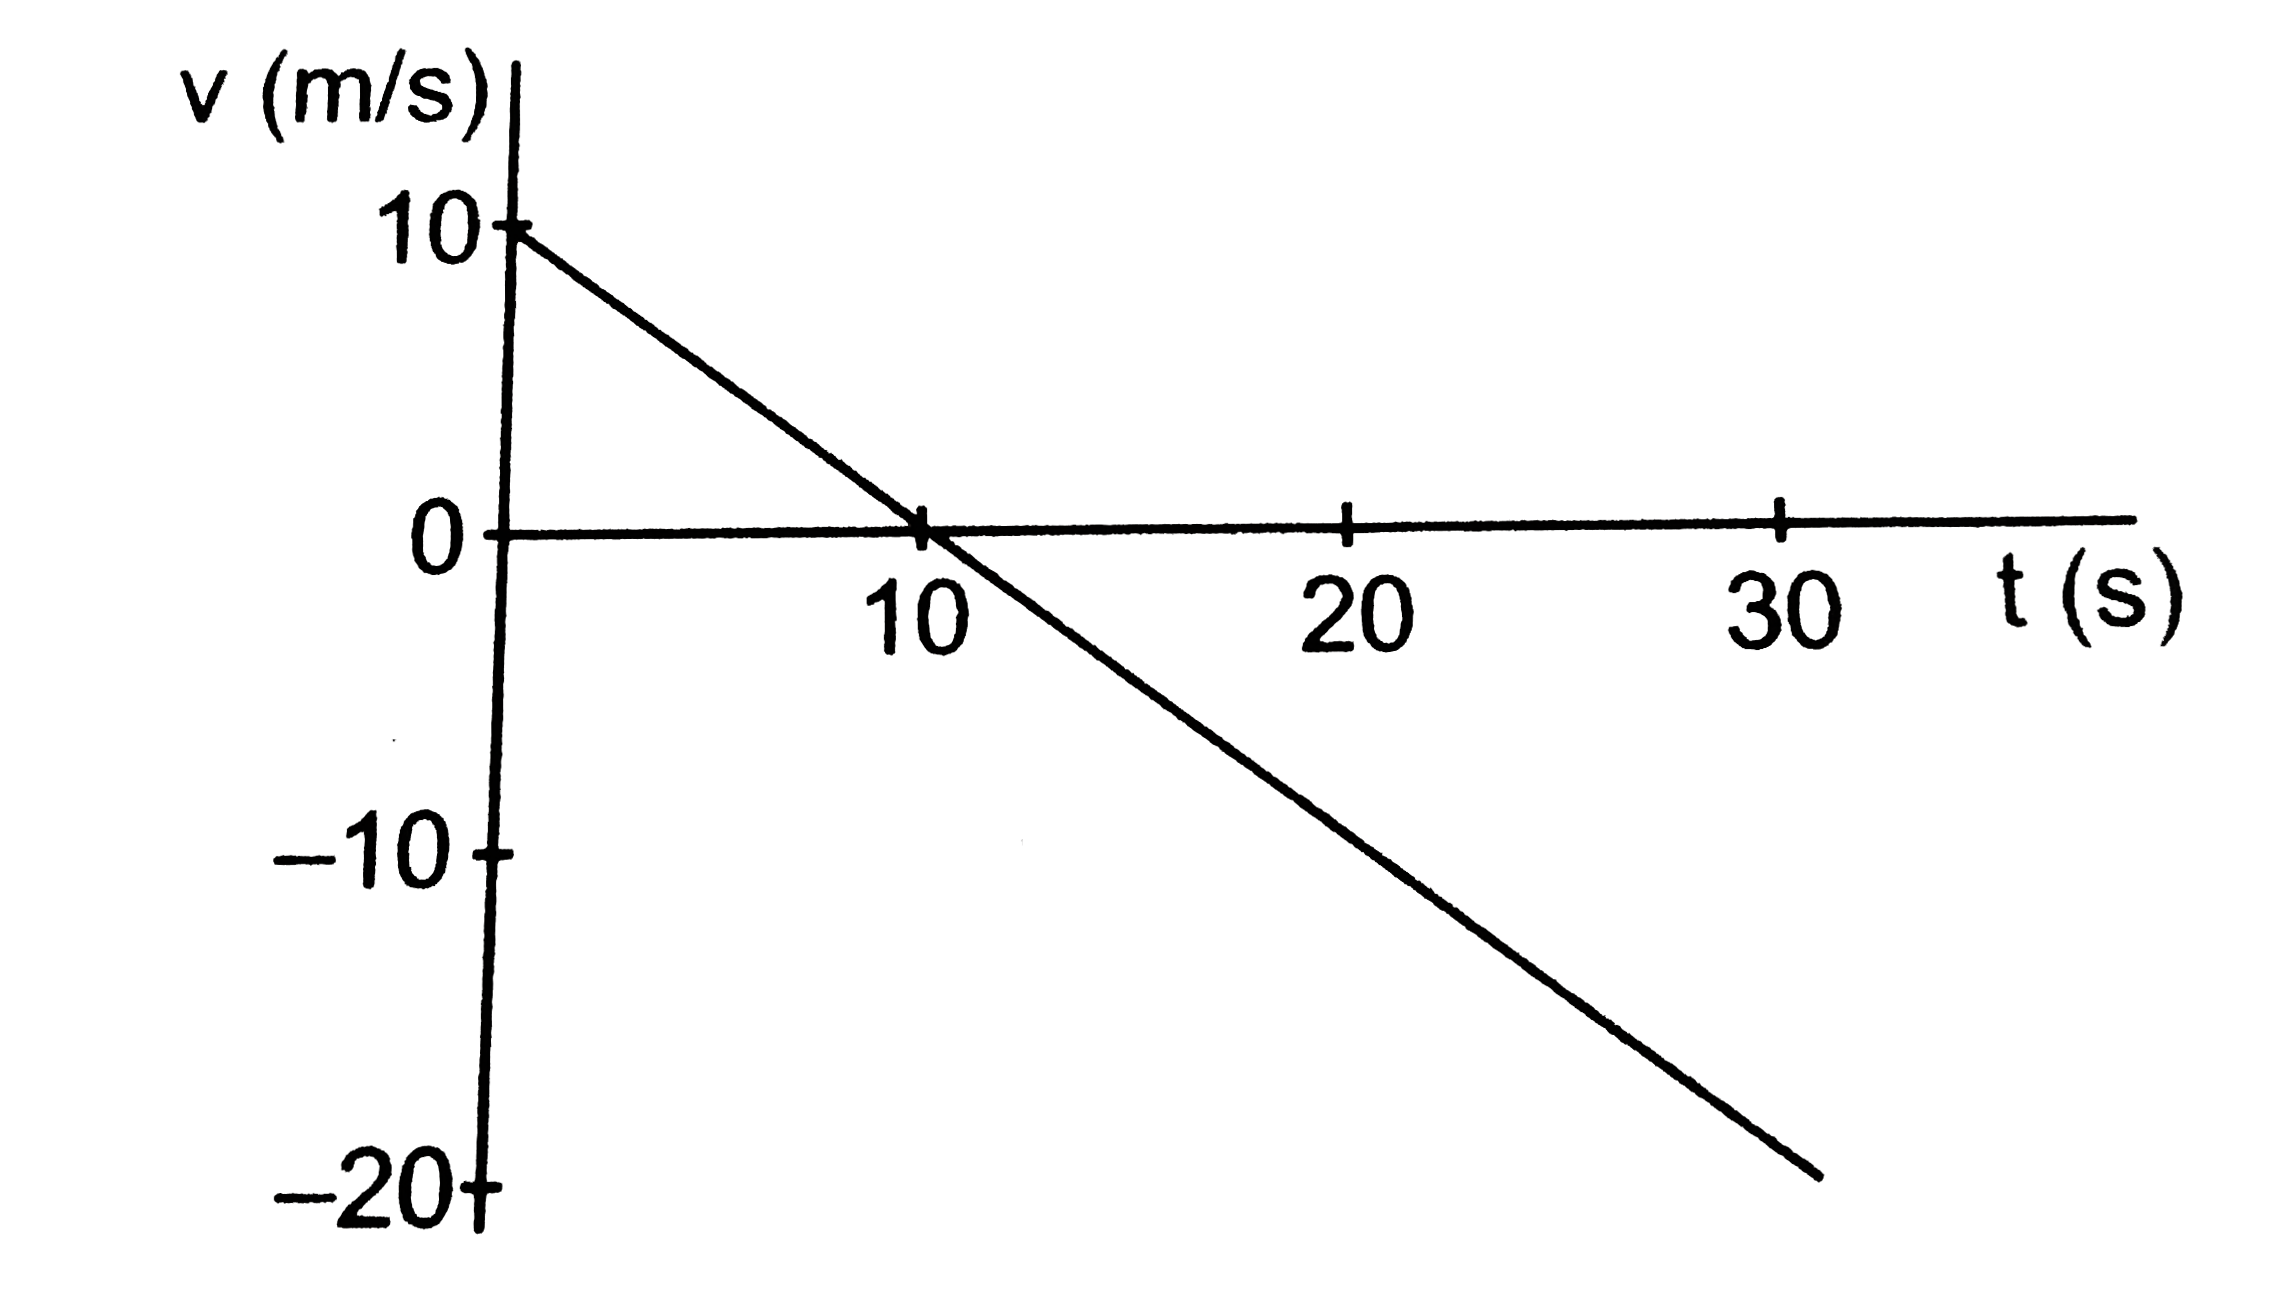 AThe particle has a constant accelerationBThe particle has nevedr turned aroundCThe paeticle has zero displacement.DThe average speed in the interval 0 to 10 s is the same as the average speed in the interval 10 s to 20s.
 - Question 3 - Select One
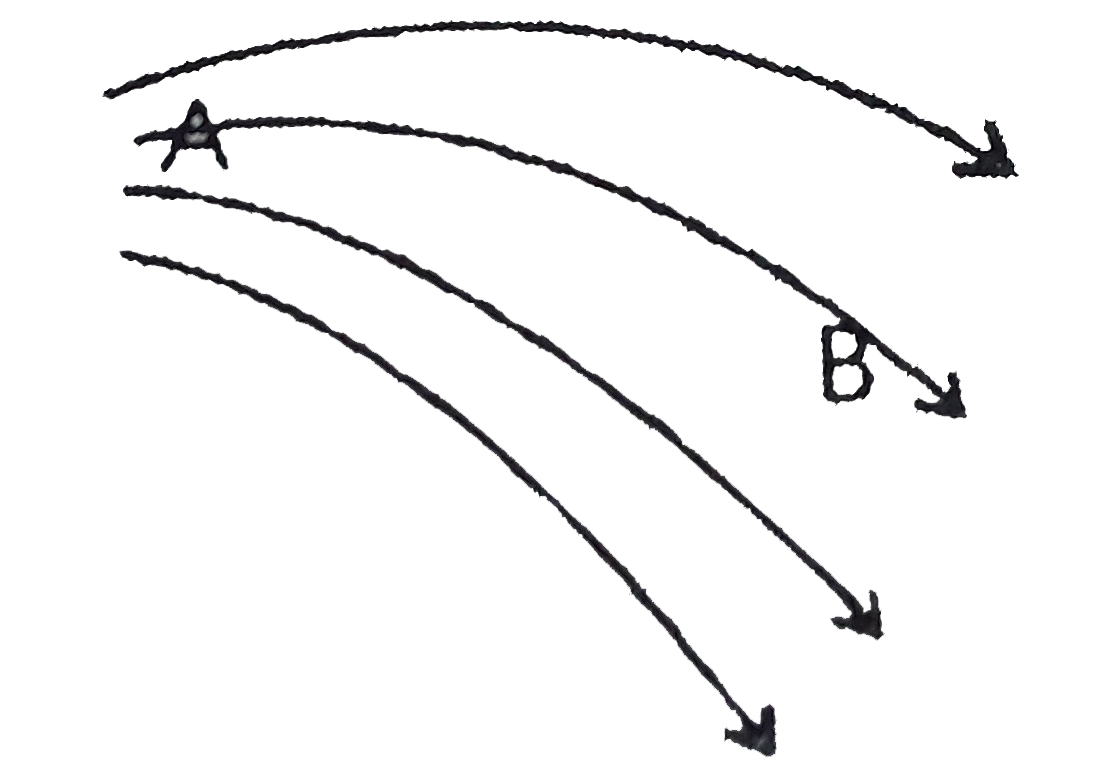
Some electric lines of force are shown in figure, for point A and B
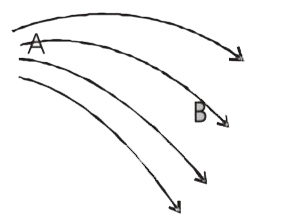 AEA>EBBEB>EACVA>VBDVB>BA
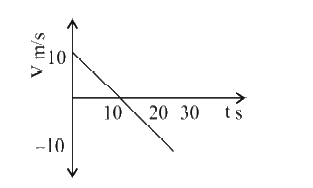
The velocity- time plot for a particle moving on a straight line is shown in the figure
 View Solution
The graph between resistivity and temperature, for a limited range of temperature, is a straight line for a material like
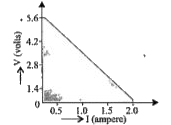
View SolutionA straight line plot showing the terminal potential difference (V) of a cell as a function of current (1) drawn from it, is shown in the figure. The internal resistance of the cell would be then:
 View Solution
Some electric lines of force are shown in figure. For points a and B
 View Solution
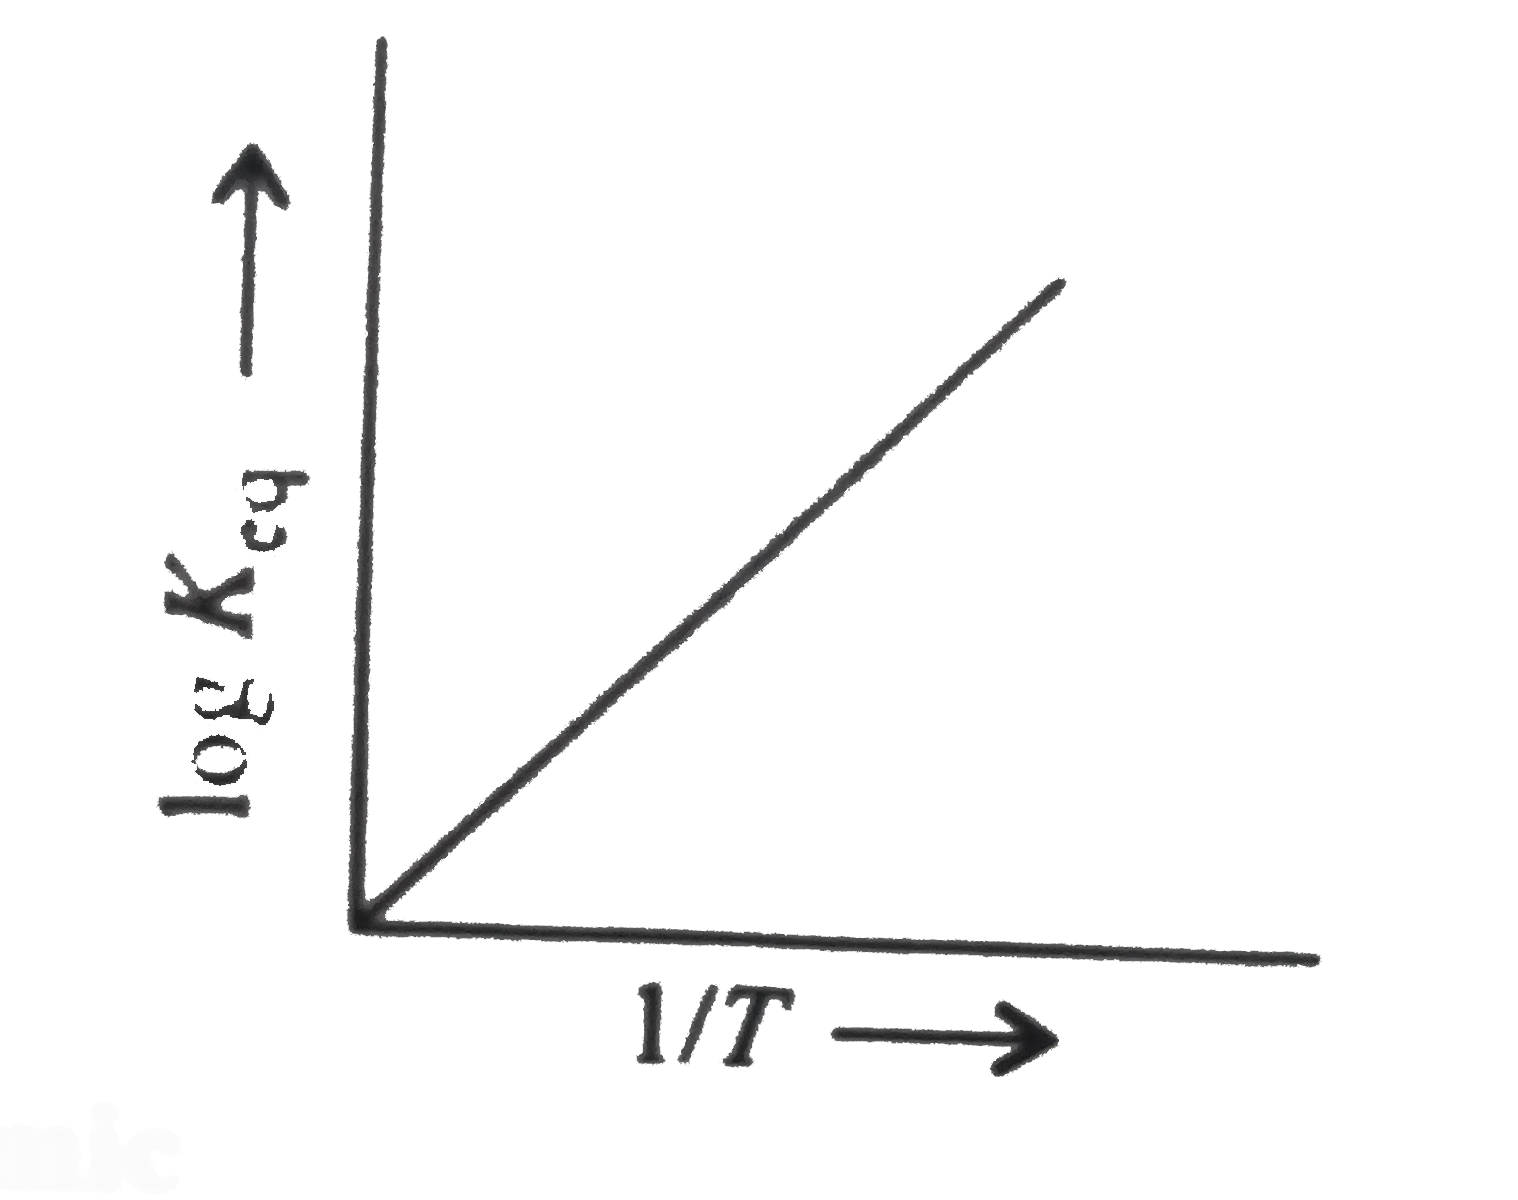
A schematic plot of log Keq vs inverse of temperature for a reaction is shown in the figure. The reaction must be:
 View Solution

