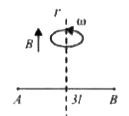
A uniform rod of length l is rotating with constant angular speed ω as shown in figure. Choose the graph which correctly shows the variation of T with x.
_2019_CBT7_E01_017_Q01.png)
_2019_CBT7_E01_017_O01.png)
_2019_CBT7_E01_017_O02.png)
_2019_CBT7_E01_017_O03.png)
_2019_CBT7_E01_017_O04.png)
The correct Answer is:A
Step by step video, text & image solution for A uniform rod of length l is rotating with constant angular speed omega as shown in figure. Choose the graph which correctly shows the variation of T with x. by Physics experts to help you in doubts & scoring excellent marks in Class 12 exams.
Updated on:21/07/2023Topper's Solved these Questions
Similar Questions
A uniform rod of mass m and length l0 is rotating with a constant angular speed ω about a vertical axis passing through its point of suspension. Find the moment of inertia of the rod about the axis of rotation if it make an angle θ to the vertical (axis of rotation).
View SolutionA conducting rod of length l is rotating with constant angular velocity ω about point O in a uniform magnetic field B as shown in the figure . What is the emf induced between ends P and Q ?

View Solution
Knowledge Check
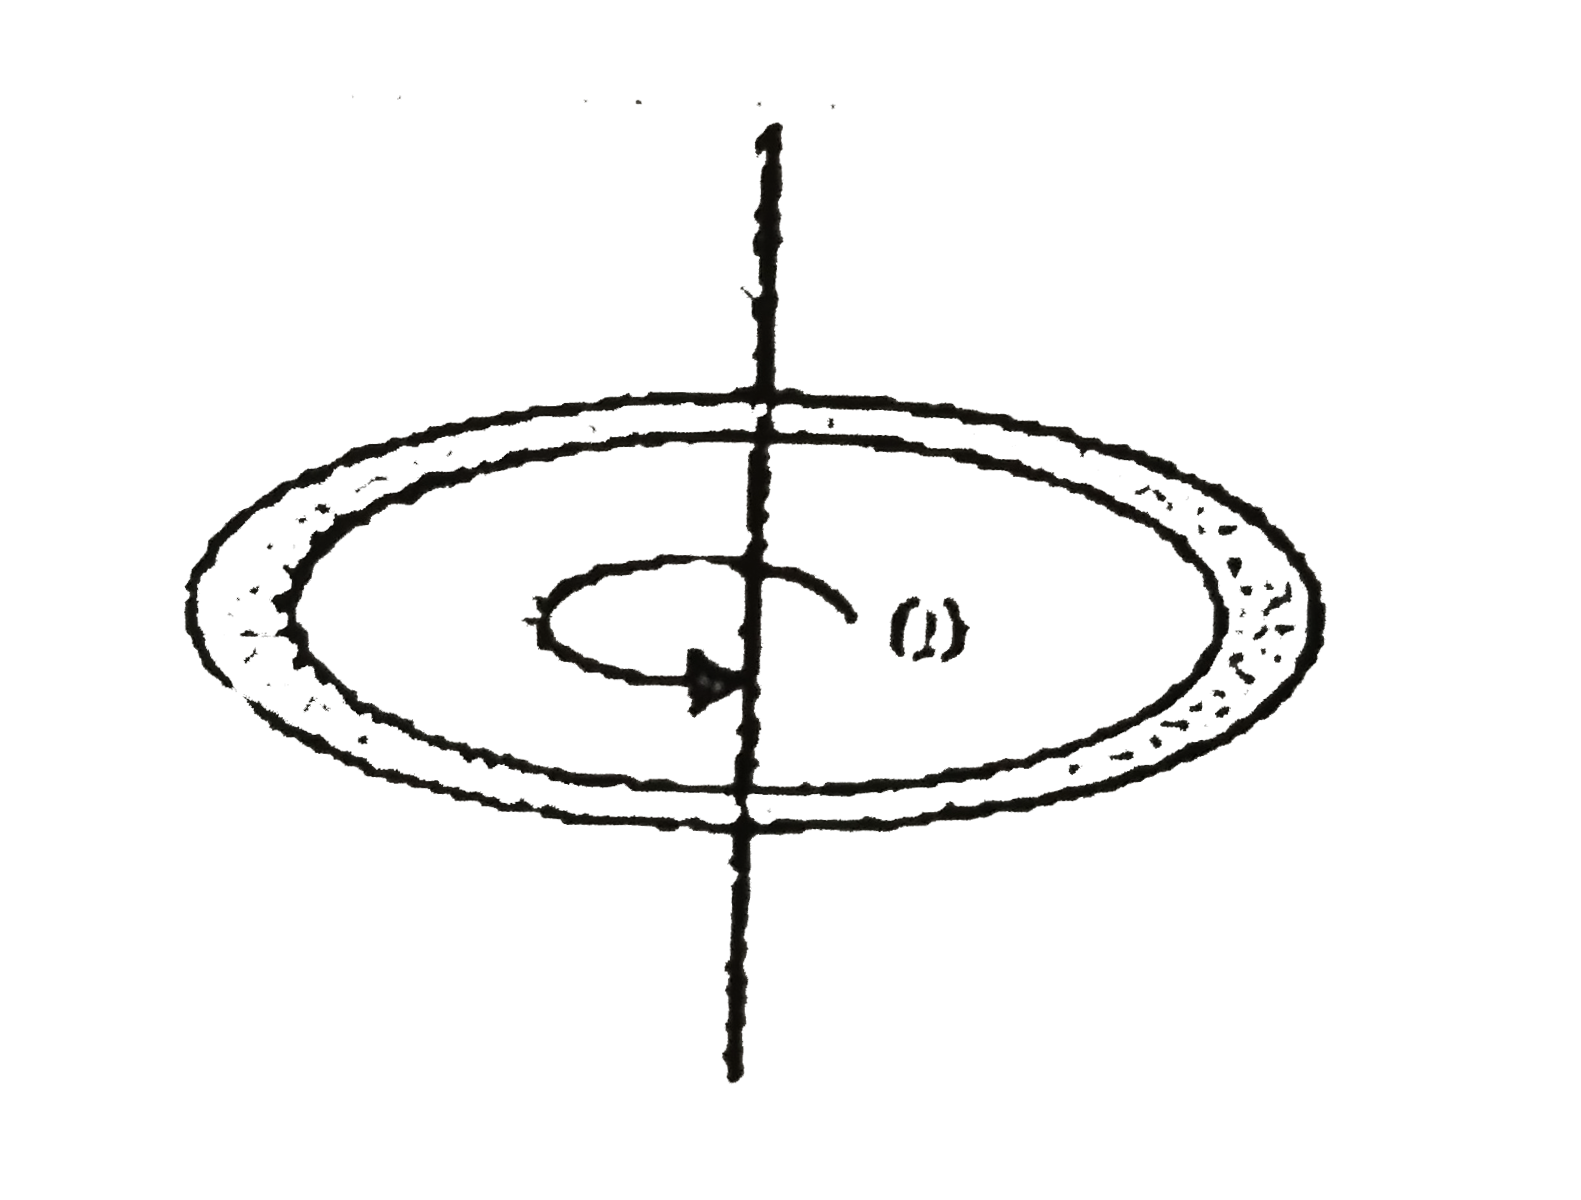
A thin circular ring of mass per unit length p and radius r is rotating at an angular speed ω as shown in figure. The tension in the ring is
 Apω2r2/2Bpω2r2Cpω2r2/3DNone
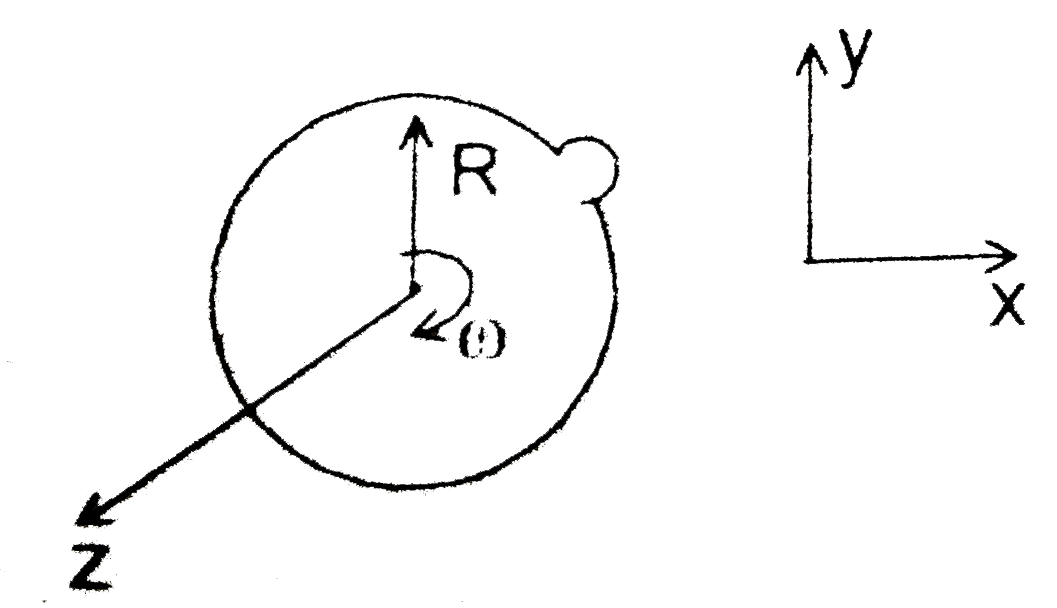
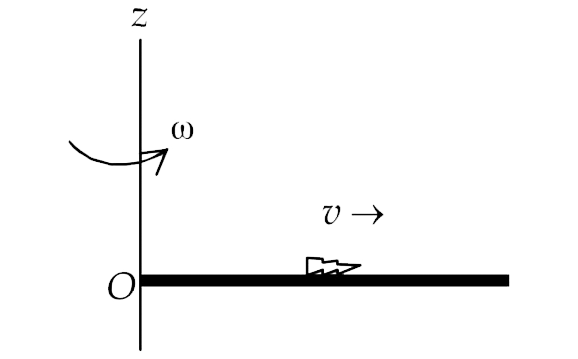
A small pulse is generated on a ring rotating with constant angular velocity ω as shown in the figure. Then the speed of pulse with respect to ground.AωRBωR/2C2ωRDzeroA thin uniform rod, pivoted at O, is rotating in the horizontal plane with constatn angular speed ω, as shown in the figure. At time t = 0, a small insect starts from O and moves with constant sped v, with respect to the rod towards the other end. It reaches the end of the rod at t =T and stops. The angular speed of the system remains ω throughout. The magnitude of the torque (|→π|) about O, as a function of time is best represented by which plot?
 A
A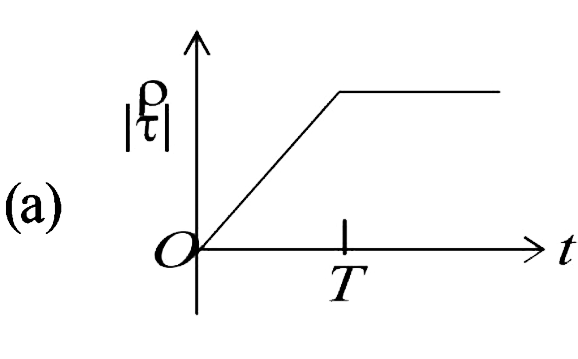 B
B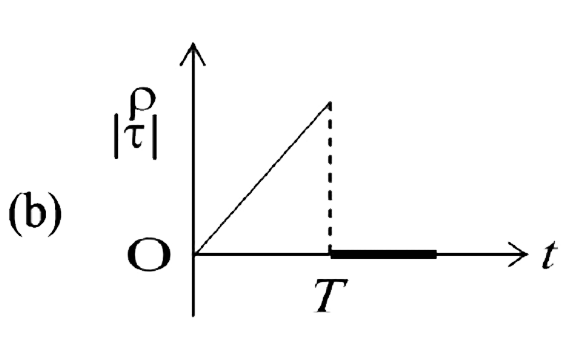 C
C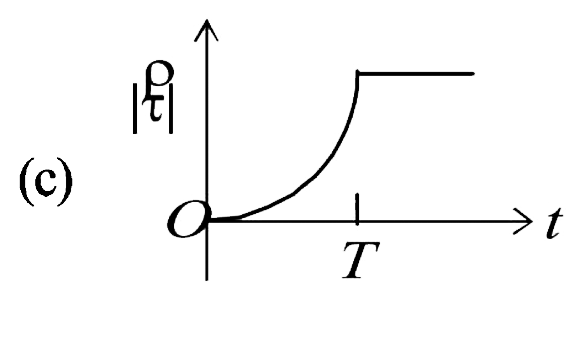 D
D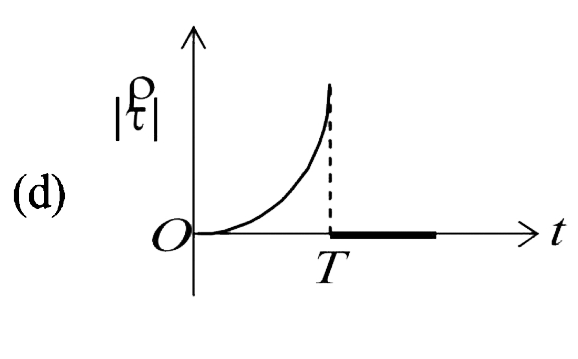
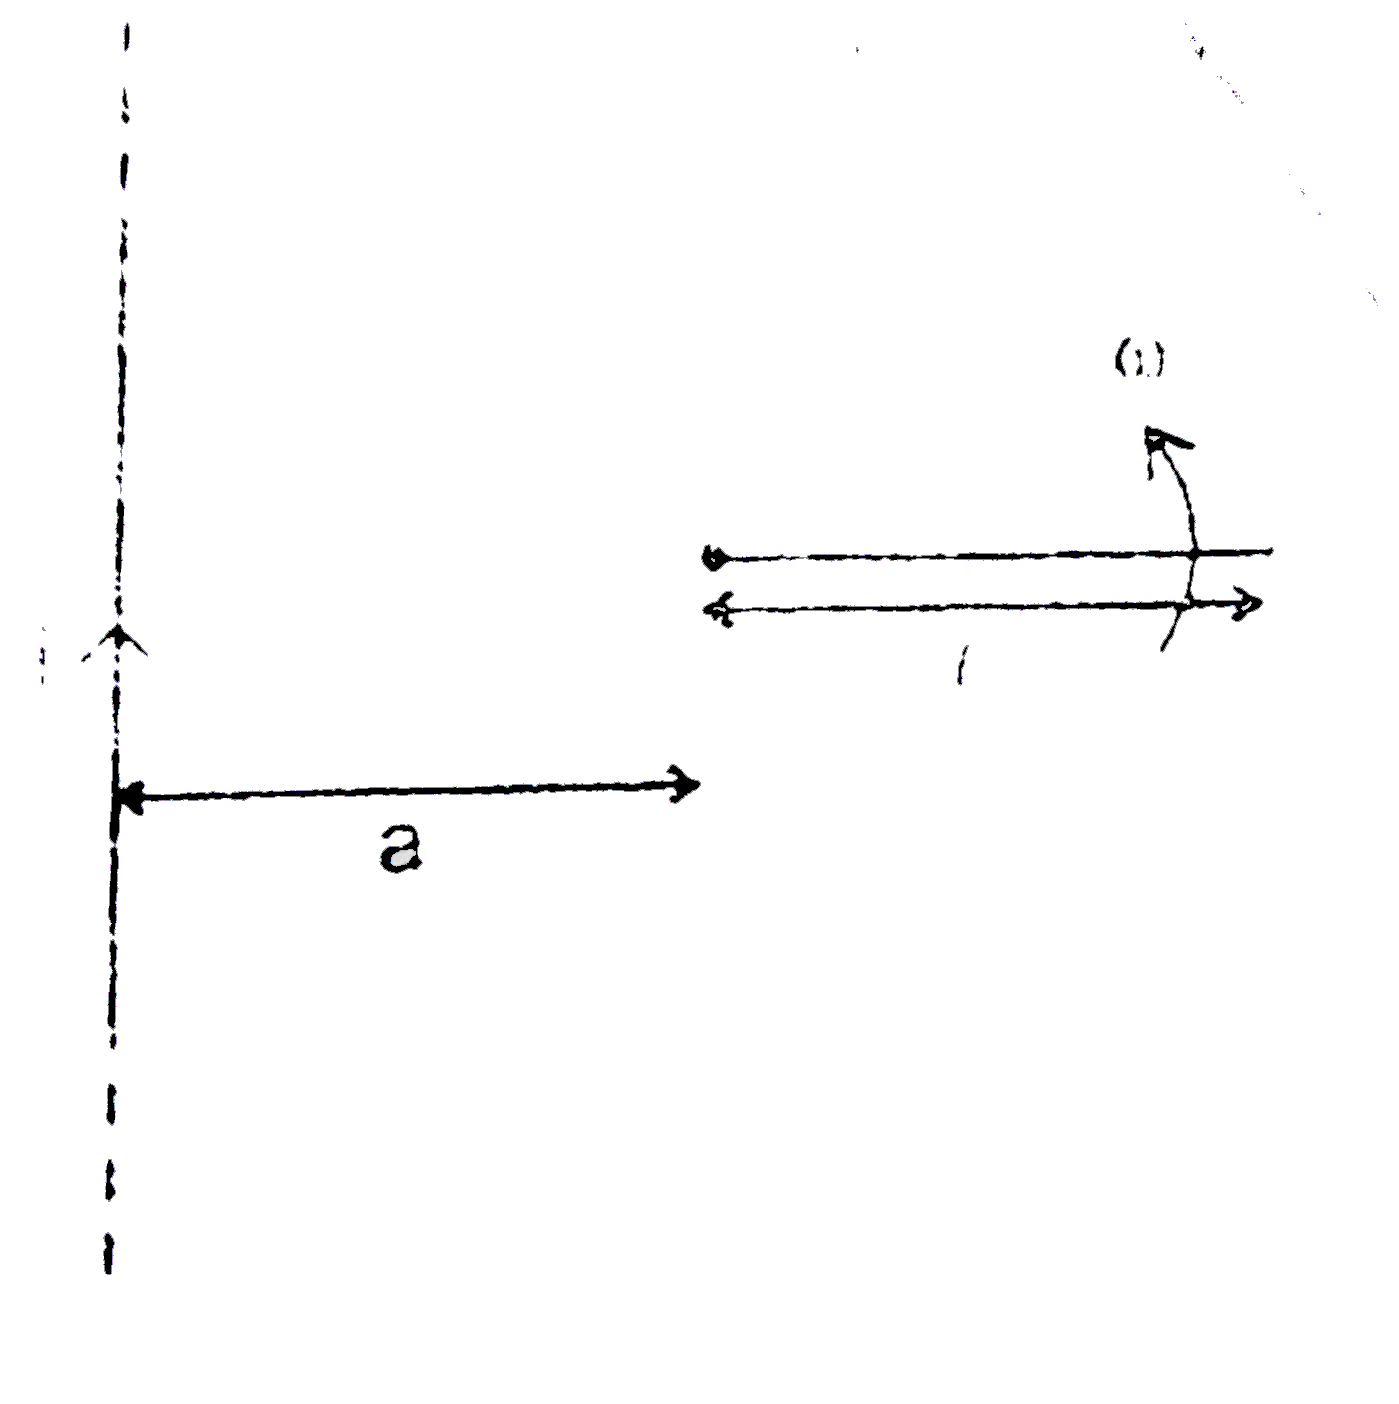
A rod of length l is rotating with an angular speed ω about its one end which is at a distance a from an infinitely long wire carrying current i.Find the emf induced in the rod at the instant shown in the figure.
View SolutionA uniform rod of mass m and length l is rotating with constant angular velocity ω about an axis which passes thorugh its one end and perpendicular to the length of rod. The area of cross section of the rod is A and its Young's modulus is y. Neglect gravity. The strain at the mid point of the rod is:
View SolutionConsider the situation shown in the figure of the previous problem. Suppose the wire connecting O and C has zero resistance but the circular loop has a resistance R uniformly distributed along its length. The rod OA is made to rotate with a uniform angular speed (ω) as shown in the figure. Find the current in the rod when −AOC=90∘
View SolutionA conducting rod of length 2l is rotating with constant angular speed ω about is perpendicular bisector. A uniform magnetic field →B exists parallel to the axis of rotation. The e.m.f. induced between two ends of the rod is
View SolutionThe graph between L and T is correctly shown by
View Solution