The velocity - time graph for linear motion of an object is as shown. Find
(a) The distance travelled and
(b) Displacement for the interval between 5 s and 40 s.
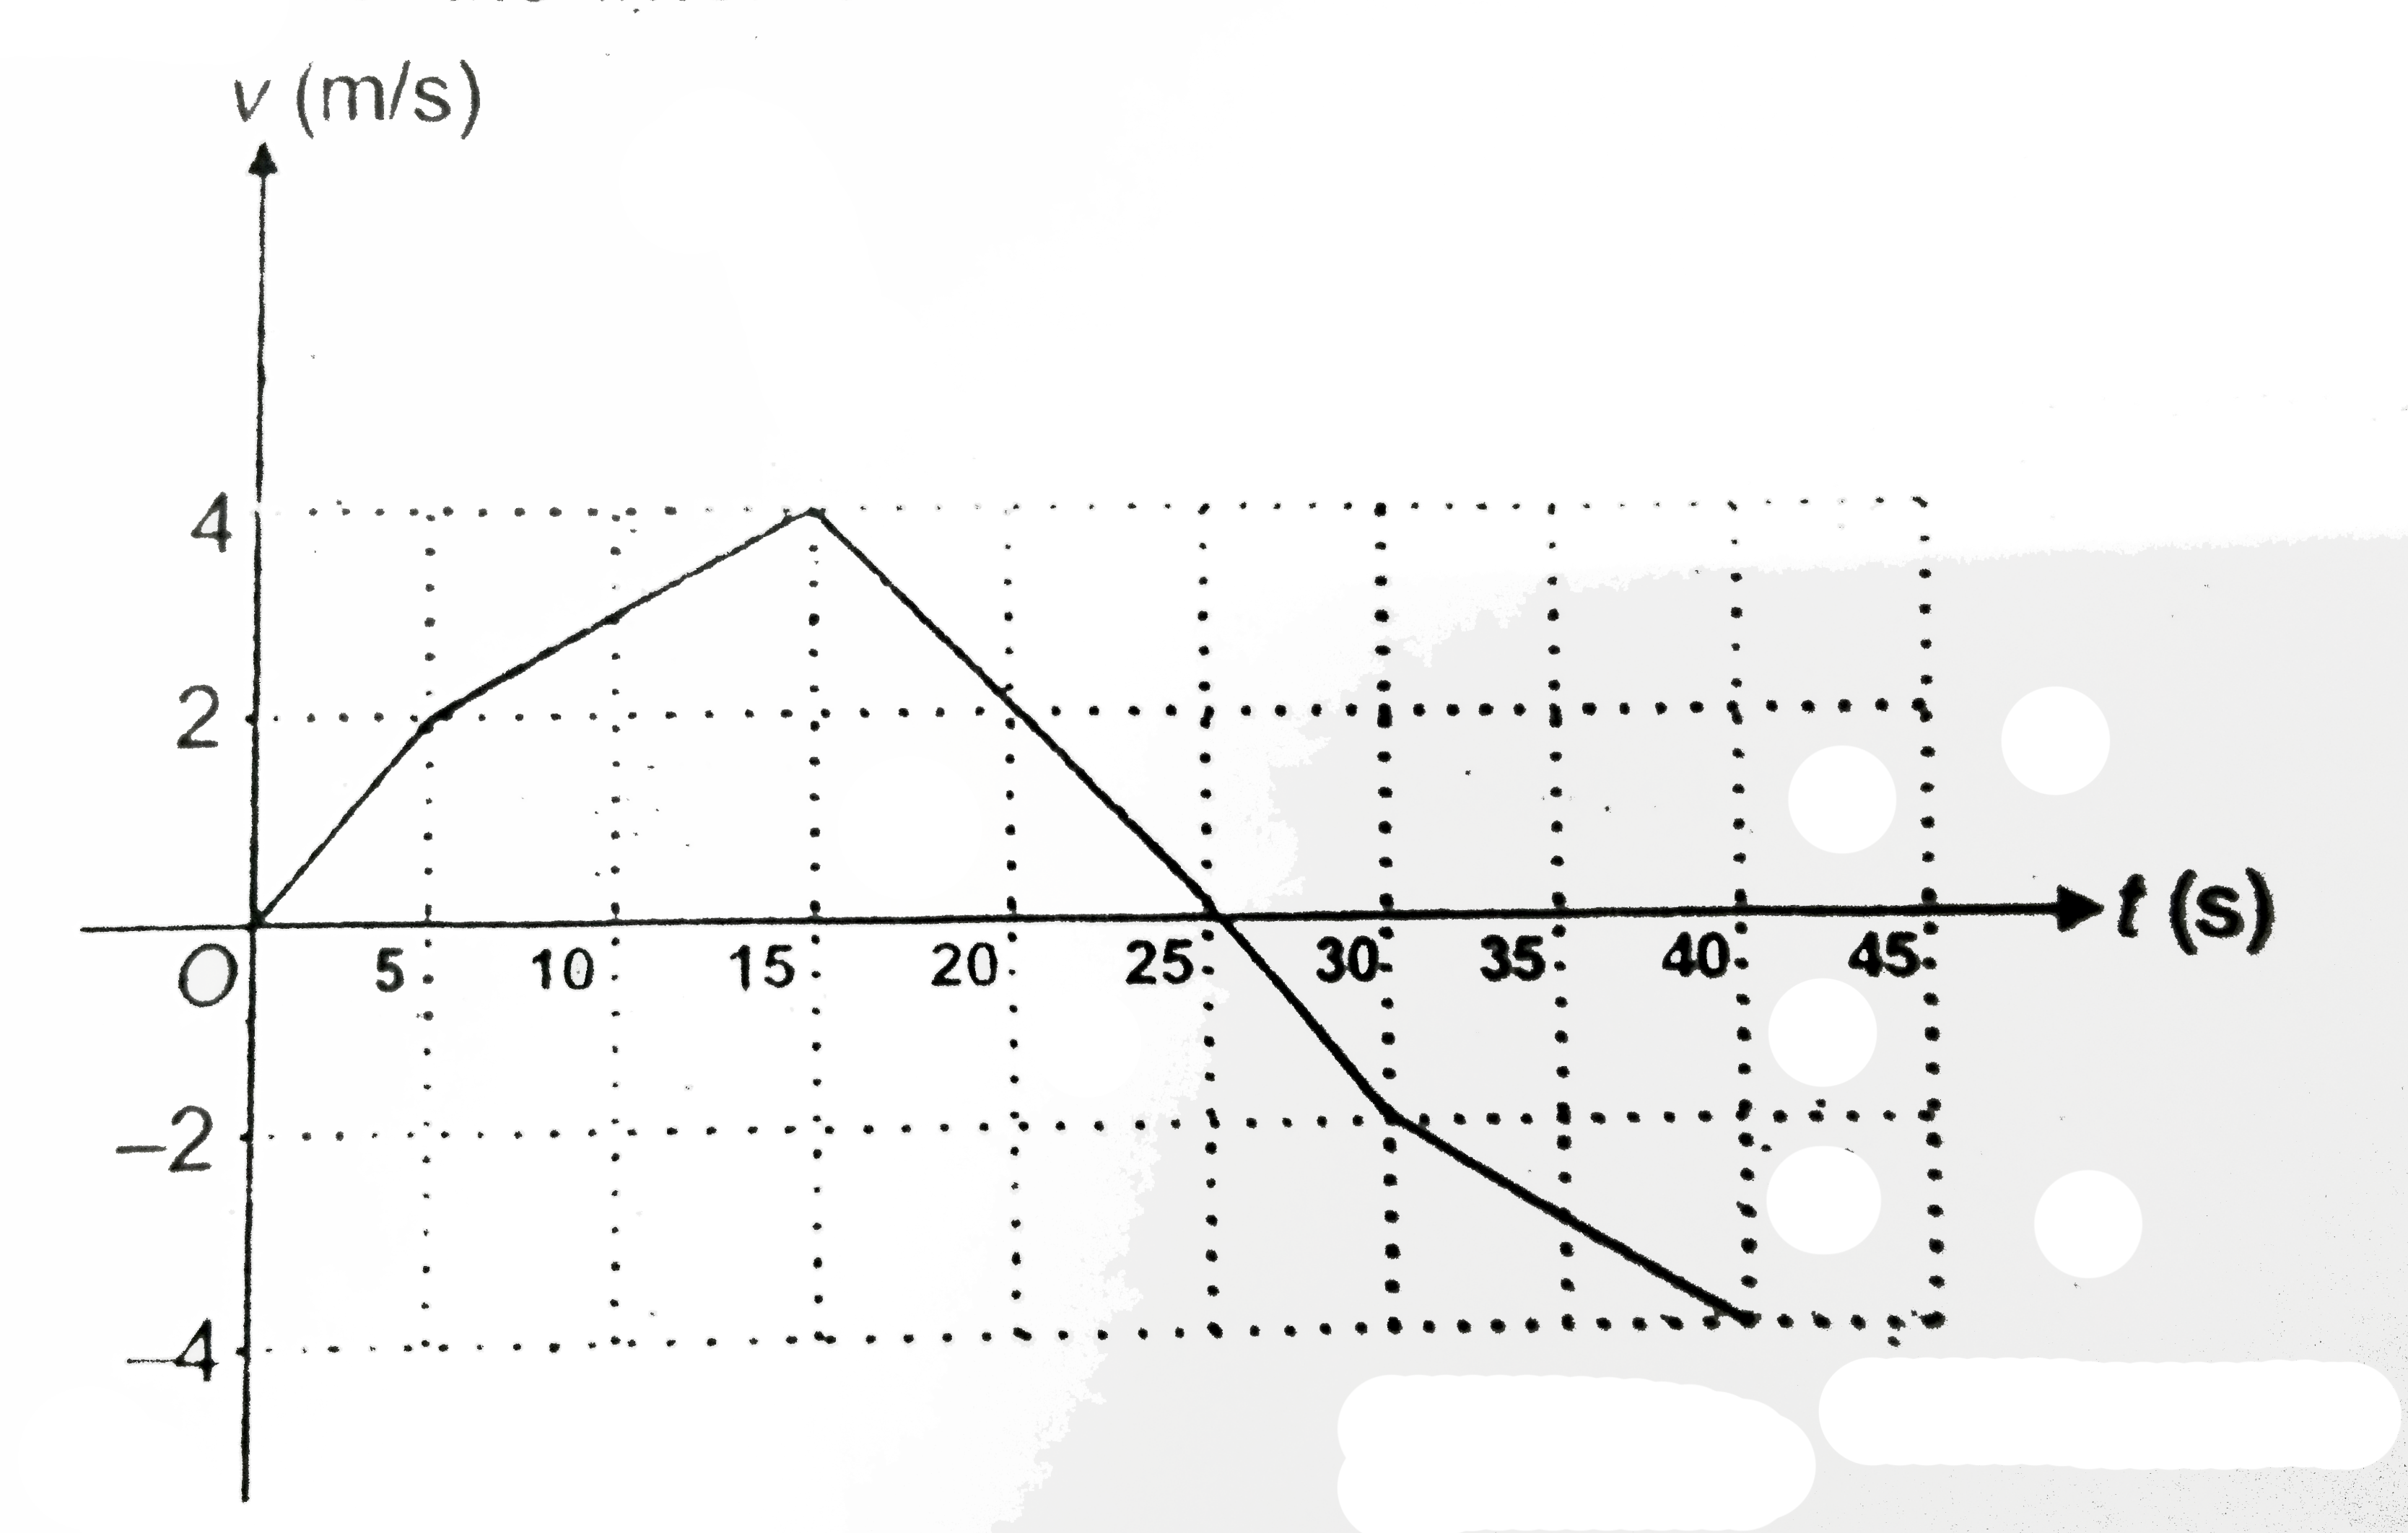
From velocity - time graph
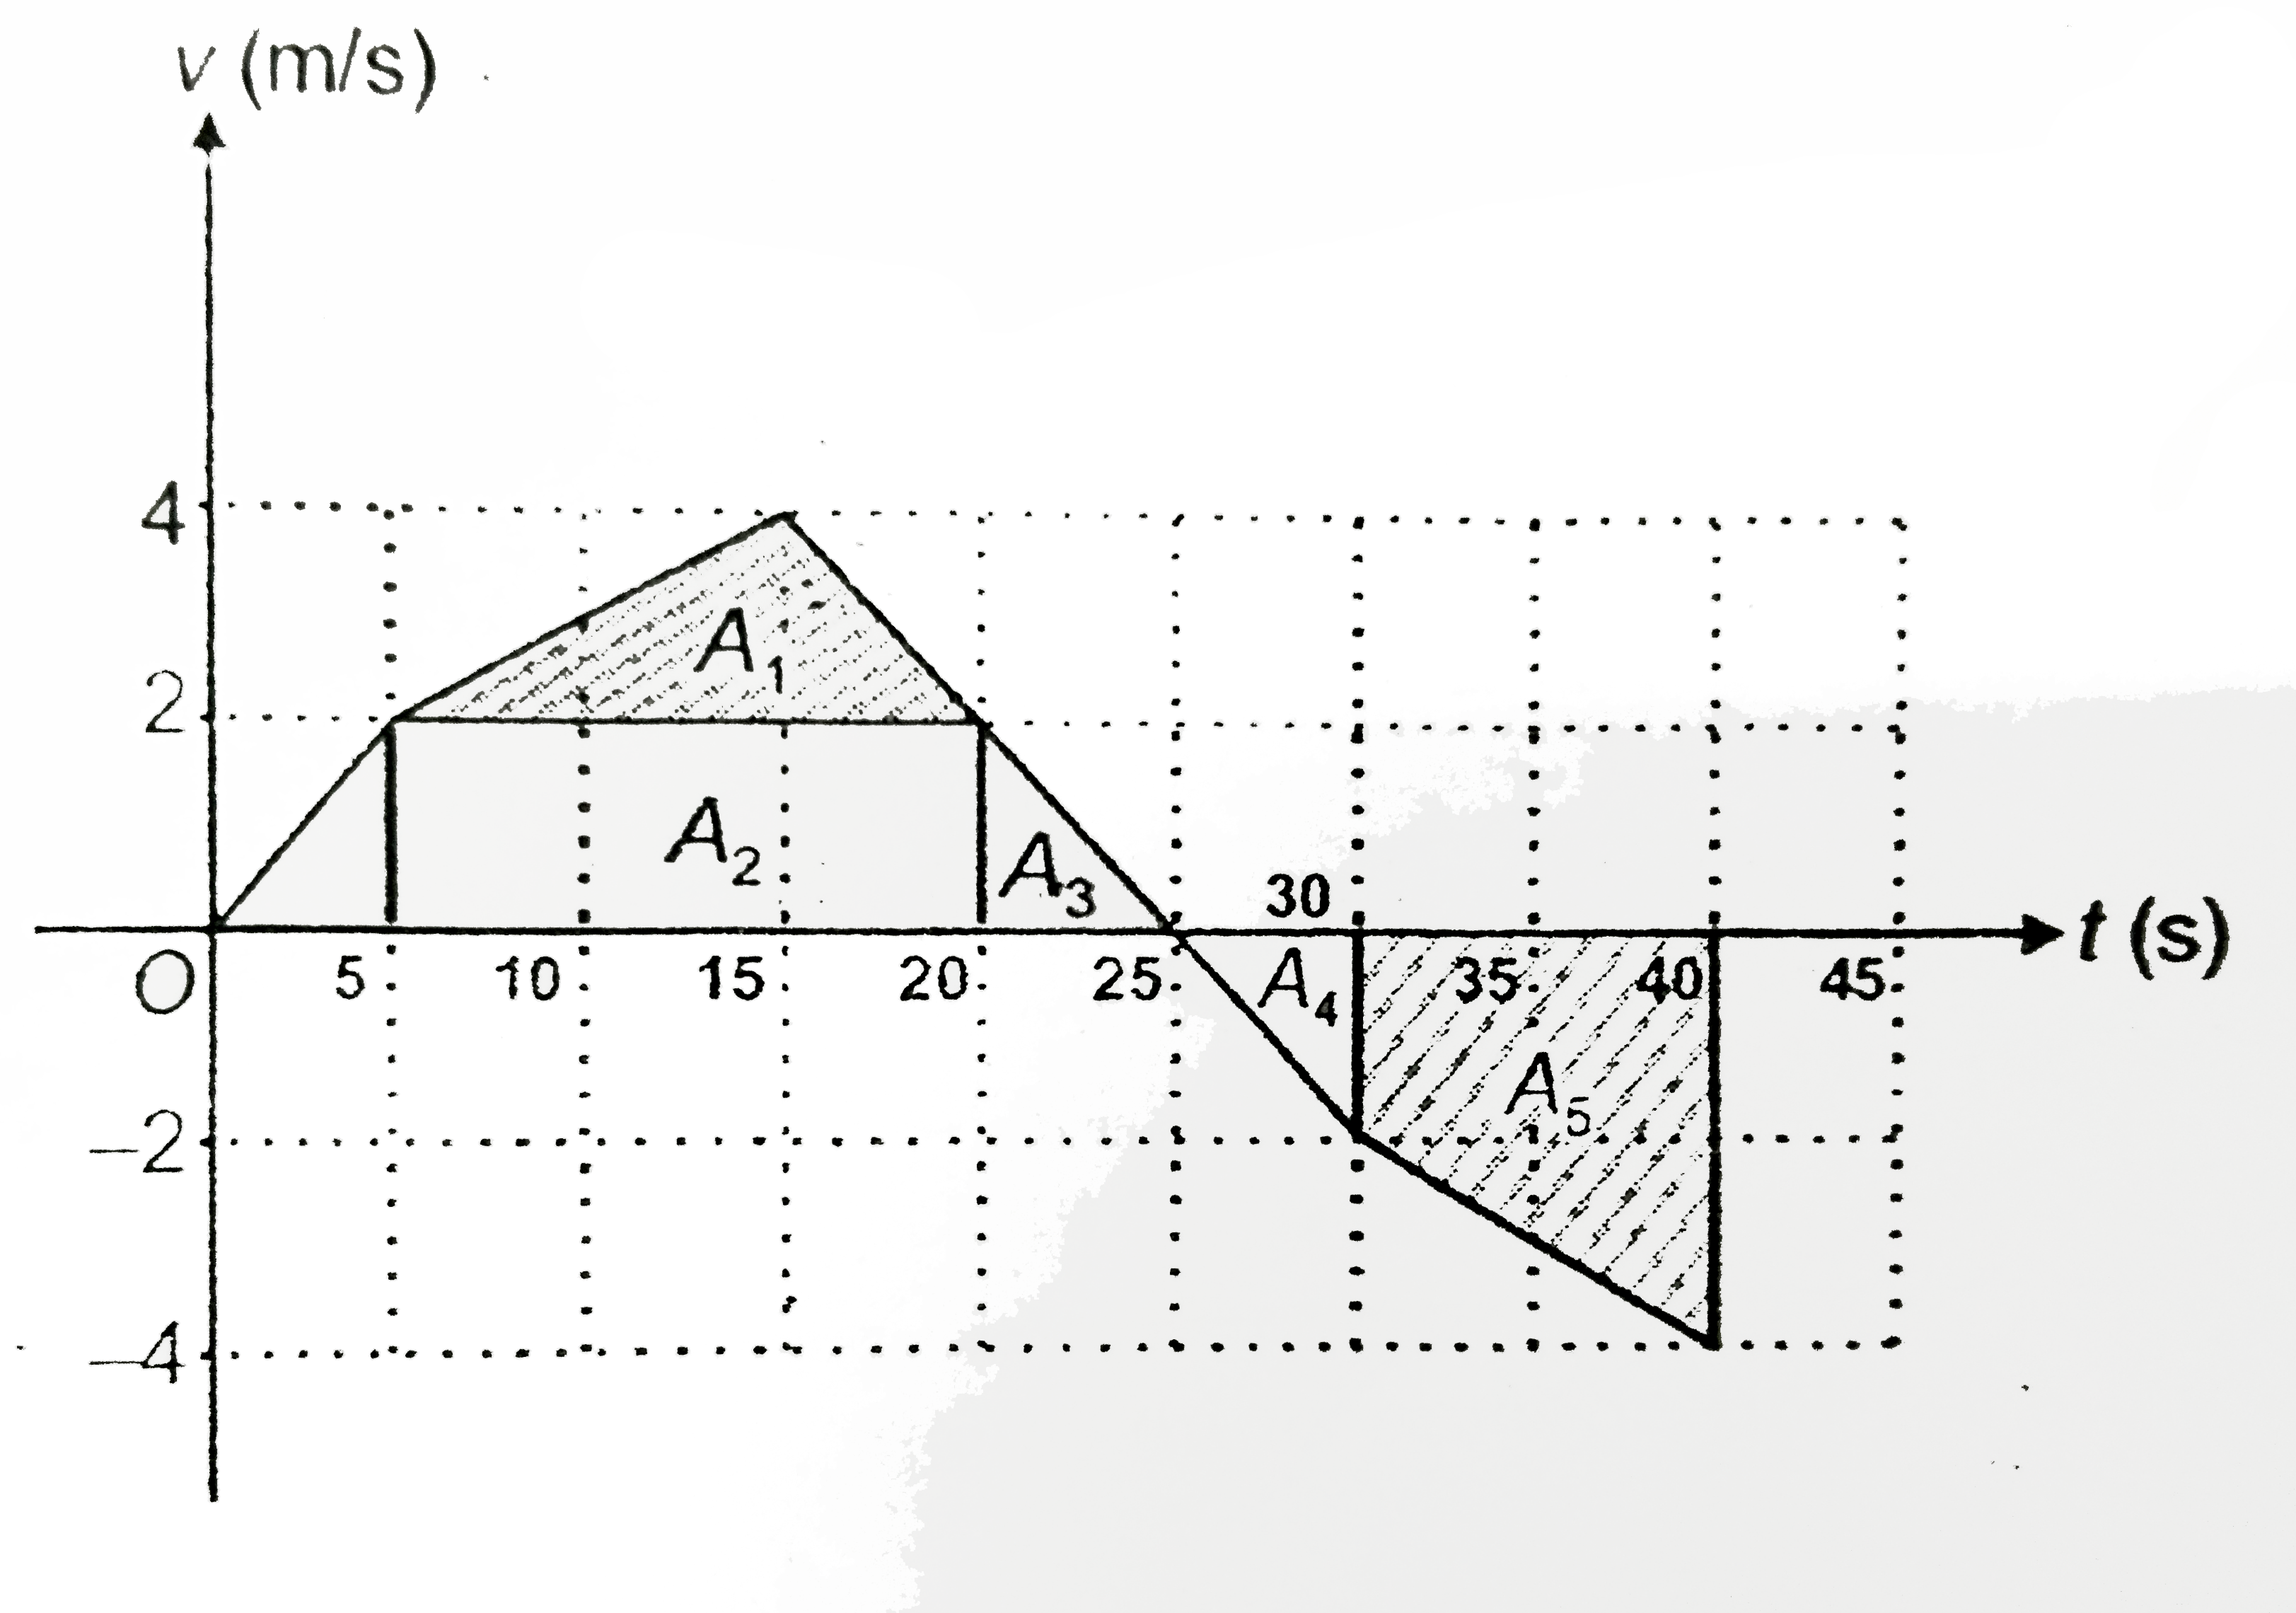
A1=12{20−5}×(4−2)=12×15×2=15m
A2=(20−5)×2=15×2=30m
A3=12×(25−20)×2=12×5×2=5m
A4=12×(30−25)×2=12×5×2=5m
A5=12{2+4}×{40−30}=12×6×10=30m
Total distance=(A1+A2+A3+A4+A5
=15m+30m+5m+5m+30m=85m
Total displacement=A1+A2+A3+(−A4)+(−A5)
=15m+30m+5m+(−5m)+(−30m)
=15m
Topper's Solved these Questions
- MOTION IN STRAIGHT LINEBook:AAKASH INSTITUTEChapter:MOTION IN STRAIGHT LINEExercise:Try Yourself
Explore 40 Videos
- MOTION IN STRAIGHT LINEBook:AAKASH INSTITUTEChapter:MOTION IN STRAIGHT LINEExercise:Assignment (SECTION - A)
Explore 50 Videos
- MOTION IN A STRAIGHT LINEBook:AAKASH INSTITUTEChapter:MOTION IN A STRAIGHT LINEExercise:ASSIGNMENT (SECTION - D)
Explore 15 Videos
- MOVING CHARGE AND MAGNESIUMBook:AAKASH INSTITUTEChapter:MOVING CHARGE AND MAGNESIUMExercise:SECTION D
Explore 16 Videos
Similar Questions
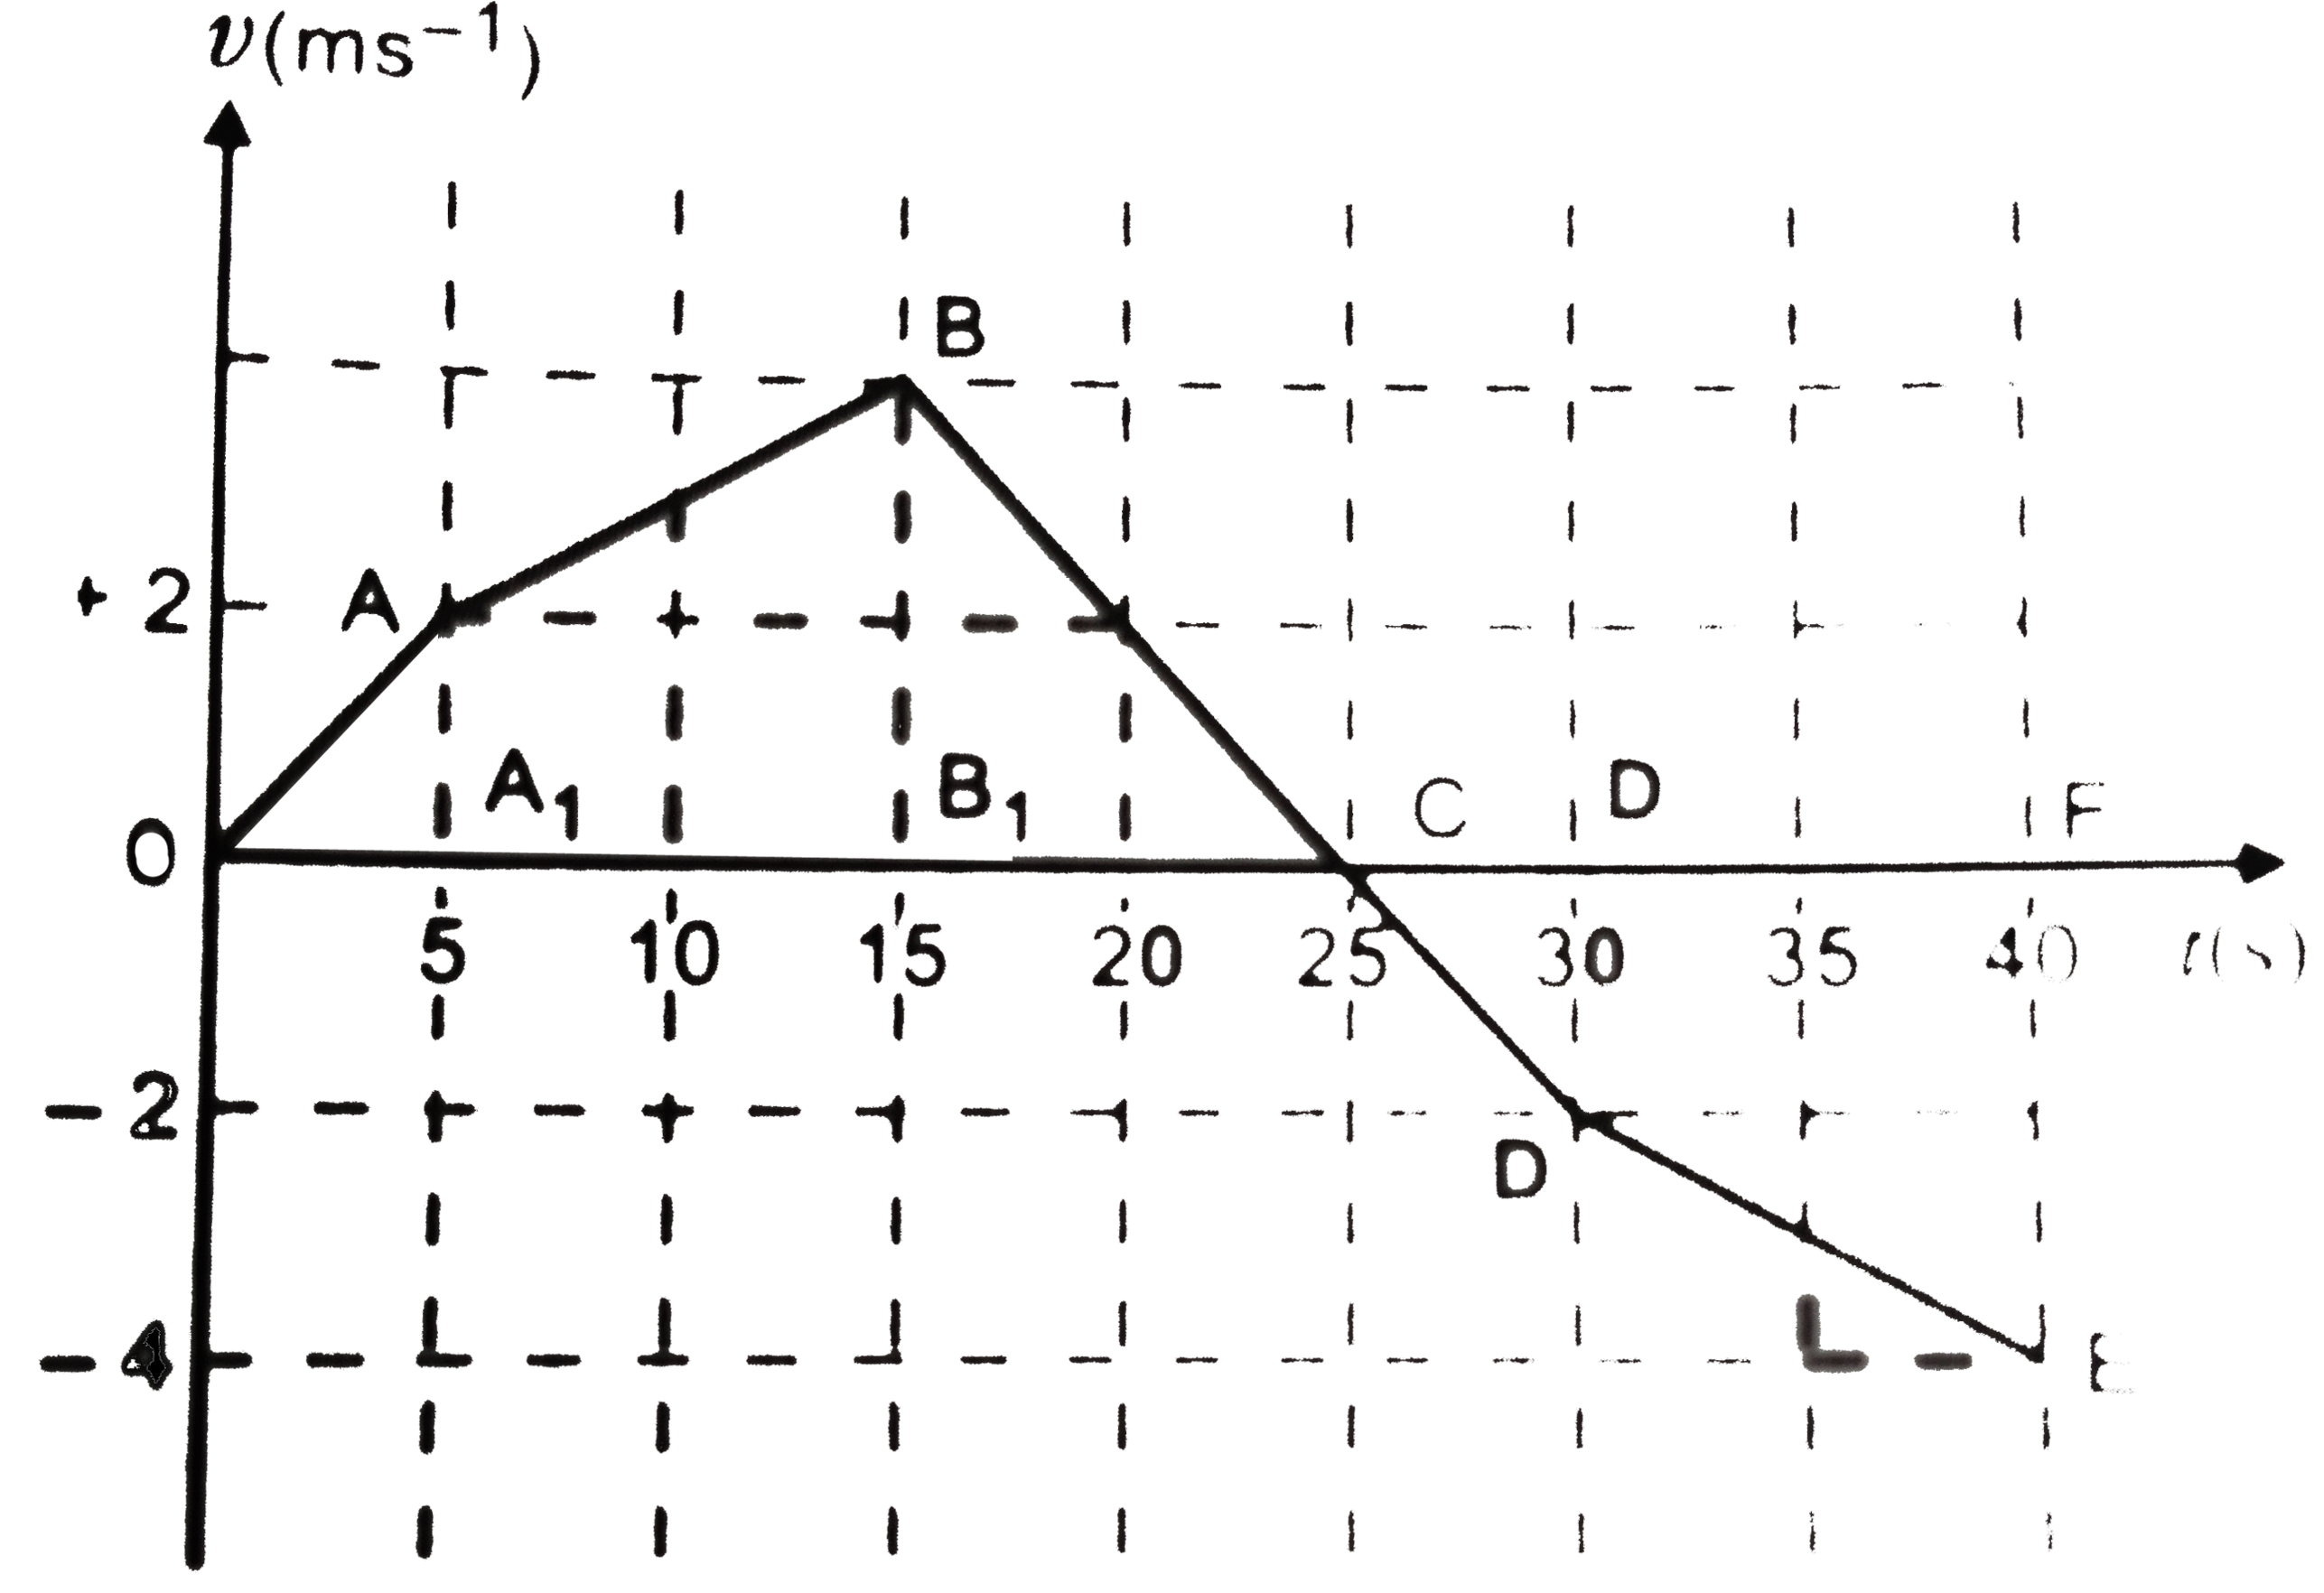
The velocity-time graph line motion is shown in Fing. 2 (b).7. Find (a) the distance travelled and (b) displacement, between 5and40s. (c ) Acceleration betwwn 15 to 25 seconds.
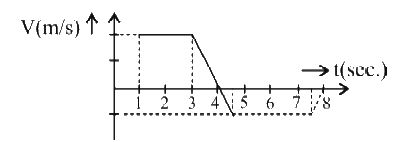
View SolutionThe velocity-time graph of a linear motion is shown in figure. The displacement from the origin after 8 sec is :
View Solution
Knowledge Check
The graph of distance -time graph for uniform motion for an object is
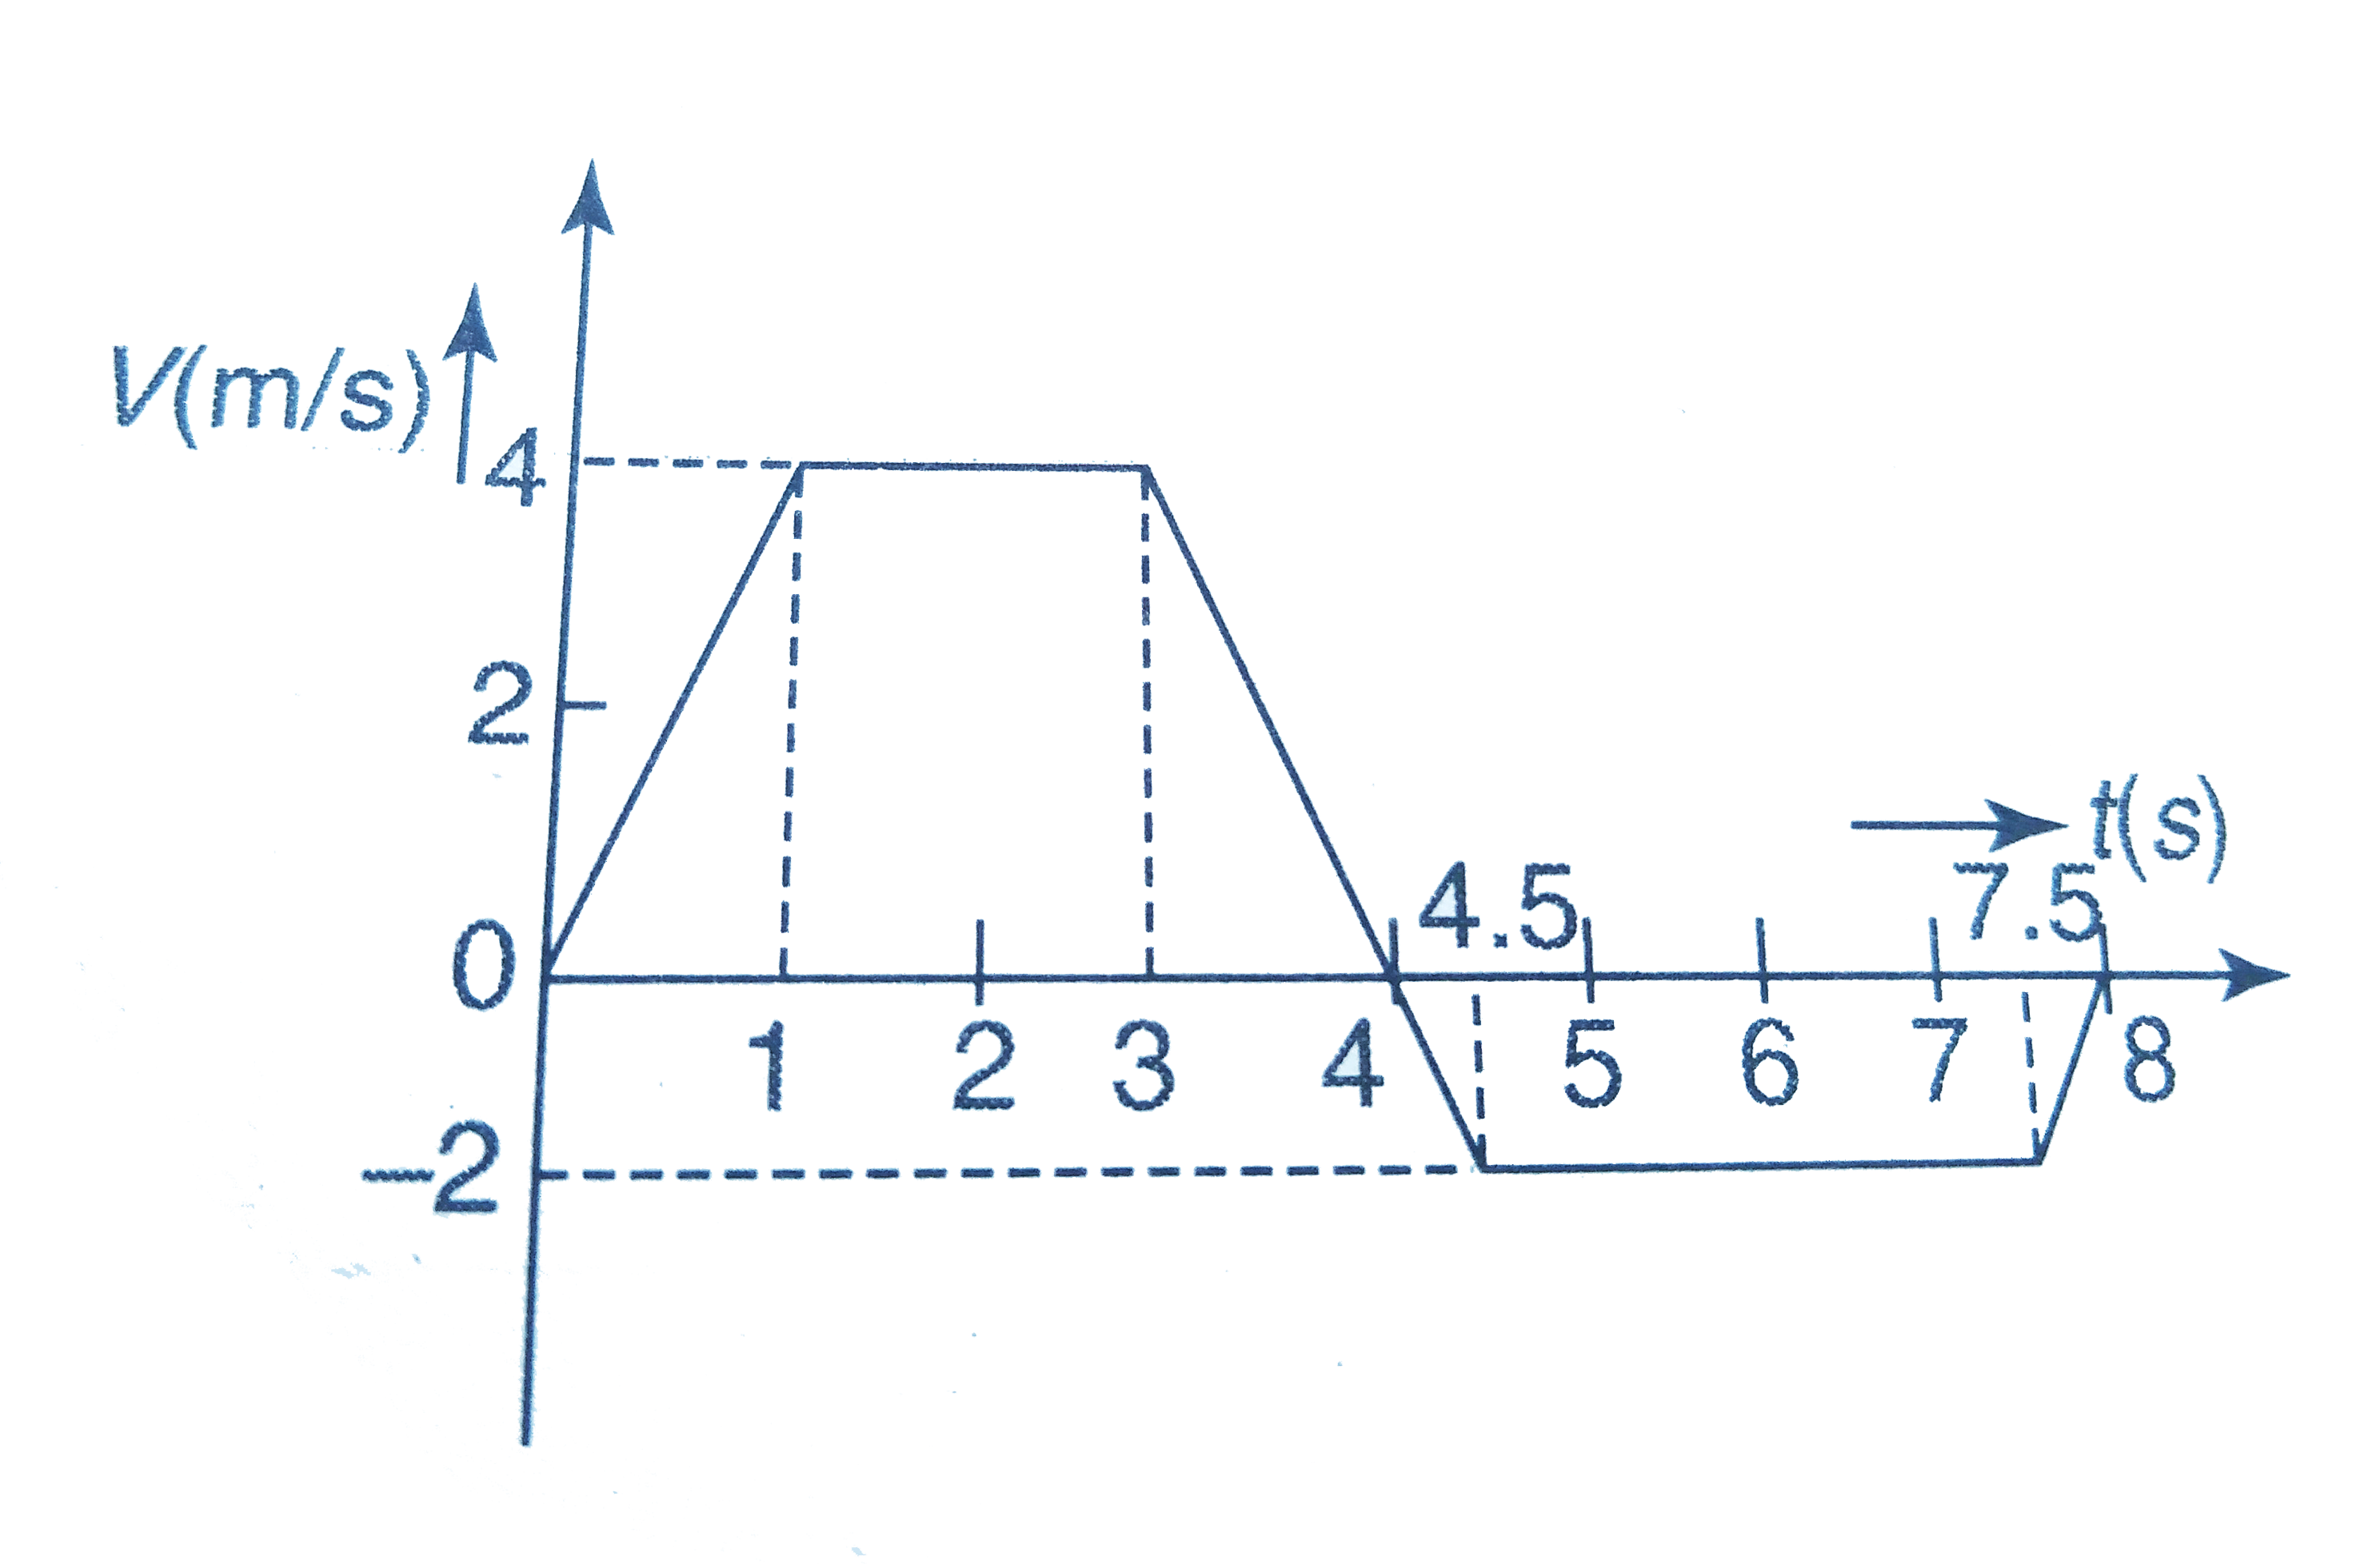
Astraight lineBcurved lineCfirst straight line then curved lineDNone of theseThe velocity-time graph of a linear motion is shown below. The distance from the origin after 8 seconds is :
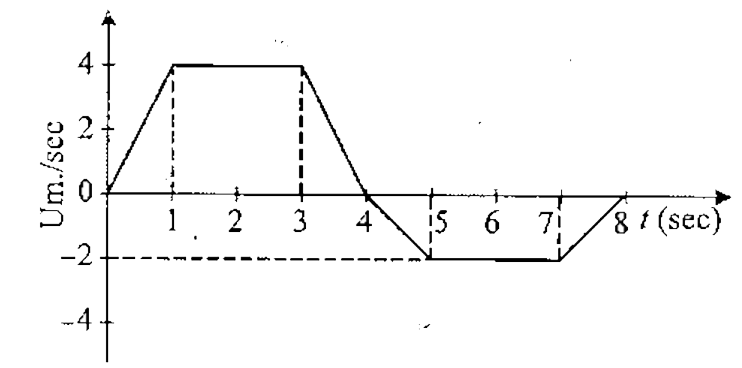 A18 mB16 mC8 mD6 m
The velocity-time graph of an objects is as shown. The displacement during the interval 0 to t4 is
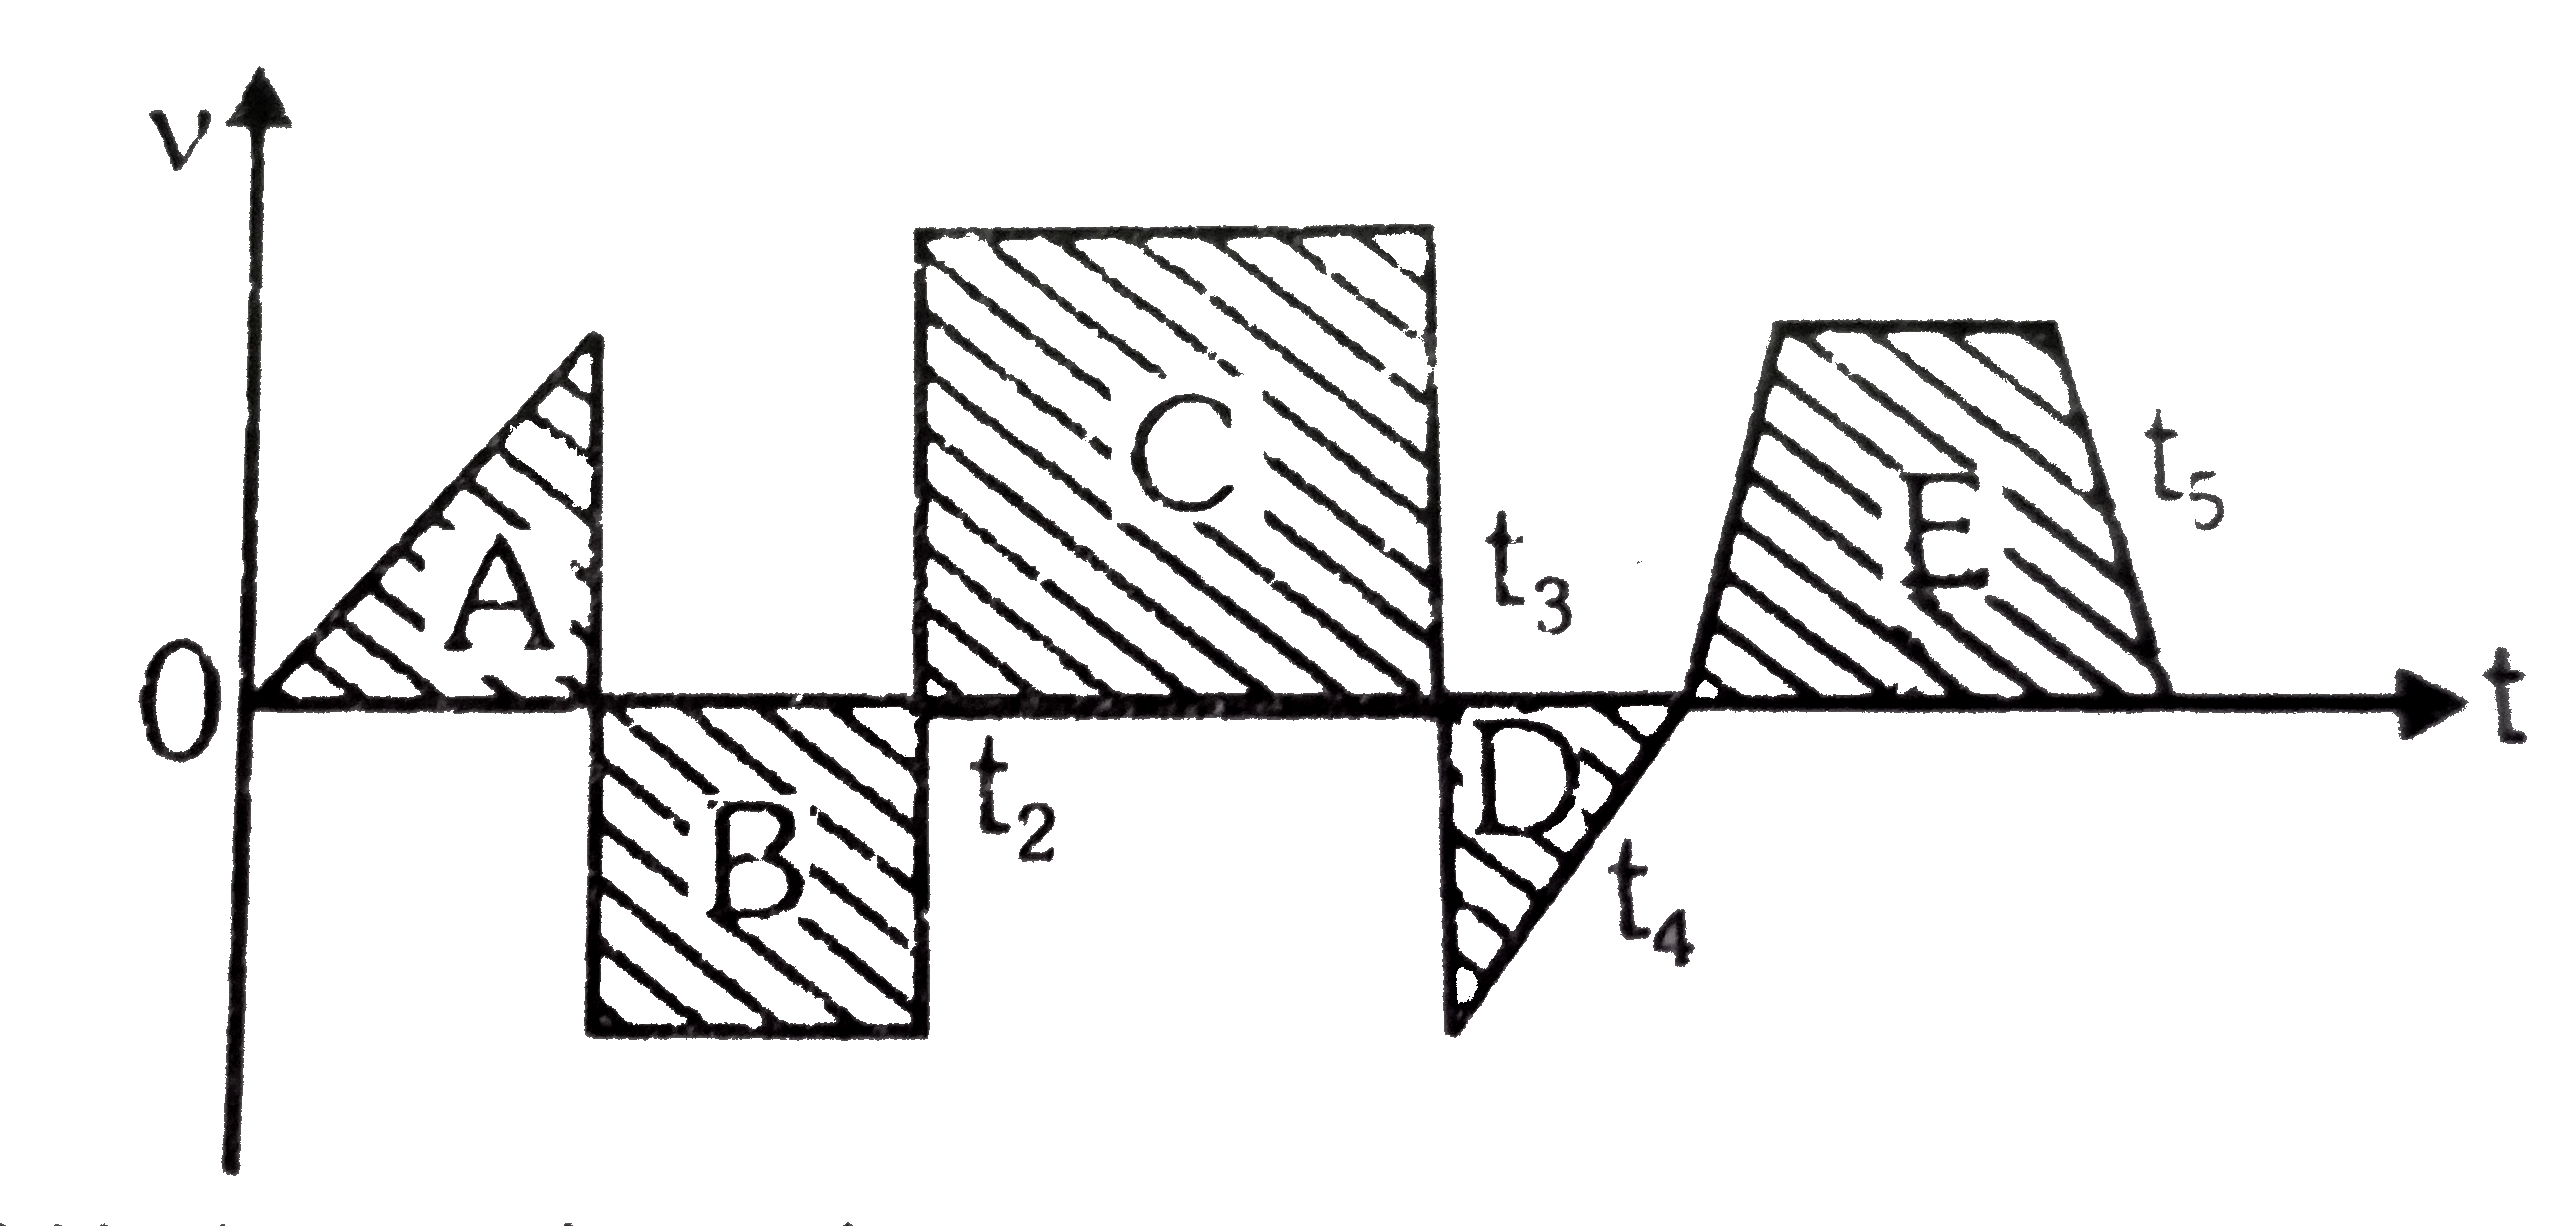 AArea A+AreaB+AreaC+AreaD+AreaEBAreaA+AreaC-AreaB-AreaDCArea+AreaB+AreaC+AreaDDAreaA+AreaC+AreaE-AreaB+AreaD
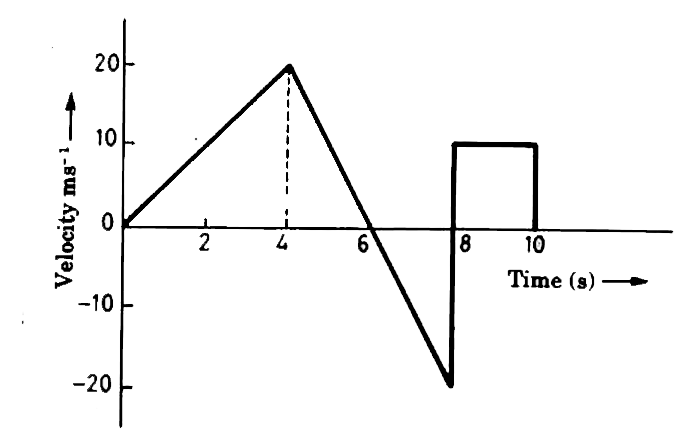
The velocity-time graph of an object moving along a straight line is as shown in Fig. 3.37. Find the net distance covered by the object in time interval between t=0 to t=10s. Also find the displacement in time 0 to 10 s.
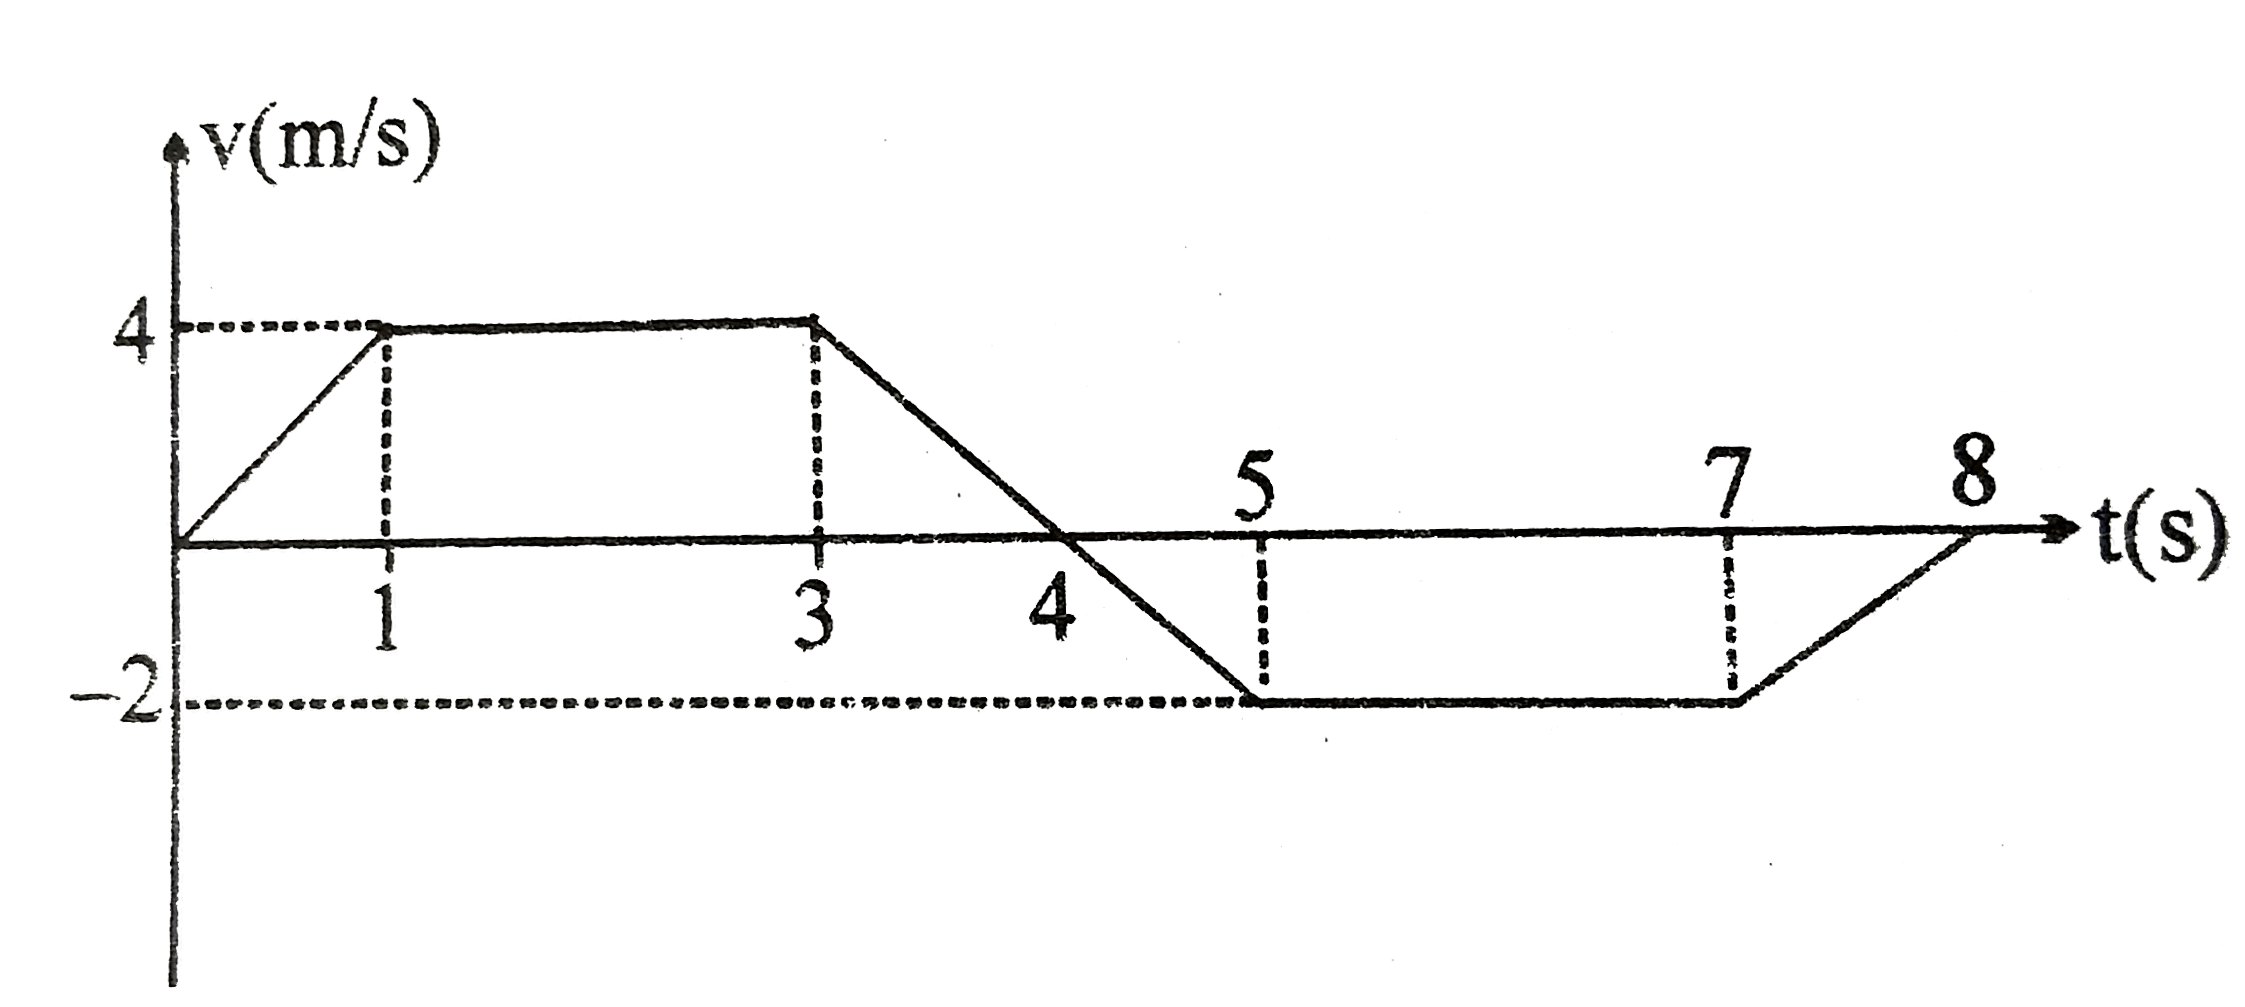
View SolutionThe velocity-time graph of a linear motion is shown below. Find the (a) displacement and distance from the origin after 8s. (b) acceleration in the first second. (c) deceleration during the 5th second. (d) maximum speed during the motion.
View SolutionThe velocity-time graph of a linear motion os shown figure. The distance from the starting point after 8sec is.
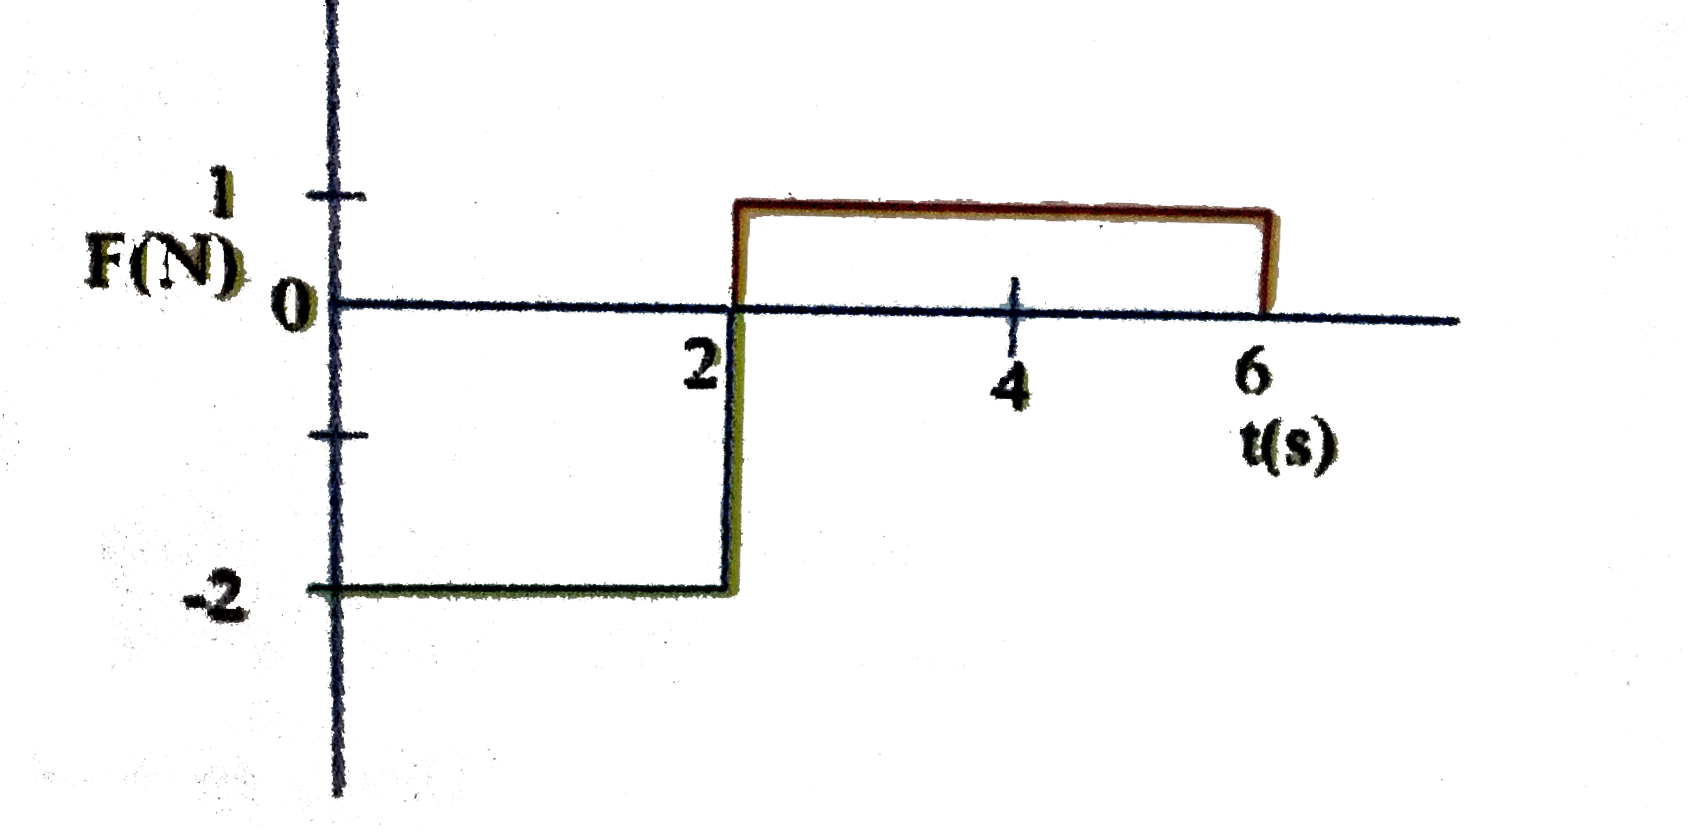
View SolutionA force time graph for the motion of a body is as shown in Change in linear momentum between 0 and 6s is
 .
.
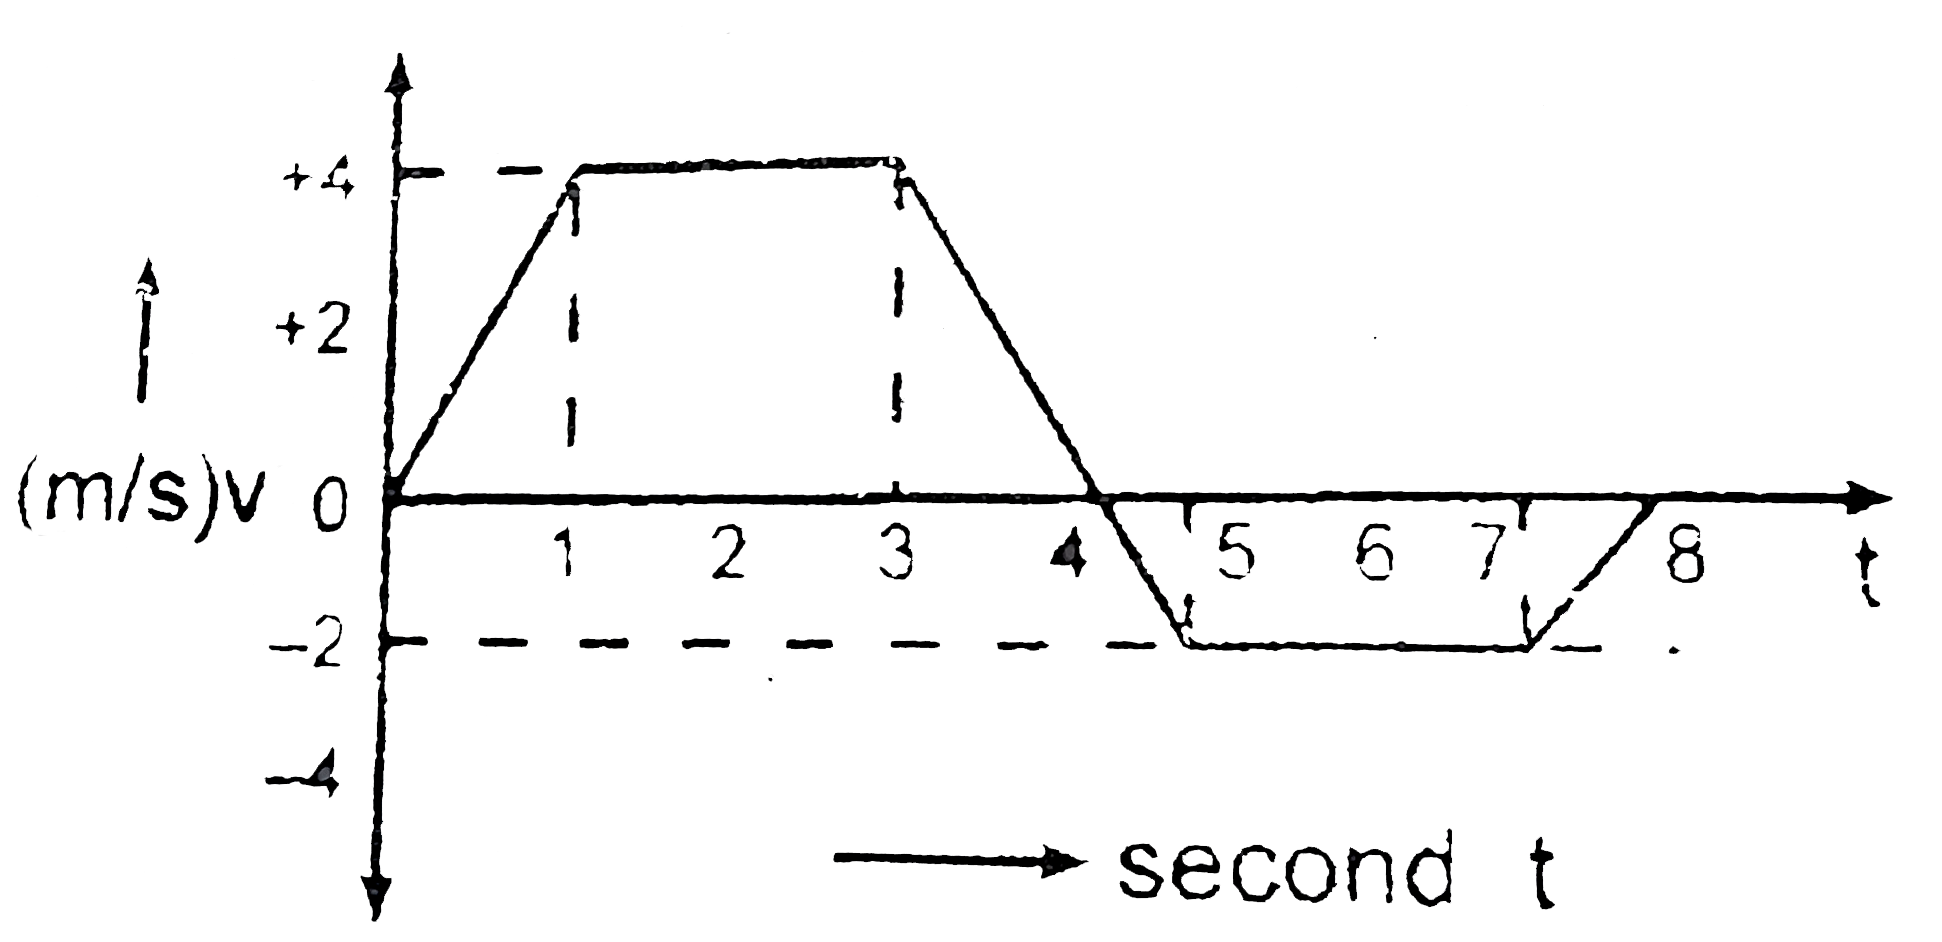
View SolutionThe velocity time graph of a linear motion is shown in the figure. The distance from the starting point after 8 seconds will be
 .
.
View Solution

