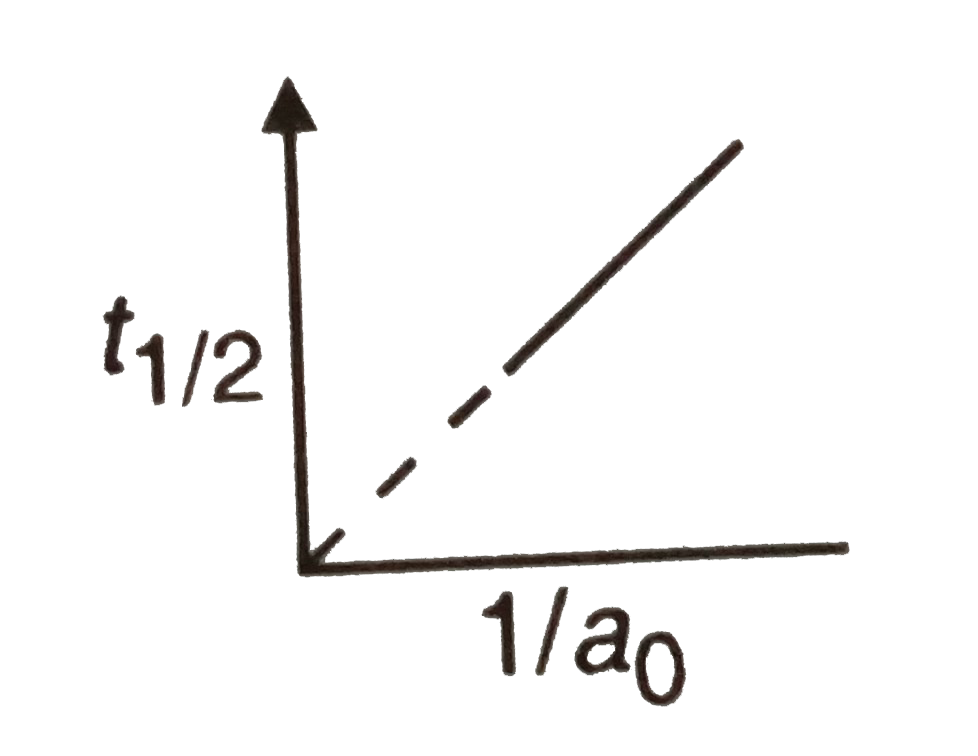
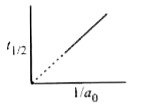
The following graph shows how t1/2 (half-life) of a reactant R changes with the initial reactant concentration a0.
The order of reaction will be

A
0
B
1
C
2
D
3
Video Solution
Text Solution
The correct Answer is:C
Properties of ionic solid
|
Similar Questions
Knowledge Check
The following graph shows how t1/2 (half-life) of a reactant R changes with the initial reactant concentration a0. The order of the reaction will be
 A0B1C2D3
The half-life of a reaction is halved as the initial concentration of the reaction is doubled. The order of the reaction is
A0.5B1C2D0Half life of a reaction becomes half when intial concentrations of reactants are made double. The order of the reaction will be:
A1B2C0D3
Draw a schematic graph showing how the rate of first order reaction changes with change in concentration of reactants.
View SolutionIf half-life period of a reaction is inversely proportional to initial concentration of the reactant, what is the order of reaction ?
View SolutionThe t1/2 of a reaction is halved as the initial concentration of the reactant is doubled then order of reaction :-
View SolutionThe half life period of a reaction is halved as the initial concentration of the reactants is doubled. The order of reaction is:
View SolutionIf half-life period of a reaction is inversely proportional to initial concentration of the reactant, what is the order of reaction ?
View Solution
