Draw a schematic graph showing how the rate of first order reaction changes with change in concentration of reactants.
As for a first order reaction, rate ∝ molar concentration, graph between Rate vs Molar. Conc. Will be a straight line passing through the origin. (Similar to Fig. 4.13a, page 4/31).
Topper's Solved these Questions
- BOOK - PRADEEPCHAPTER - CHEMICAL KINETICSEXERCISE - ADDITIONAL QUESTIONS (VERY SHORT ANSWER QUESTIONS) V. First order reactions, pseudo first order reactions and radioactive disintegration2videos
CHEMICAL KINETICS
- BOOK - PRADEEPCHAPTER - CHEMICAL KINETICSEXERCISE - ADDITIONAL QUESTIONS (VERY SHORT ANSWER QUESTIONS) VI. Activation energy, effect of temp. on rate (Arrhenius eqn.) and effect of catalyst on rate4videos
CHEMICAL KINETICS
- BOOK - PRADEEPCHAPTER - CHEMICAL KINETICSEXERCISE - ADDITIONAL QUESTIONS (VERY SHORT ANSWER QUESTIONS) III. Molecularity, mechanism and difference between order and molecularity8videos
CHEMICAL KINETICS
- BOOK - PRADEEPCHAPTER - BIOMOLECULES EXERCISE - IMPORTANT QUESTIONS (FOR BOARD EXAMINATION)25videos
BIOMOLECULES
- BOOK - PRADEEPCHAPTER - CHEMISTRY IN EVERYDAY LIFE EXERCISE - IMPORTANT QUESTION FOR BOARD EXAMINATION30videos
CHEMISTRY IN EVERYDAY LIFE
Similar Questions
Knowledge Check
- Question 1 - Select One
In a first order reaction with time the concentration of the reactant decreases
AlinearlyBexponentiallyCno changeDNone of these - Question 2 - Select One
For a first order reaction, the concentration of reactant :
Ais independent of timeBvaries linearly with timeCvaries exponentially with timeDNone - Question 3 - Select One
The increase in concentration of the reactants lead changes in
AΔHBCollision frequencyCActivation energyDEquilibrium constant
For a first order reaction, the rate of the reaction doubled as the concentration of the reactant is doubled.
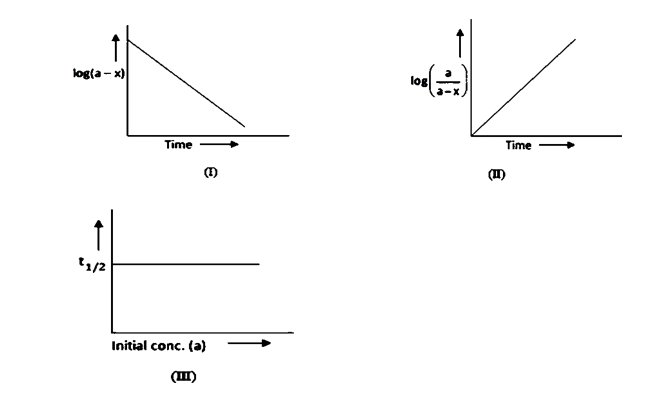
View SolutionWhich of the following is/are correct for the first order reaction ? (a is initial concentration of reactant, x is concentration of the reactant reacted and t is time)
 View Solution
The increase in concentration of the reactants lead changes in
View SolutionStatement-2: The reciprocal of time in which 66% of the reactant is conveted to product is equal to the rate constant of first order reaction.
Because
Stetment-2 : The rate constant for first order reaction depends on initial concentration of reactants.View SolutionIn a first order reaction , on plotting a graph between t1/2 and concentration of reactant
View Solution

