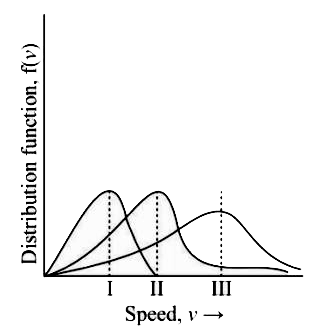
Points I, II and III in the following plot respectively correspond to (: most probable velocity)

The correct Answer is:D
For at 300 K ,
For at 400 K ,
.
Similar Questions
A gas consists of molecules of mass m and is at a temperature T. Making use of the Maxwell velocity distribution function, find the corresponding distribution of the molecules over the kinetic energies ε. Determine the most probable value of a gas the kinetic energy εp. Does εp correspond to the most probable velocity ?
View SolutionFind the de Broglie wavelength of hydrogen molecules, which corresponds to their most probable velocity at room temperature.
View Solution
Knowledge Check


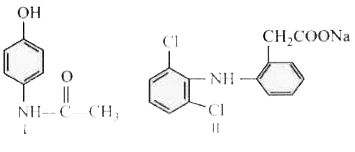
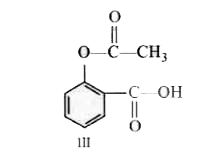
I, II and III respectively areAparacetamol, aspirin and ibuprofenBparacetamol, diclofenac sodium and aspirinCaspirin, diclofenac sodium and paracetamolDibuprofen, paracetamol and aspirinThe most probable velocity is expressed as
A8RTπMB2RTMC(2RTM)1/2D(3RTM)1/2The relation between rms velocity, vrms and the most probable velocity, vmp, of a gas is
Avrms=vmpBvrms=√32mpCvrms=23vmpDvrms=23vmp
Among the following , the plot that shows the correct marking of most probable velocity (VMP) average velocity (→V) and root mean square velocity (VRMS) is :
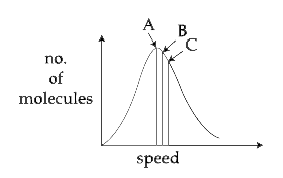
View SolutionIdentify the correct labels of A, B and C in the following graph from the options given below:

Root mean square speed (Vrms, most probable speed (Vmp, Average speed (Vav)
View SolutionConsider the plots for the types of reaction
nA→B+C

These plots respectively correspond to the reaction orders :
View SolutionConsider the plots for the types of reaction
nA→B+C

These plots respectively correspond to the reaction orders :
View SolutionMost probable velocity of a gas is defined as
View Solution
