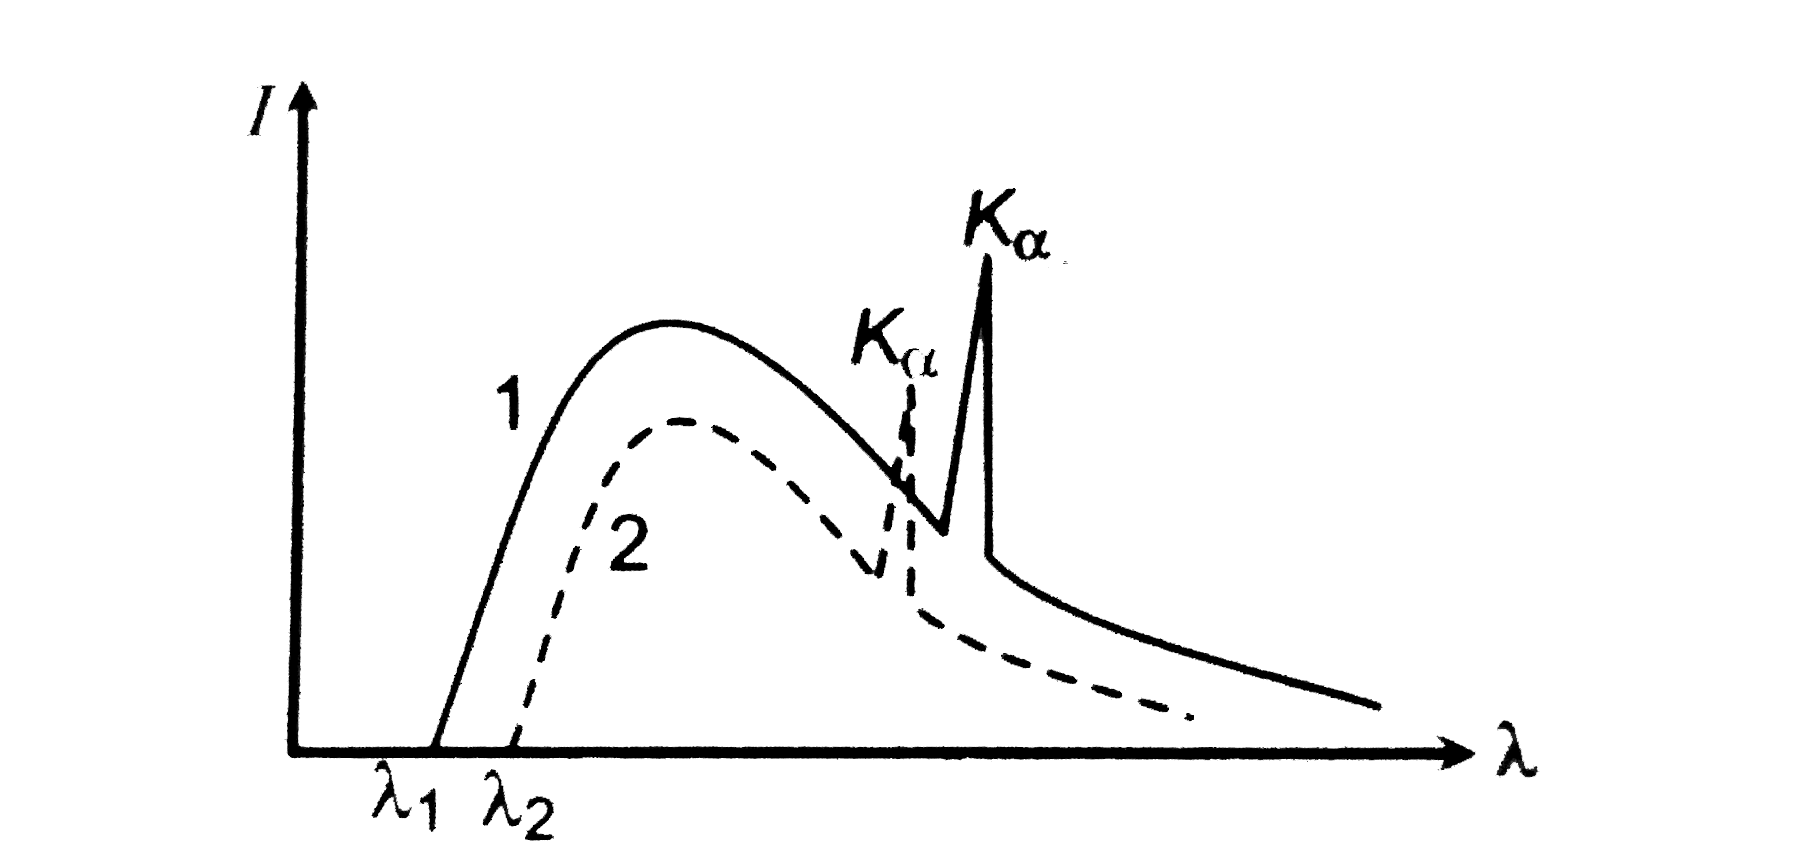
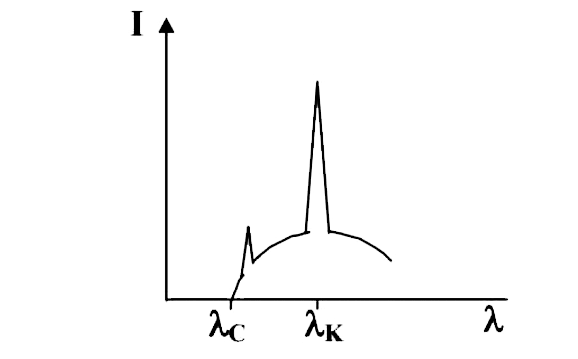
The intensity distribution of X - rays from two Coolidge tubes operated on different voltages V1 and V2 and using is shown in the figure . Which one of the following inequalities is true ?
V1>V2,Z1<Z2
V1>V2,Z1>Z2
V1<V2,Z1>Z2
V1=V2,Z1<Z2
The correct Answer is:A
λmin=hceV⇒λ∝1V
λ2>λ1⇒V1V2
f=a(Z−b)2⇒f∝(Z−1)2
λ∝1(Z−1)2,λ1>λ2⇒Z2>Z1
Similar Questions
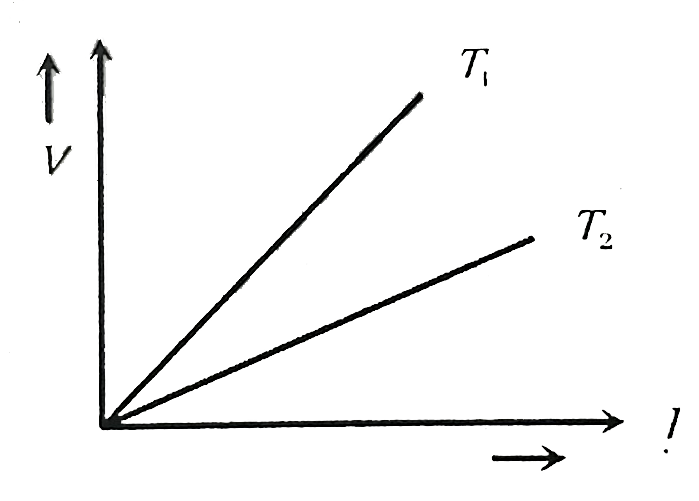
I-V graph for a metallie wire at two different tempearture, T1andT2 is as shown in the figure. Which of the two temperatures is lower and why ?

View SolutionThe intensity of X-rays firom a coollidge tube is plotted against wavelength λ as shown in the figure-3.12. Which ofthe following statements is/are correct:

View Solution
Knowledge Check
A ray of light is incident in situation as shown in figure.
_S01_055_Q01.png)
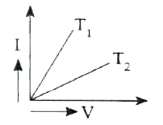
Which of the following statements is/are true?AIf μ2=3.2 then the angle of deviation is zeroBIf μ2=2.8 then the angle of deviation is 60∘CIf μ2=1.8 then the angle of deviation is 120∘DIf μ2=1.8 then the angle of deviation is 60∘The current I and voltage V variations for a given metallic wire at tow different temperature T1andT2 are shown in the figure. Then which one of the following is correct
 AT1>T2BT1<T2CT1=T2DT1=2T2
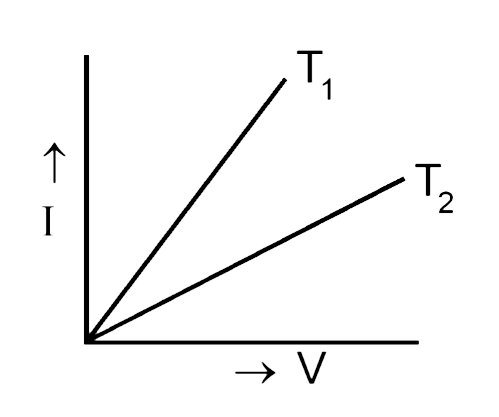
The current (I) and voltage (V) graphs for a given metallic wire at two different temperature (T1) and (T2) are shown in fig. It is concluded that
 AT1=T2BT1>T2CT1<T2DNone of these
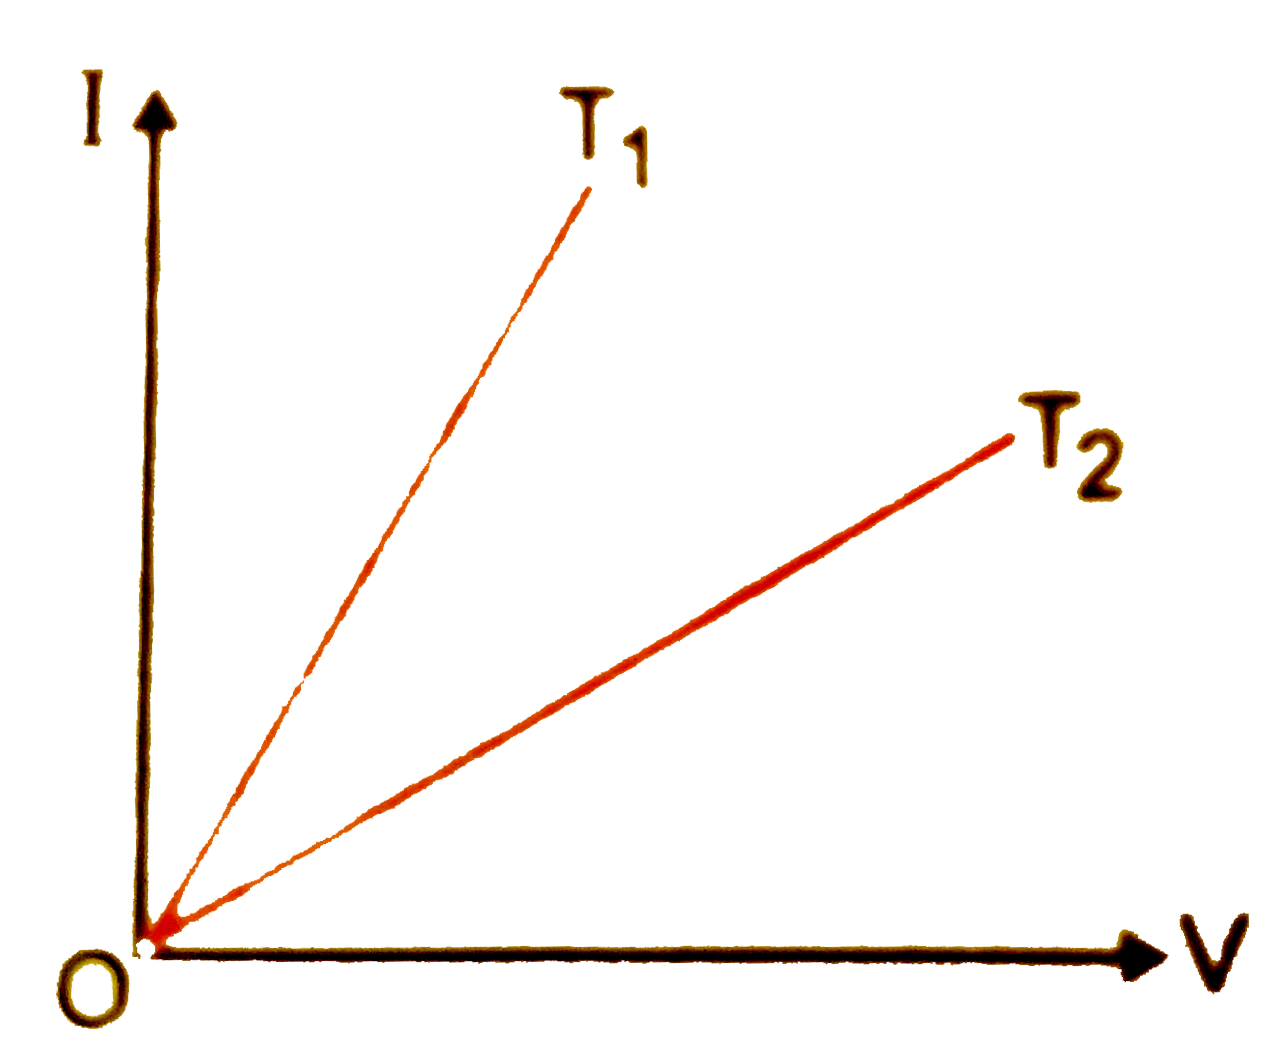
V- I graph for a metallic wire at two different temperature T1 and T2 is shown in figure. Which of the two temperature is higher and why?
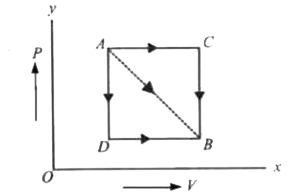
View SolutionAn ideal gas is taken from state A to state B following three different paths as shown in P-V diagram. Which one of the following is true ?
View SolutionThe voltage V and current I v graphs for a conductor at two different temperatures T1andT2 are shown in the figure. The relation between T1andT2 is

View SolutionThe intensity of X- ray from a coolidge tube is plotted againest wavelength λ as shown in the figure . The minimum wavelength found λc and the wavelength of theka line is λλ, As the accelerating voliage is increase
View SolutionThe voltage V and current I graph for a conductor at two different temperatures T1 and T2 are shown in the figure. The relation between T1 and T2 is
View Solution
