In a photocell circuit the stopping potential, , is a measure of the maximum kinetic energy of the photoelectrons. The following graph shows experimentally measured values of stopping potential versus frequency v of incident light.
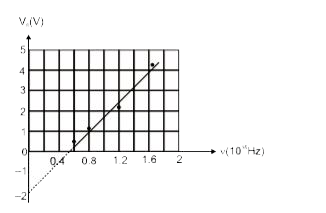
The values of Planks constant and the work function as determined from the graph are (taking the magnitude of electronic charge to be )
The correct Answer is:B
Hence from graph
= Slope
Similar Questions
Draw a graph showing the variation of stopping potential with frequency of the incident on a metal plate. How can the value of Planck's constant be determined from this graph?
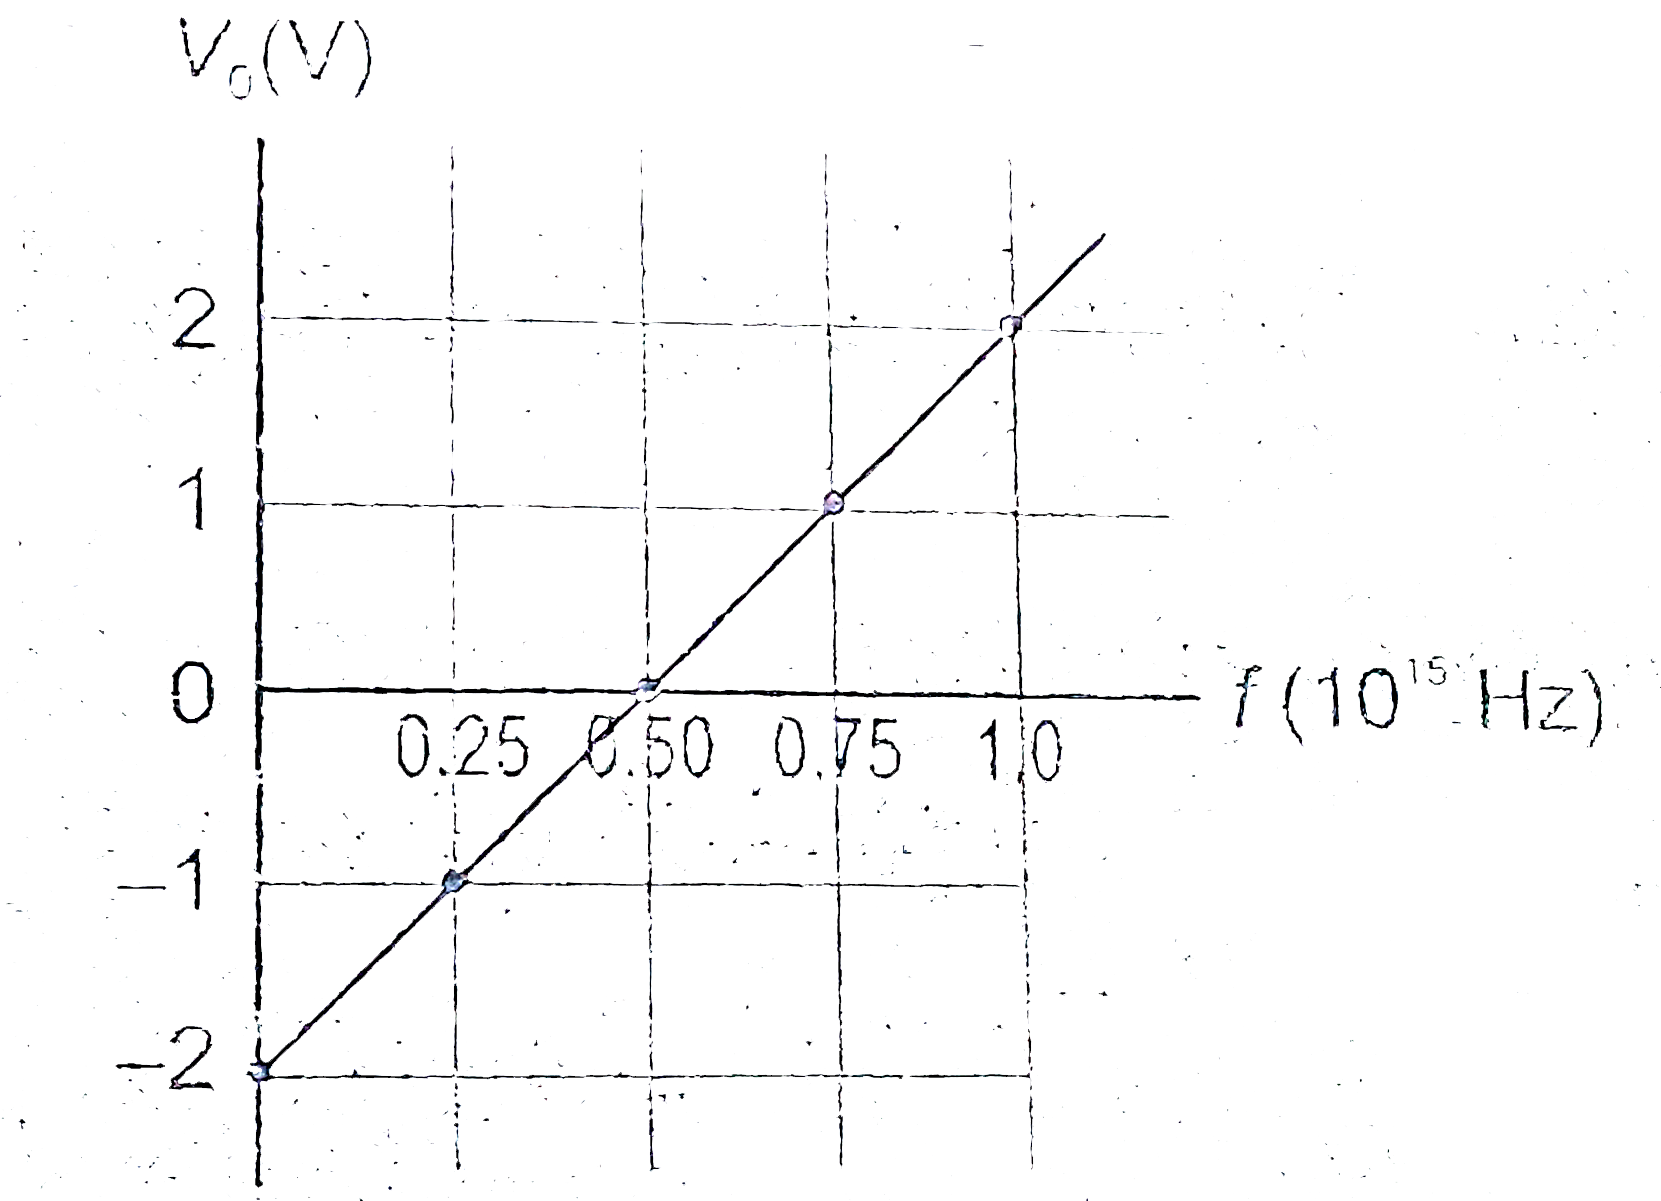
View SolutionThe following figure shows a graph for the stopping potential as a function of the frequency of incident light illuminating a metal surface. Find the photoelectric work function for this surface.
View Solution
Knowledge Check
The maximum kinetic energy of photoelectrons emitted from a surface when photons of energy 6eV fall on it is 4eV . The stopping potential , in volt is
A4B6C8D10From the graph shown, the value of work function if the stopping potential (V), and frequency of the incident light vare on y and x-axes respectively is
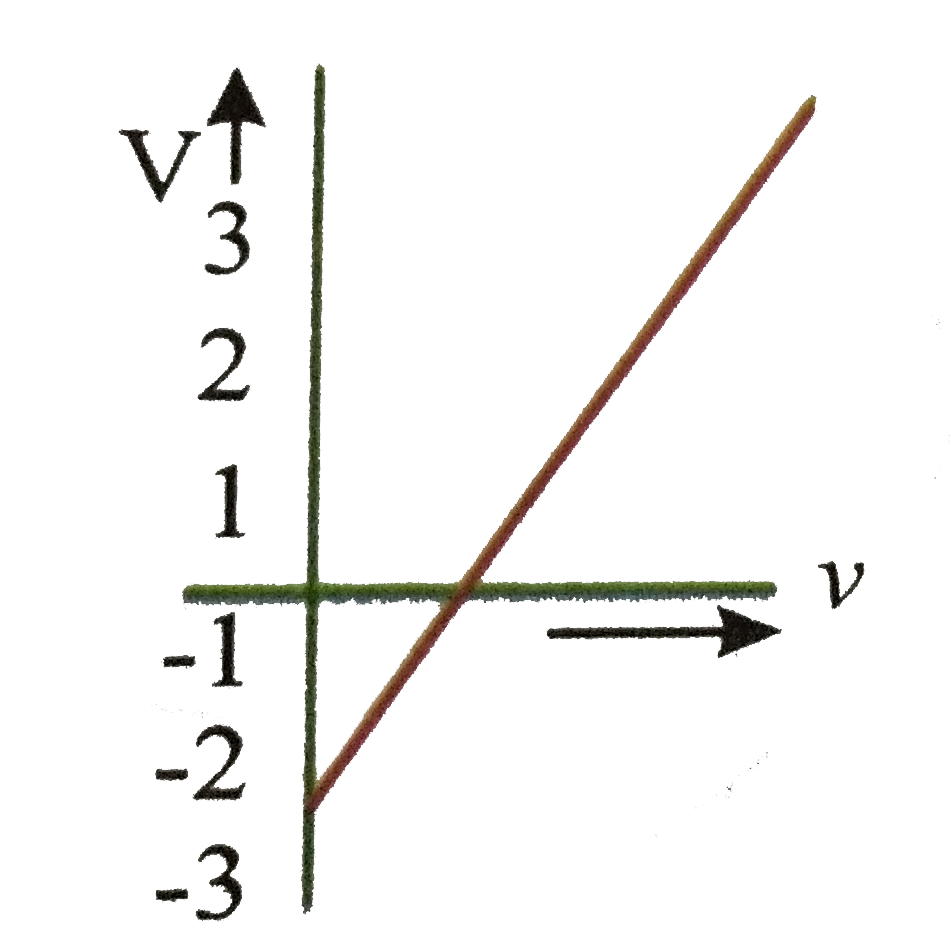 A1eVB2eVC3eVD4eV
When ultraviolet light is incident on a photocell, its stopping potential is V0 and the maximum kinetic energy of the photoelectrons is Kmax. When X-rays are incident on the same cell, then:
AV0 and Kmax both increaseBV0 and Kmax both decreaseCV0 increases but Kmax remains the sameDKmax increases but V0 remains the same
Figure shows the stopping potential (V0) for the photo electron vers (1λ) graph, for two metals A and B, λ being the wavelength of incident light.
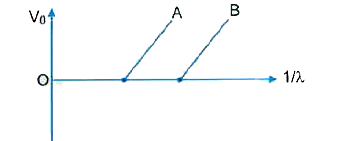
How is the value of Planck's constant determined from the graph ?
View SolutionThe graph shows variation of stopping potential V0 versus frequency of incident radiation v for two photosensitive metals A and B. Which of two metals has higher threshold frequency and why?
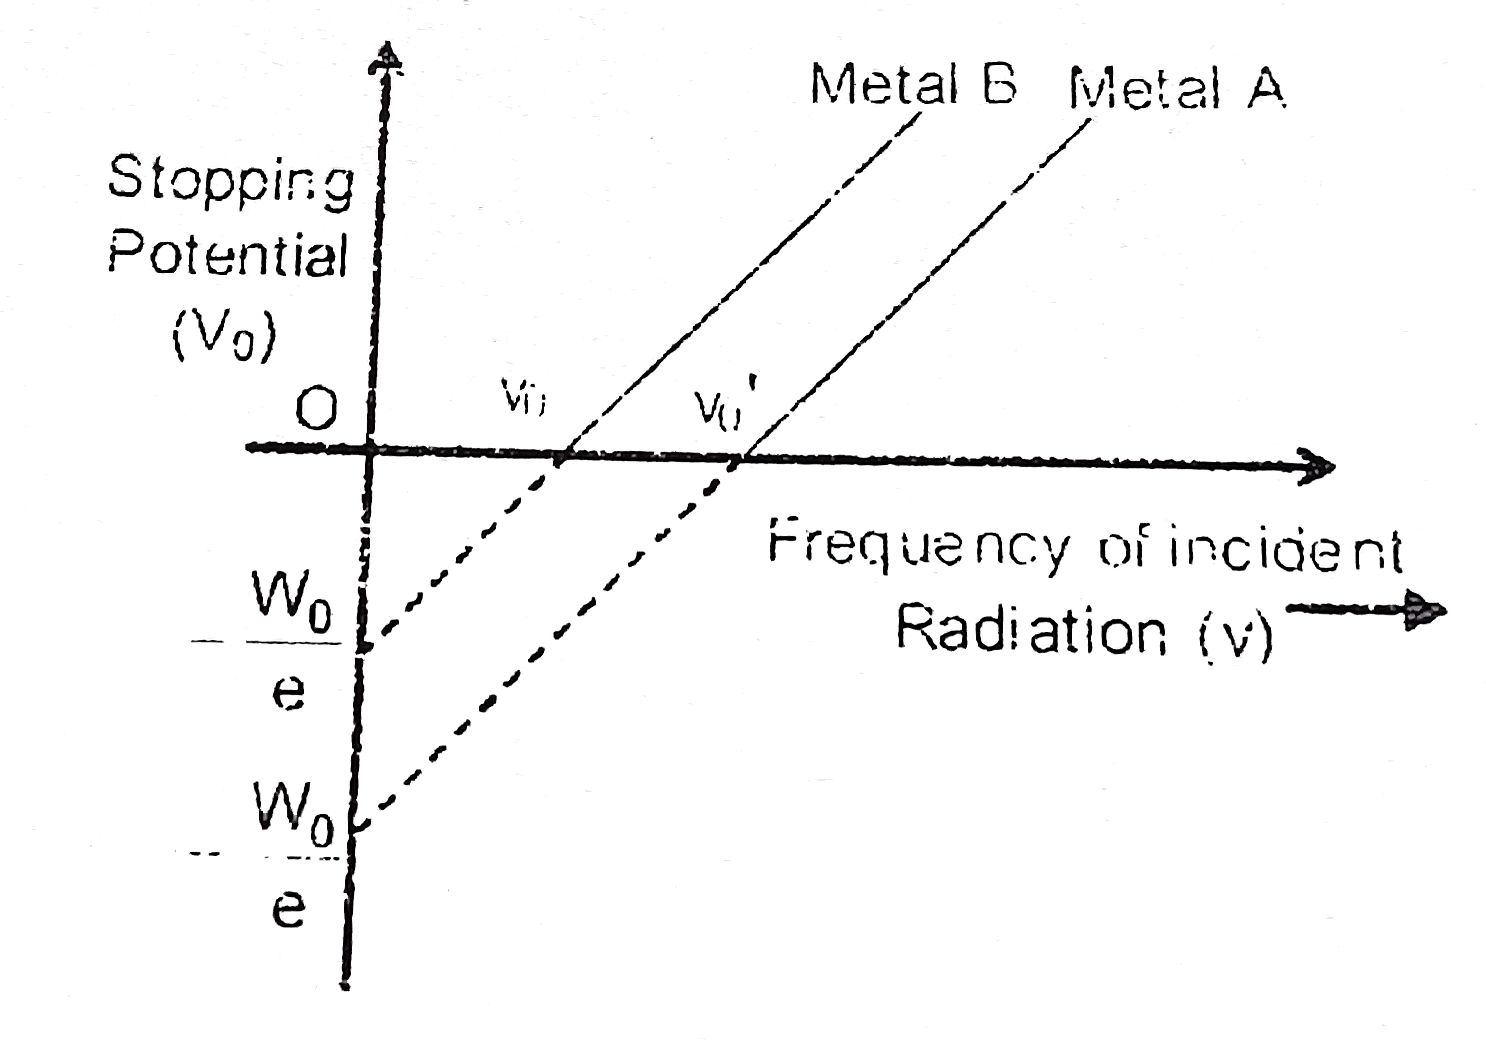
View SolutionDraw a graph showing the variation of stopping potential with frequency of the incident radiation. What does the slope of the line with frequency axis indicate? What information can be obtained from the values of intercept on the potential axis?
View SolutionIn an experiment on photoelectric effect the frequency f of the incident light is plotted against the stopping potential V0. The work function of the metal is given by ( e is the electronic charge)
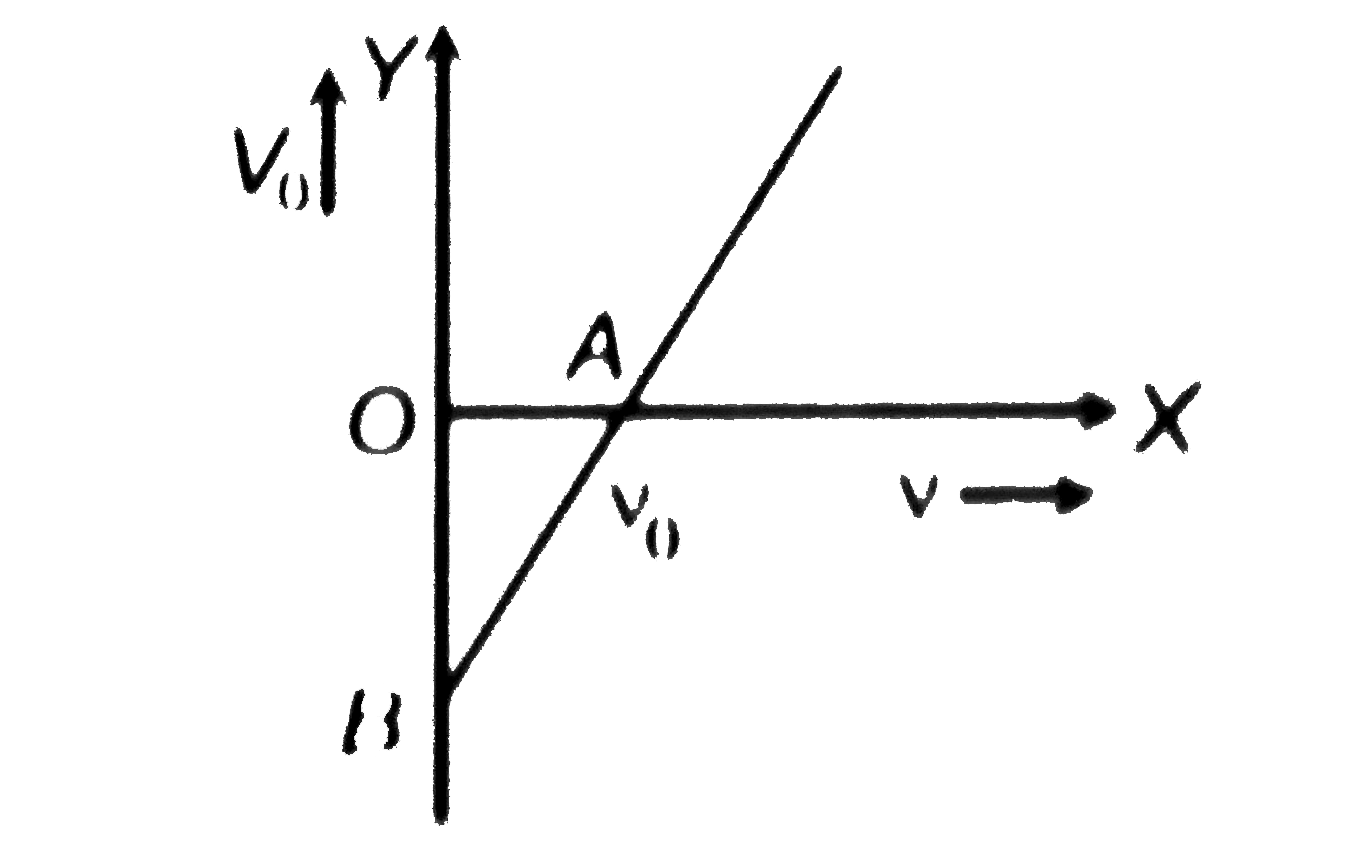
View SolutionChoose the graph showing the correct relationship between the stopping potential V0 and the frequency v of light for potassium and tungsten.
View Solution
