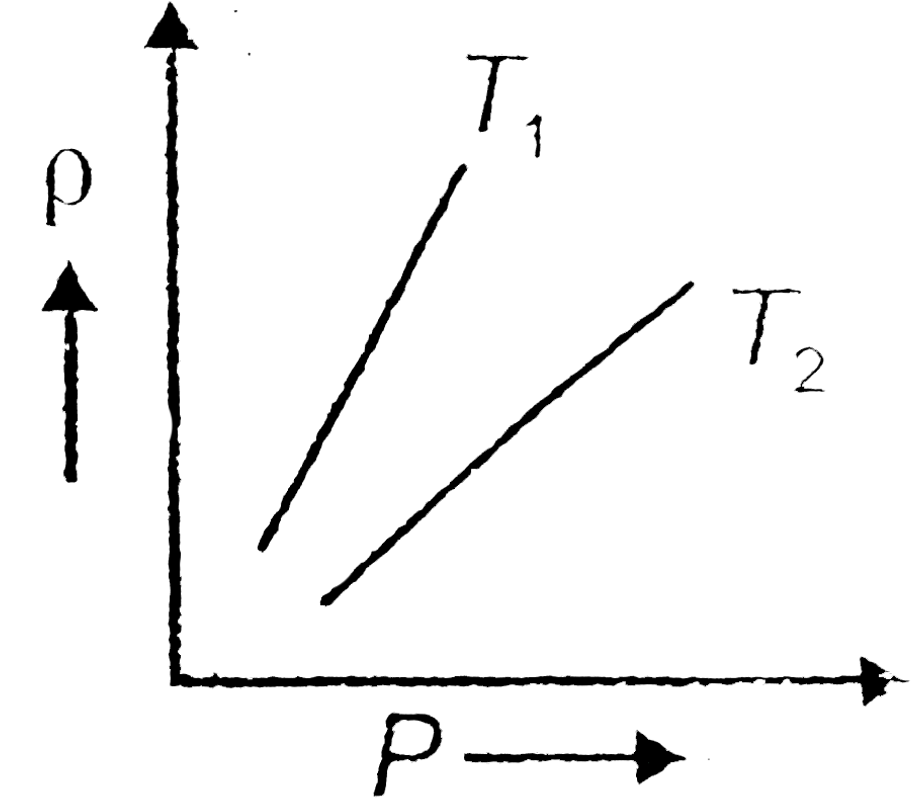
The density (ρ) versus pressure (P) graphs of a given mass of an ideal gas is shown at two temperatures T1andT2. Then relation between T1andT2 may be

T1>t2
T2>T1
T1=T2
All the three are possible
The correct Answer is:B
PV=mMRT
⇒Pρ=RTM⇒Pρ∝1T
Slope =Pρ, Hence T2>T1
Similar Questions
The following graph respresent the pressure versus number density for ideal gas at two different temperature T1andT2. The graph implies ................. .
View SolutionFor a certain mass of gas Isothermal relations between 'P' and 'V' are shown by graphs at two different teperature T1andT2 then

View SolutionFor a certain mass of gas Isothermal relations between .P. and .V. are shown by graphs at two different temperatures T_(1) and T_(2) then
View SolutionFigure shows graphs of pressure versus density for an ideal gas at two temperatures T_(1) and T_(2) Which is correct ? .
View Solutionनिम्न चित्र में एक आदर्श गैस के लिए दाब तथा घनत्व के मध्य ग्राफ दो तापमानों T1 तथा T2 पर खींचे गए हैं। कौन-सा सम्बन्ध सही है?

View SolutionThe density (rho) versus pressure (P) graphs of a given mass of an ideal gas is shown at two temperatures T_(1) and T_(2) . Then relation between T_(1) and T_2 may be
View SolutionFigure shows graphs of pressure vs density for an ideal gas at two temperature T1andT2. Which of the following is correct?

View SolutionFigure shows graphs of pressure vs density for an ideal gas at two temperature T1 and T2 . Which of the following is correct ?

View Solution
