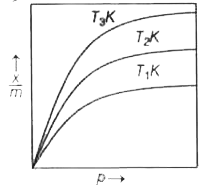
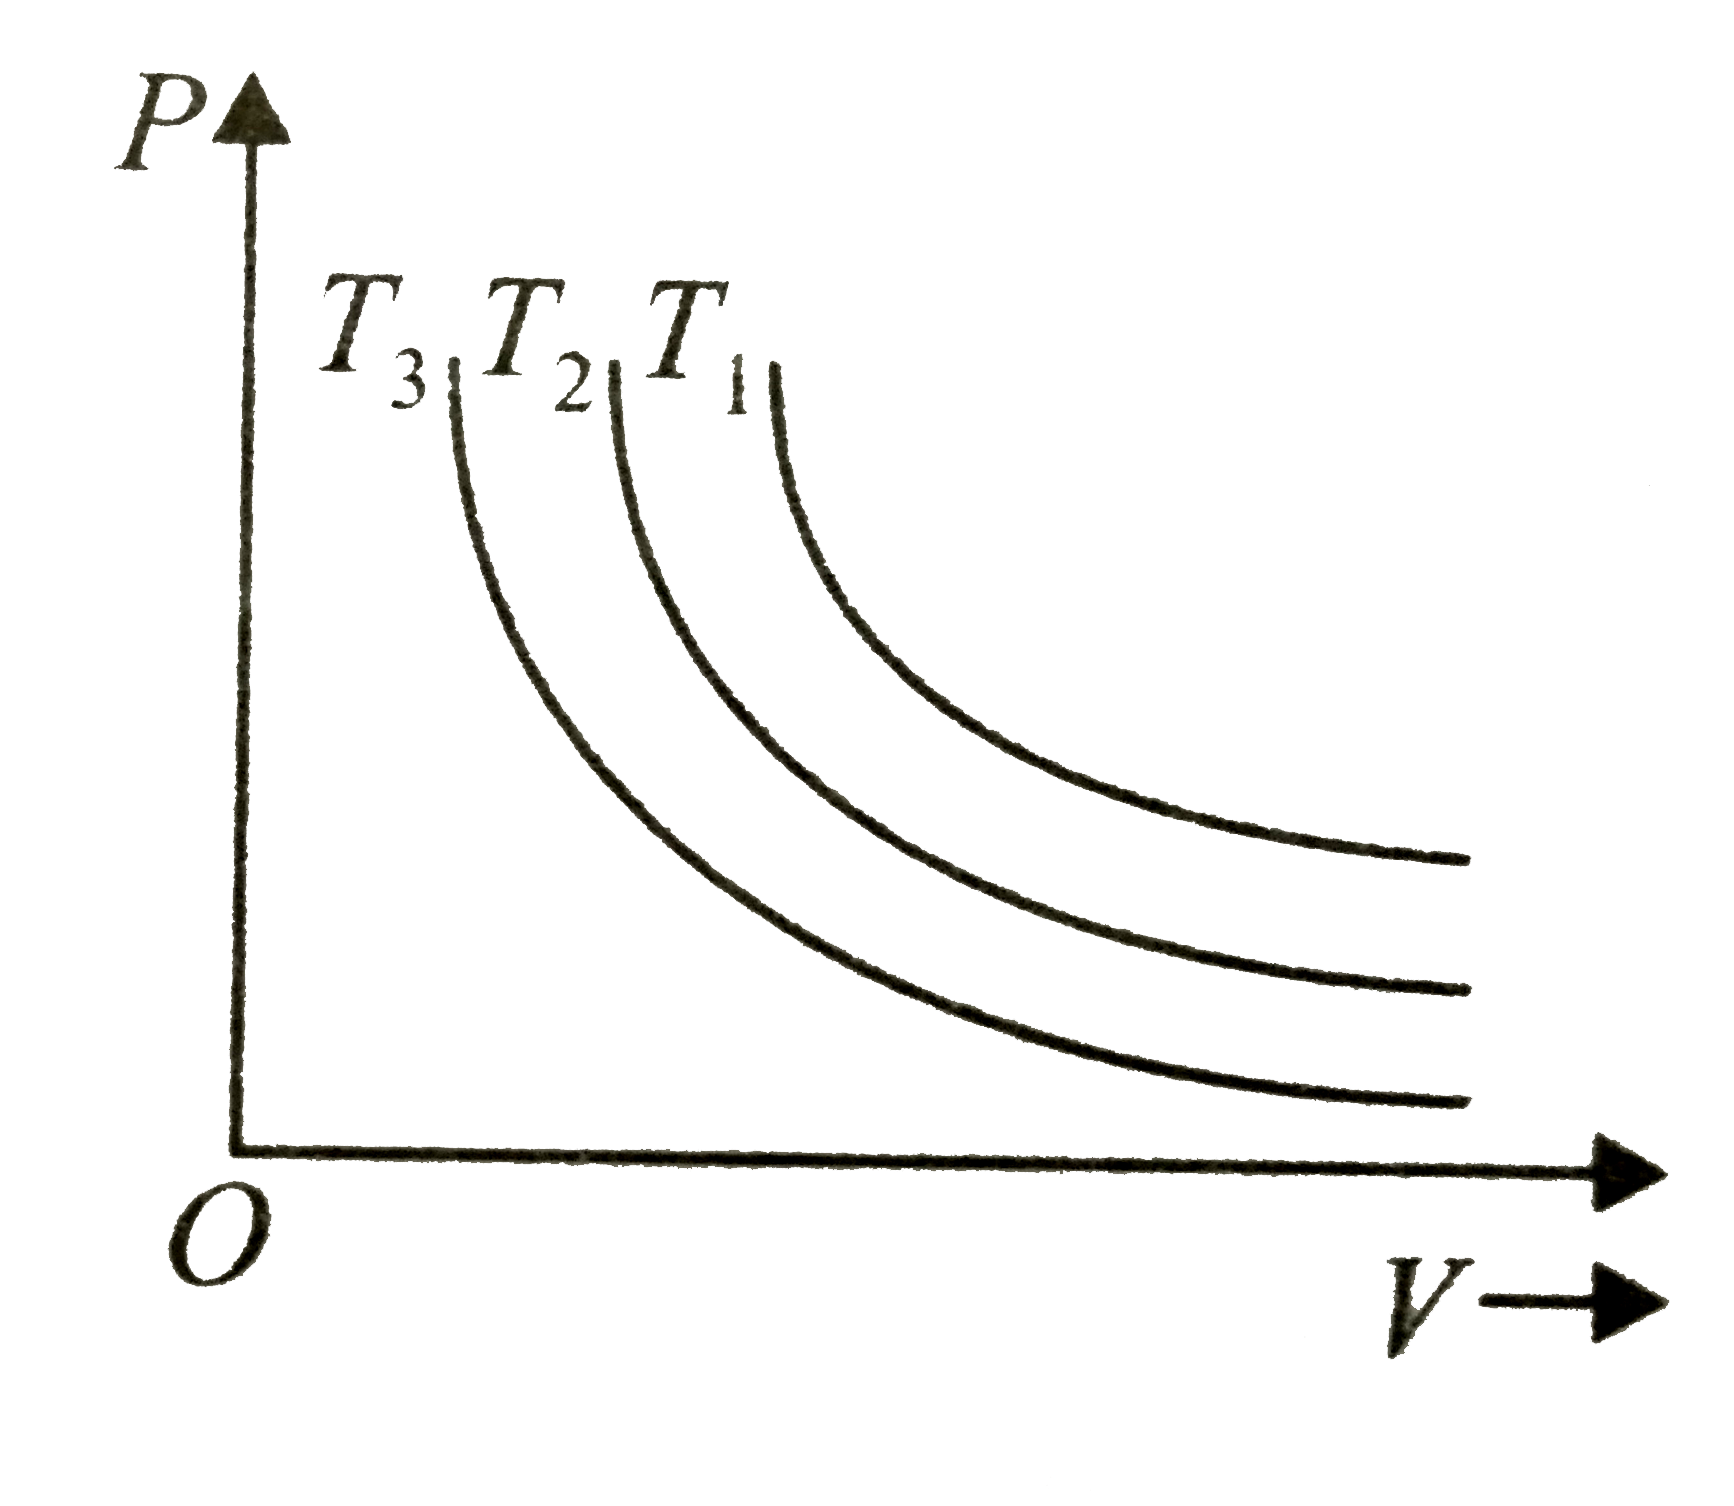
Freundlich adsorption isotherms for the physical adsorption of a gas at temperature T1,T2andT3 are shown in the graph given below. The correct relationship between T1,T2andT3 is
 Solution in Telugu
T1<T2<T3
T3<T1<T2
T3<T2<T1
T2<T1<T3
The correct Answer is:C
Step by step video, text & image solution for Freundlich adsorption isotherms for the physical adsorption of a gas at temperature T_(1), T_(2) and T_(3) are shown in the graph given below. The correct relationship between T_(1), T_(2) and T_(3) is by Chemistry experts to help you in doubts & scoring excellent marks in Class 12 exams.
Updated on:21/07/2023Topper's Solved these Questions
- AP EAMCET ENGINEERING ENTRANCE EXAM QUESTION PAPER 2017 (SOLVED)Book:TS EAMCET PREVIOUS YEAR PAPERSChapter:AP EAMCET ENGINEERING ENTRANCE EXAM QUESTION PAPER 2017 (SOLVED)Exercise:Chemistry
Explore 40 Videos
- AP EAMCET SOLVED PAPER 2019Book:TS EAMCET PREVIOUS YEAR PAPERSChapter:AP EAMCET SOLVED PAPER 2019Exercise:CHEMISTRY
Explore 13 Videos
Similar Questions
i) H3PO4(aq)⇔H_(aq)+H2PO−4(aq)
ii)H2PO−⇔4(aq)H+(aq)+H2PO2−4(aq) .
iii) H2PO2−4(aq)⇔H+(aq)+PO3−4(aq) . The equilibrium constantsfor the above reactions at a certain temperature are K1,K2andK3 respectively. The equilibrium constant for the reaction. H3PO4(aq)⇔3H+(aq)+PO3−4(aq) in terms K1,K2andK3 is
View SolutionThe energies of an electron in first orbit He+ and in third orbit of Li2+ in J are respectively
View SolutionThe V - i graph for a conductor at temperature T_(1) and T_(2) are as shown in the figure. ( T_(2) - T_(1)) is proportional to
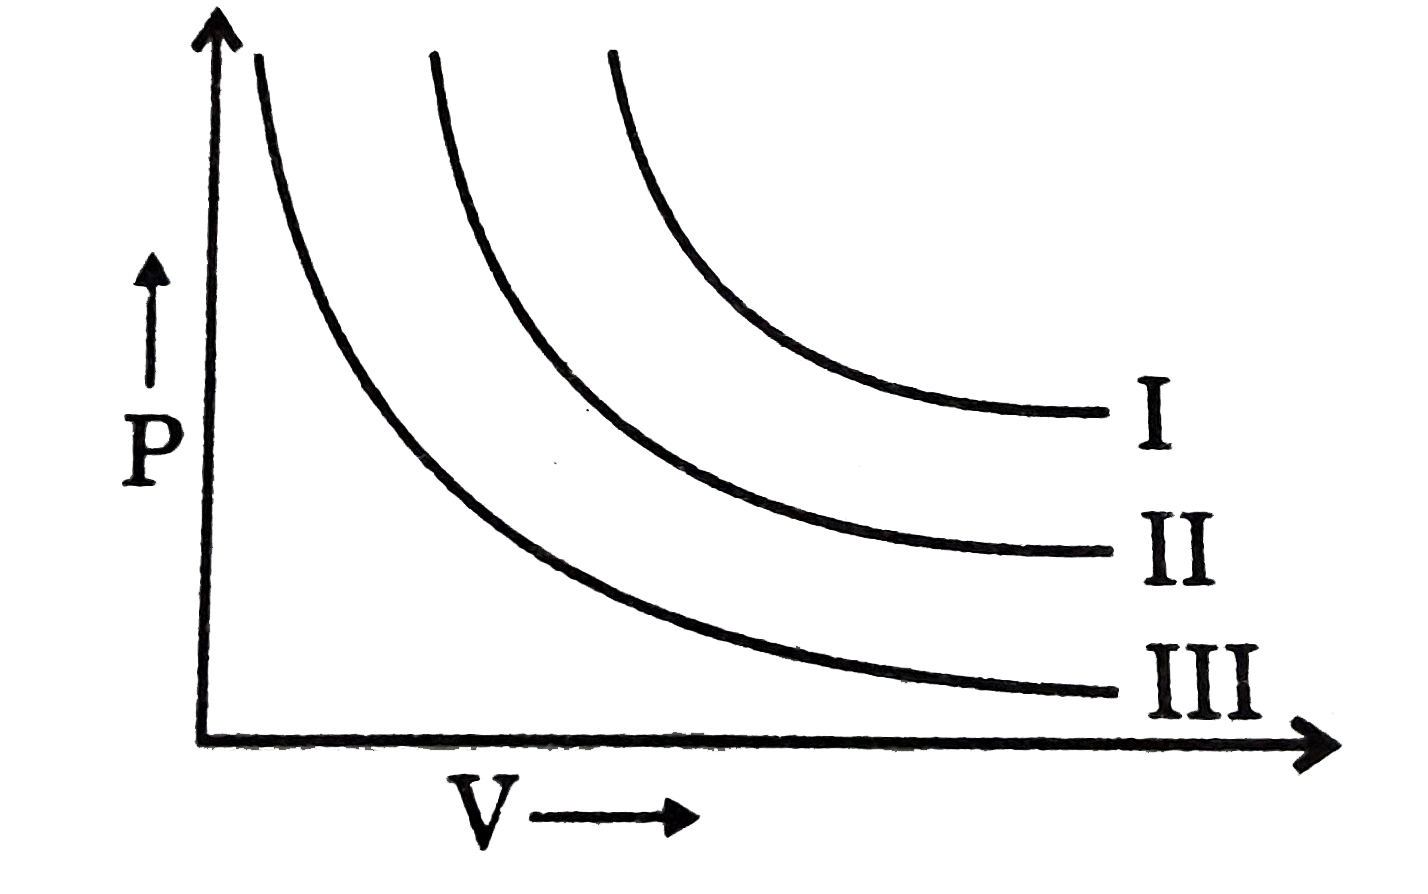
View SolutionI,II,III are three isotherms respectively at T1,T2 and T3 for a fixed mass of gas, as shown in graph. Temperature will be in order :
View SolutionFreundlich adsorption isotherm is represnted at temparetures T1,T2andT3 .
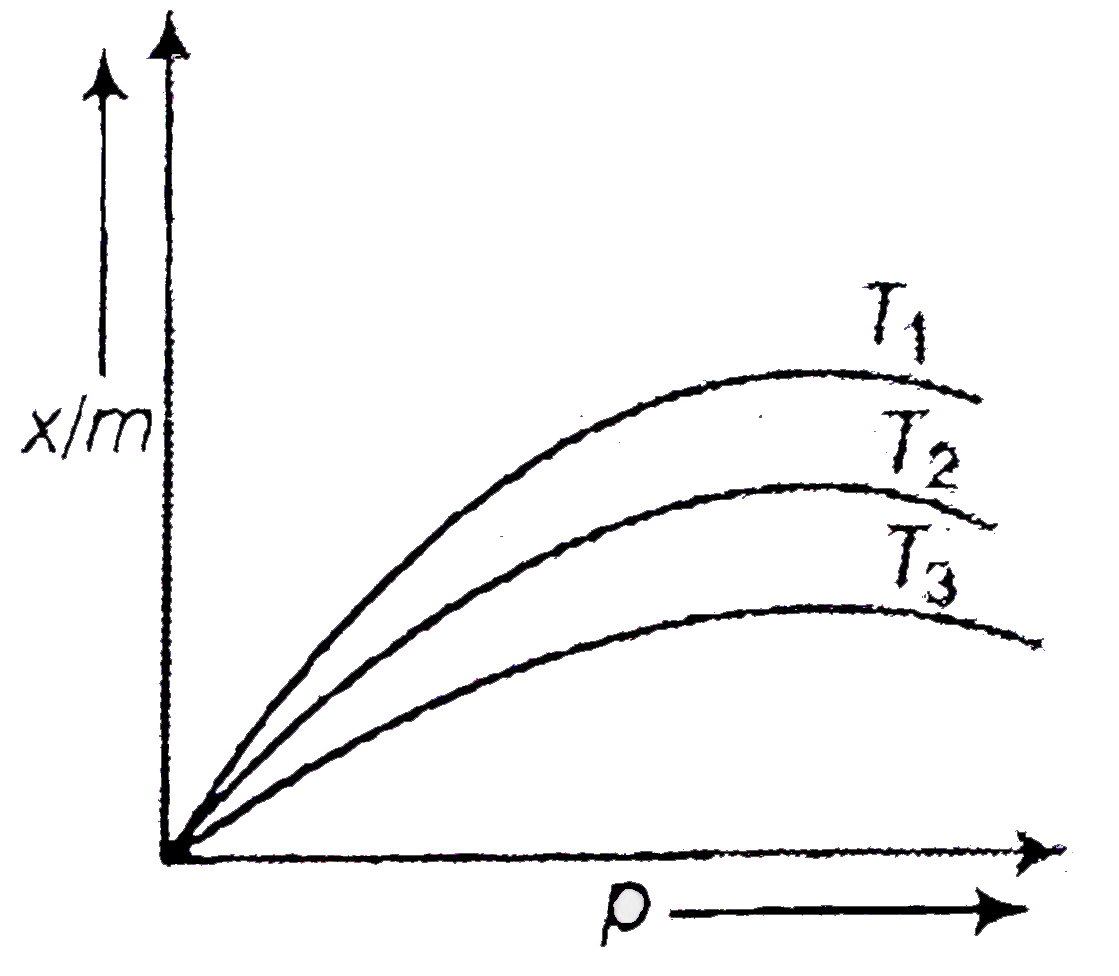
Arrange the temperatures in the increasing order as shown in the graph.
View SolutionIn following isothermal graphs A, B and C at temperatures T_(1), T_(2) and T_(3) , the correct order of temperatures will be :
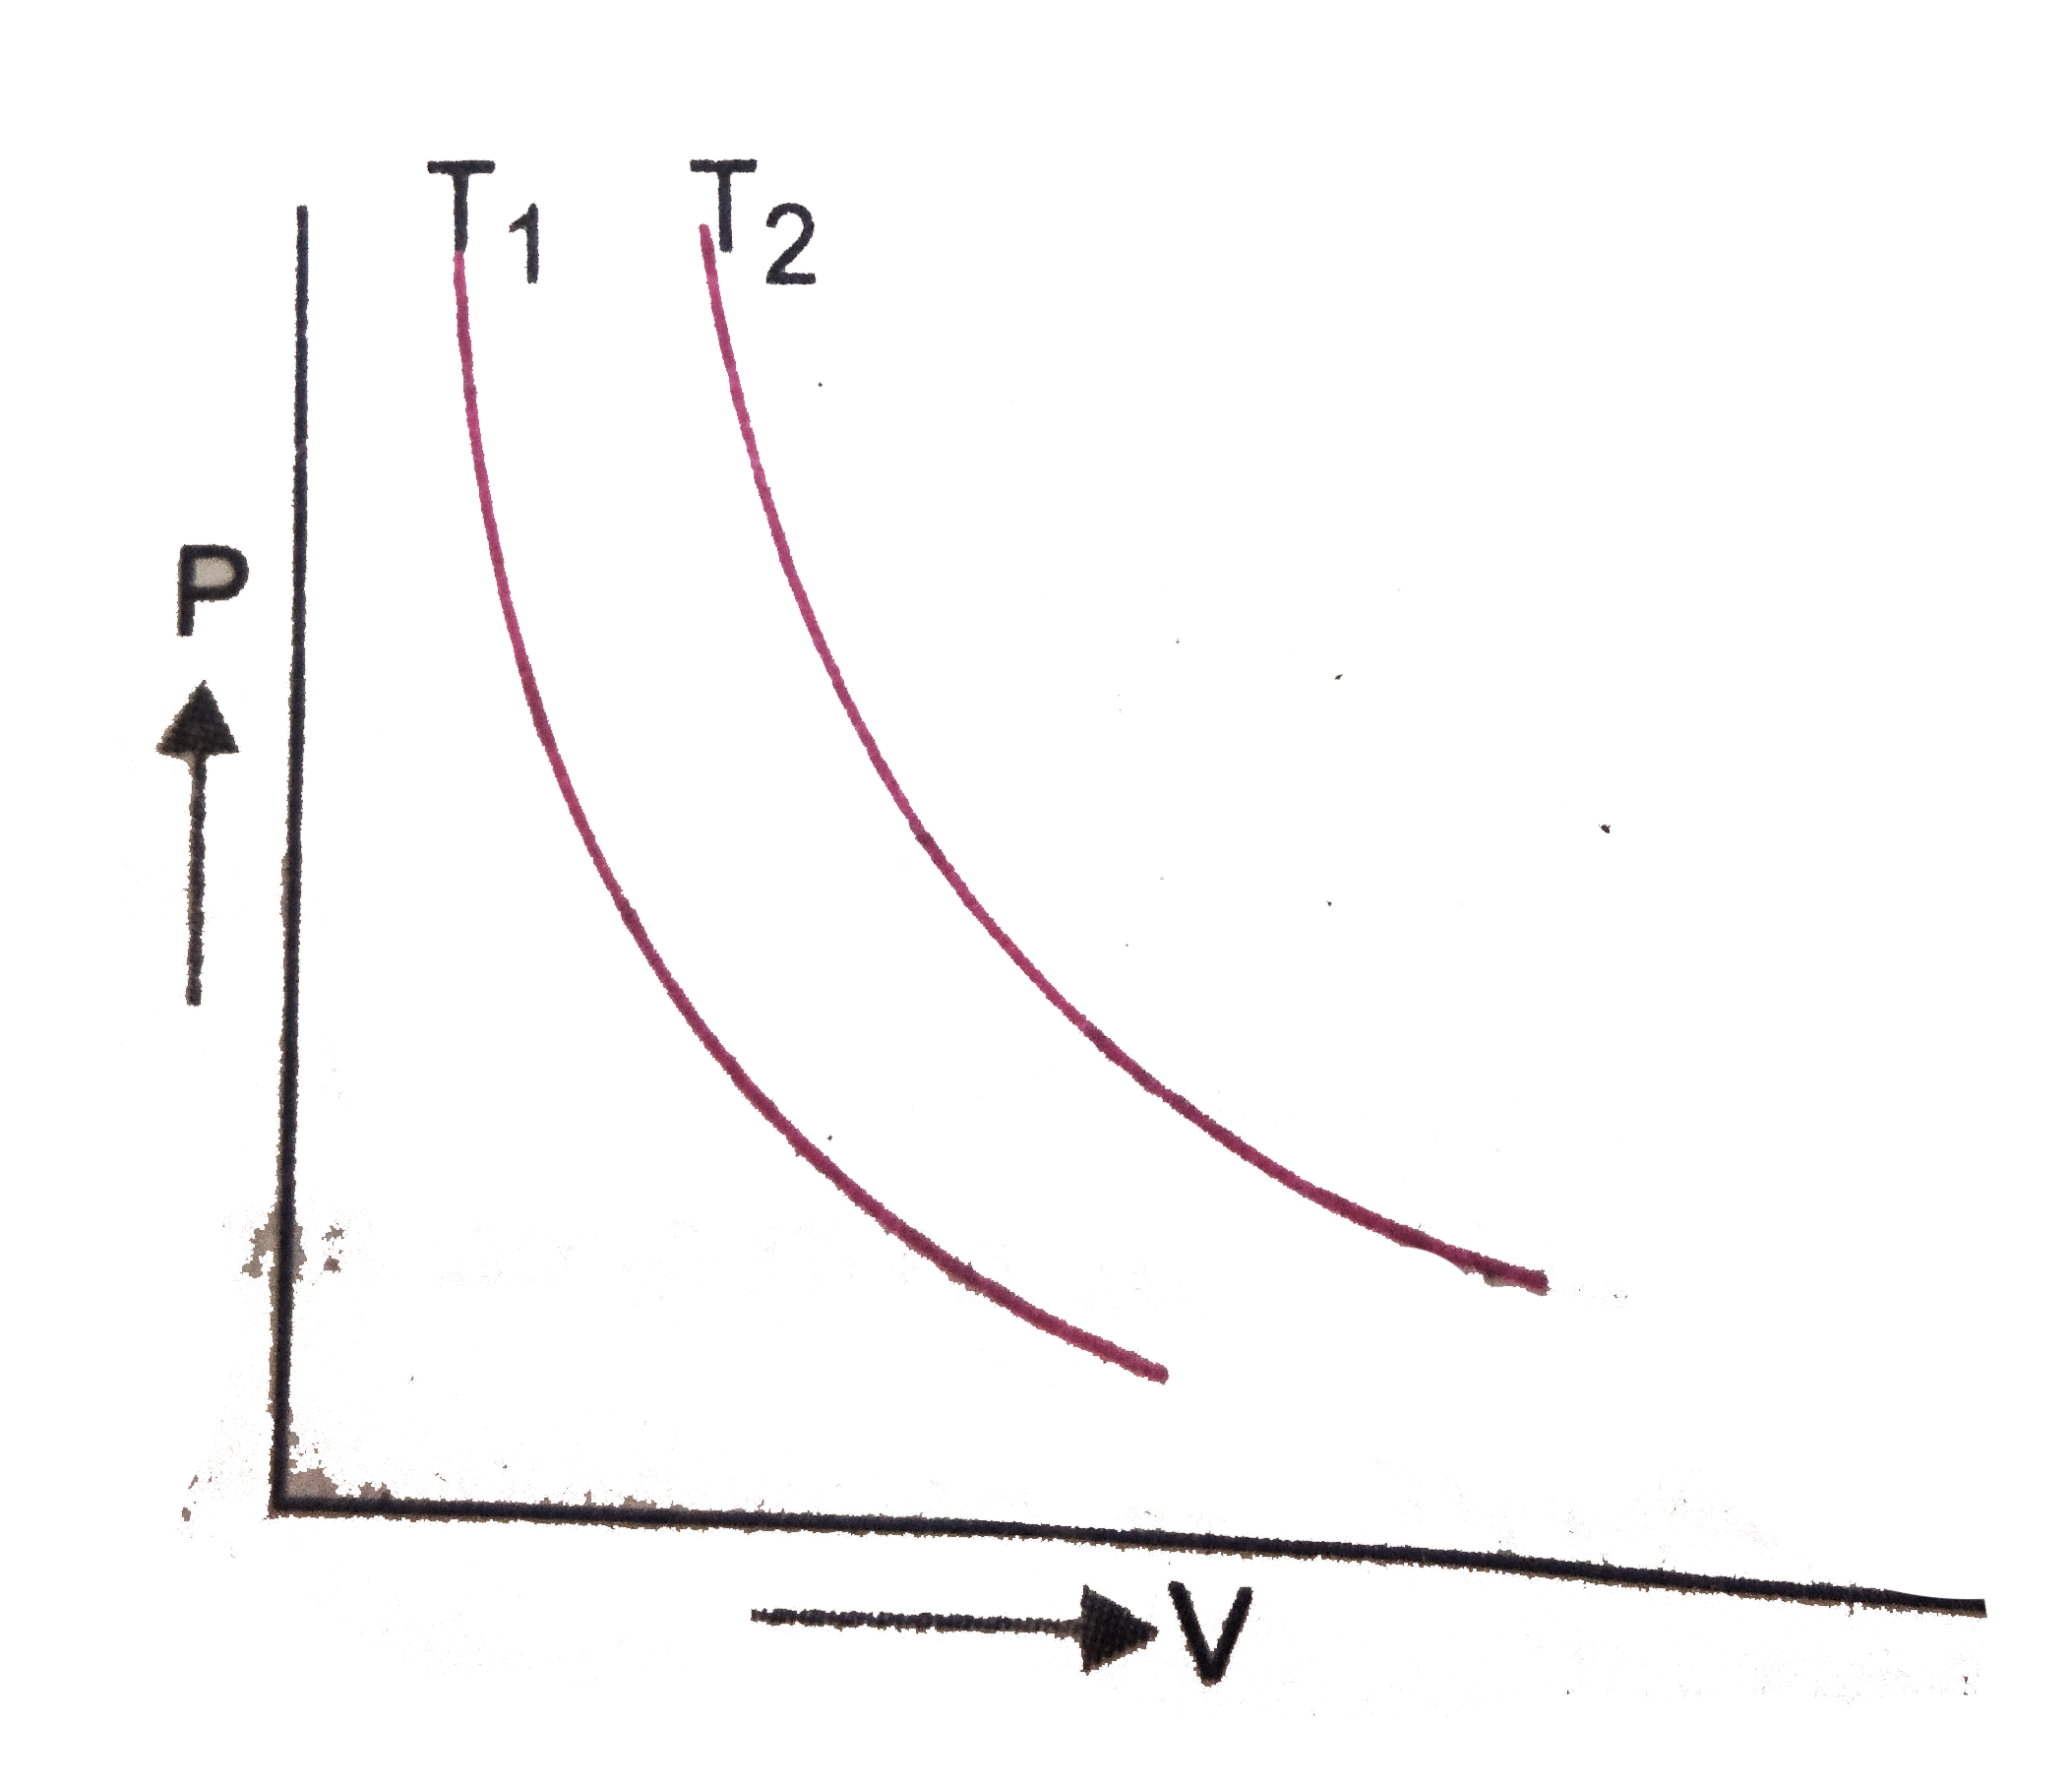
View SolutionIsothermal curves for a given mass of gas are shown at two different temperture T1andT2 in Fig. State whether T1>T2orT2>T1. Justify your answer.
View Solutionनिम्न चित्रों में T1 तथा T2(T2>T1) ताप पर कृष्ण वस्तु हेतु ऊर्जा वितरण दर्शाये गये हैं, कौन सा ग्राफ सही है
View SolutionThe area of triangle formed by the points points and t1,t2 and t3 on y3 =4ax is k|(t1−t2)(t2−t3)(t3−t1)| then K =
View SolutionThe V - i graph for a conductor at temperature T_(1) and T_(2) are as shown in the figure. ( T_(2) - T_(1)) is proportional to
View SolutionThe isothermal diagram of a gas at three different temperatures T1,T2andT3, is show in the given figure .Then
View SolutionV - I graph of a conductor at temperature T_(1) and T_(2) are shown in the figure (T_(2)-T_(1)) is proportional to
View Solutionतीन विभिन्न तापों T1,T2 एवं T3 पर किसी गैस के समतापीय ग्राफ को दिये गये चित्र में दर्शाया गया है तो-
View SolutionIf t_(1)+t_(2)+t_(3)=-t_(1)t_(2)t_(3) , Then points [at_(1)t_(2),a(t_(1)+t_(2))] , [at_(2)t_(3),a(t_(2)+t_(3))] And [at_(3)t_(1),a(t_(3)+t_(1))] The perpendicular of the triangle with vertices will be
View SolutionT1,T2, व T3 ताप पर तीन कृष्णिकाओ के लिए विकिरण की तीव्रता तथा तरंगदैर्ध्य में वक्र दिखाया गया है, तब T1,T2, व T3 में सही संबंध होगा

View Solution

