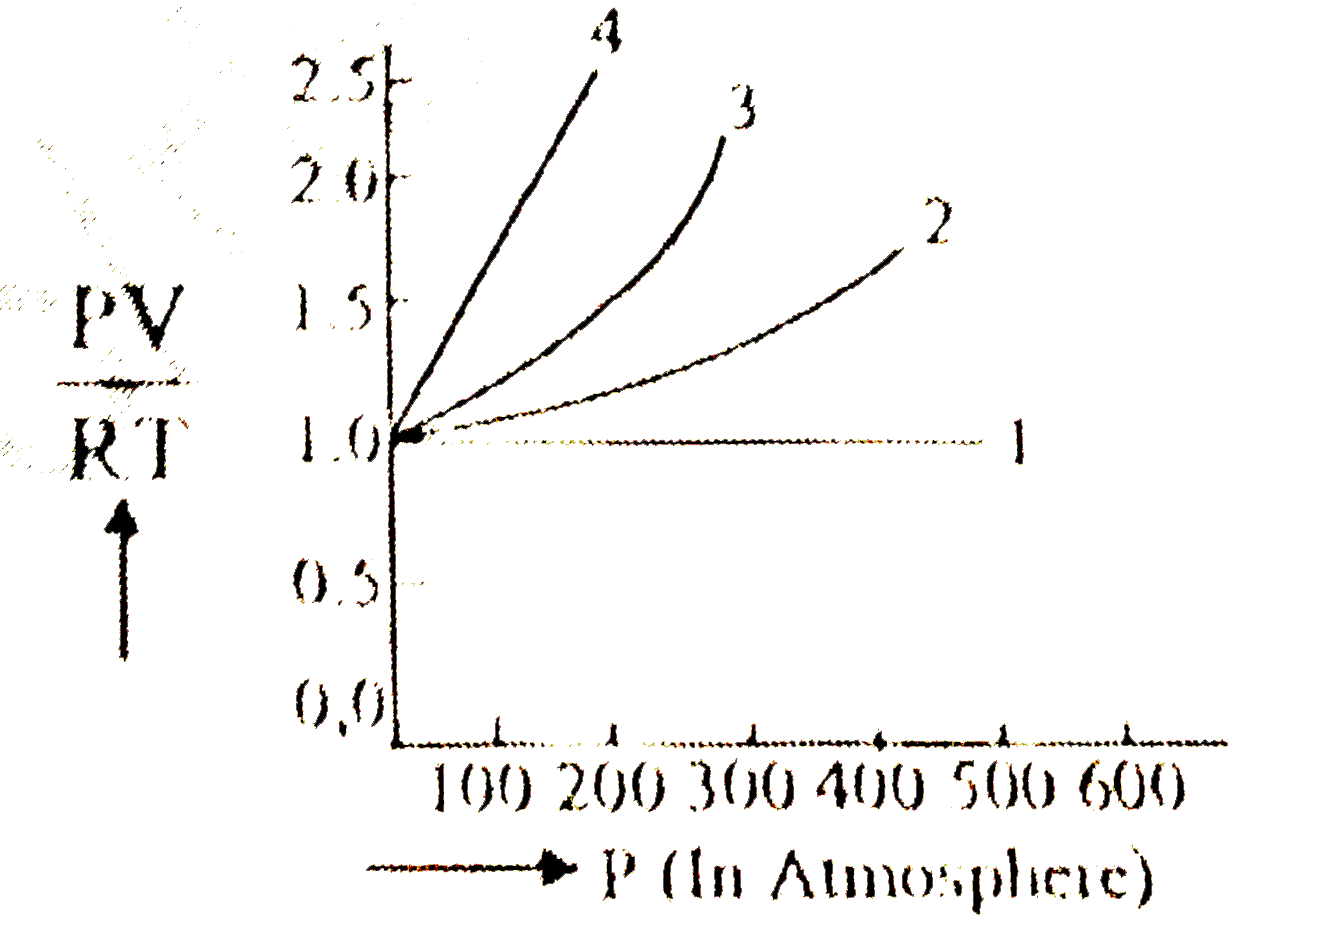
A fixed amount of ideal gas (1 mole) is taken and is subjected to pressure and temperature variation. The experiment is performed at low pressures as well as at high temperatures. The results obtained are shown in the Fig. The correct variation of with P will be exhibited by

4
3
2
1
The correct Answer is:B
At high pressure, gas deviates from ideal behaviour
Similar Questions
A: A real gas will approach ideal behaviour at high temperature and low pressure. R: At low pressure and high temperature z = 1, for all gases
View SolutionThe relationship is seen in the change in pressure at the temperature of a fixed quantity (1 mole) of hydrogen gas. It is used at high temperature and high pressure. The results obtained are shown in Fig. (pV)/(RT) In which curve is the correct change with p p shown?
View SolutionA gas behaves more closely as an ideal gas at (a)low pressure and low temperature. (b)low pressure and high temperature (c) high pressure and low temperature (d) high pressure and high temperature
View Solution(A) : A gas behaves more closely as an ideal gas at low pressure and high temperature. ( R) : Boyle's law is valid at low pressure and high temperature.
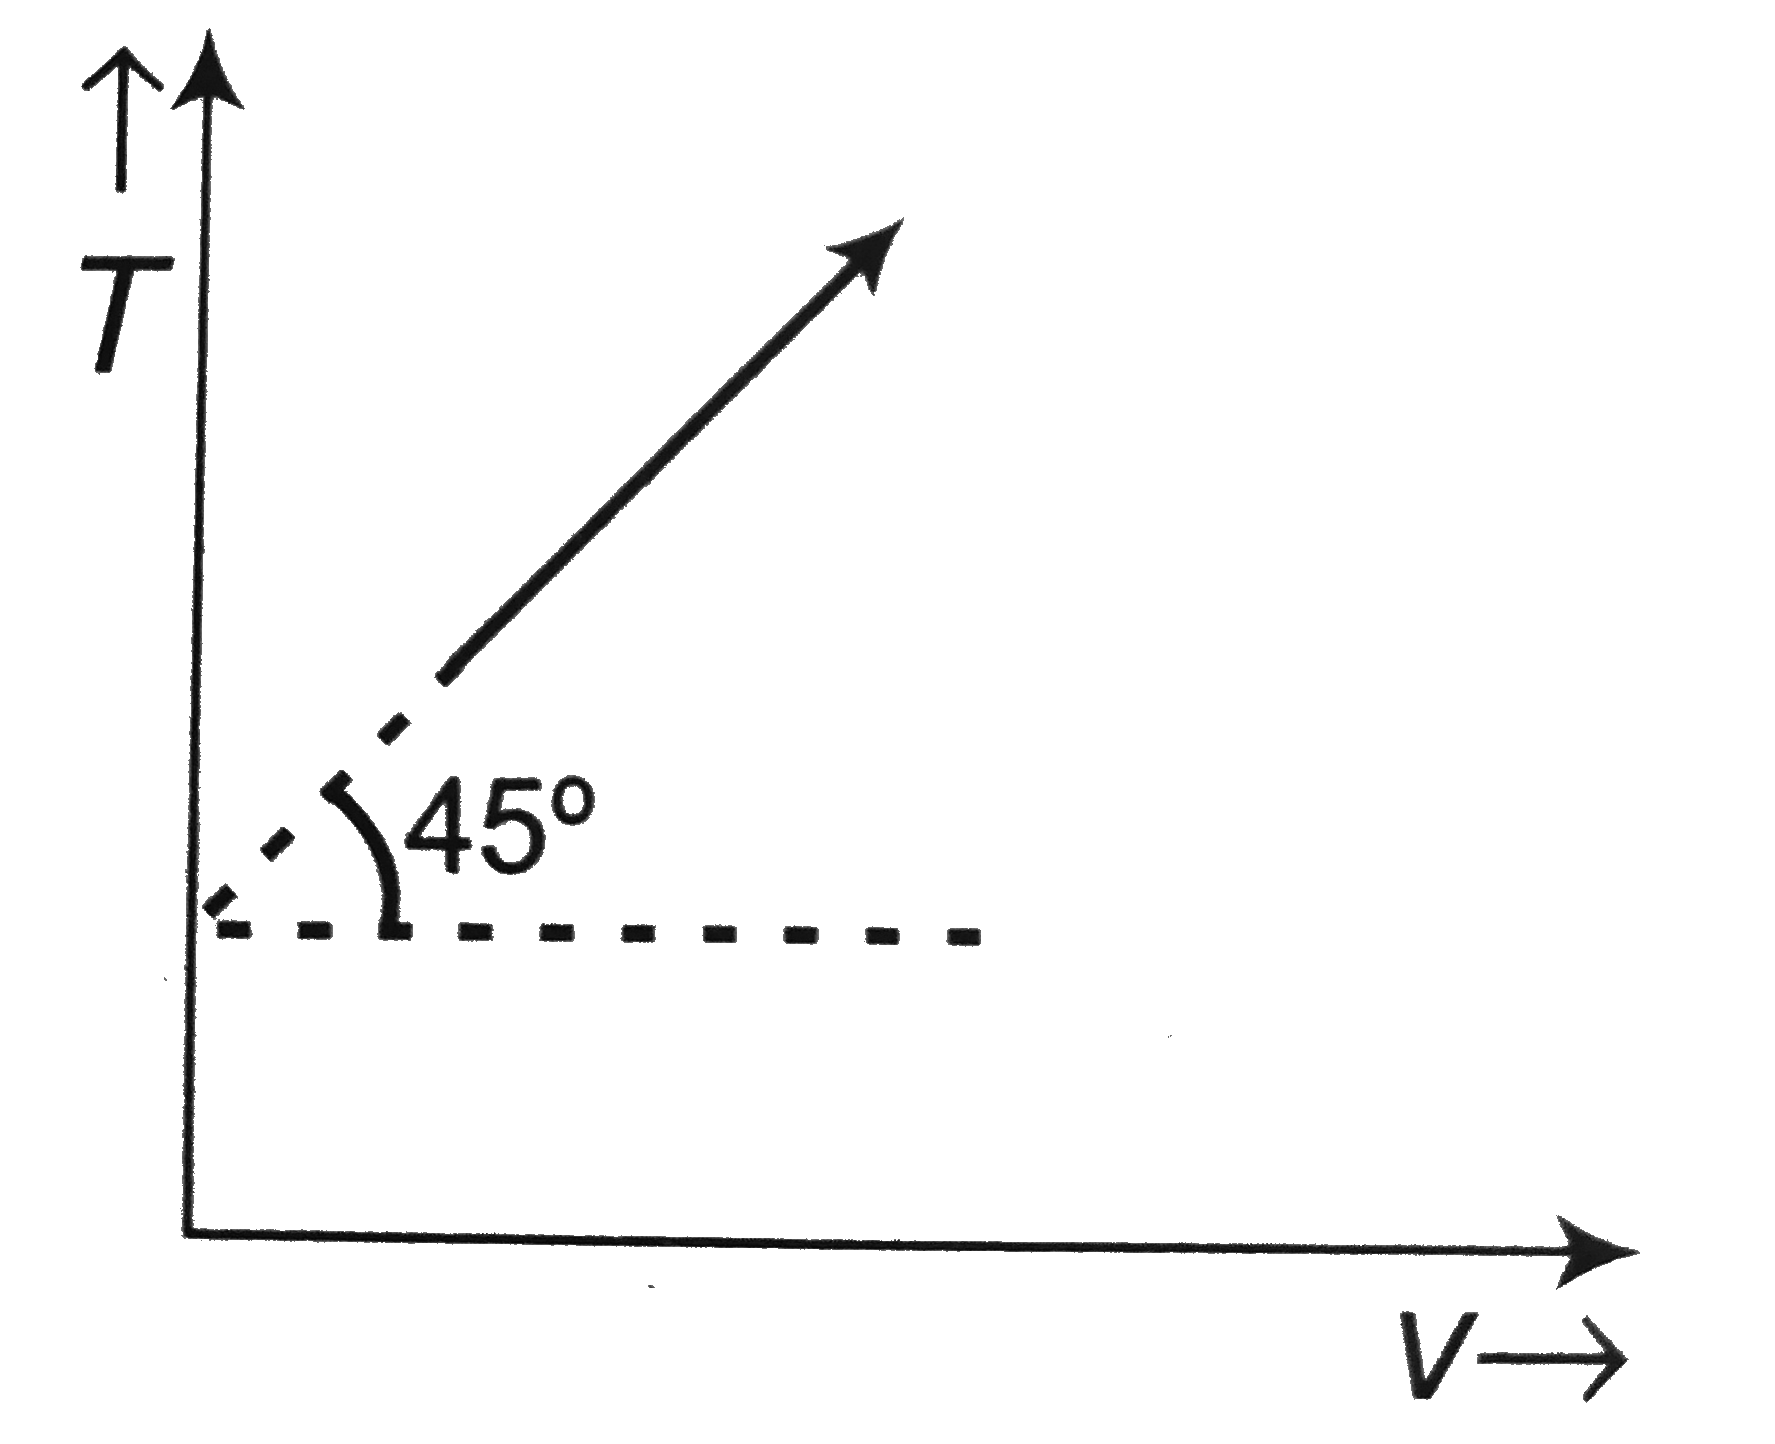
View SolutionThe given curve represents the variation of temperature as a function of volume for one mole of an ideal gas. Which of the following curves best represents the variation of pressure as a function of volume?

View SolutionA: A real gas will approach ideal behaviour at high temperature and low pressure.
R: At low pressure and high temperature z = 1, for all gases
View SolutionSketch shows the plot of Z v/s P for a hypothetical gas for one mole at three distint temperature. Boyle's temperature is the temperature at which gas shows ideal behaviour over a pressure range in the low pressure region.Boyle's temperature (T_b)=a/(Rb) .If a plot is obtained at temperature well below Boyle's temperature then the curve will show negative deviation, in low pressure region and positive deviation in the high pressure region. Near critical temperature the curve is more likely as CO_2 and the temperature well above critical temperature curve is more like H_2 at 0^@C as shown above.At high pressure suppose all the constant temperature curve varies linearly with pressure according to the following equation : Z=1+(Pb)/(RT) ( R=2 cal "mol"^(-1) K^(-1) ) In very high pressure region if Z v/s P is plotted at 1200 K for the above gas then it will have greatest slope.
View SolutionThe given curve represents the variation of temperature as a function of volume for one mole of an ideal gas. Which of the following curves best represents the variation of pressure as a function of volume?
View Solution
