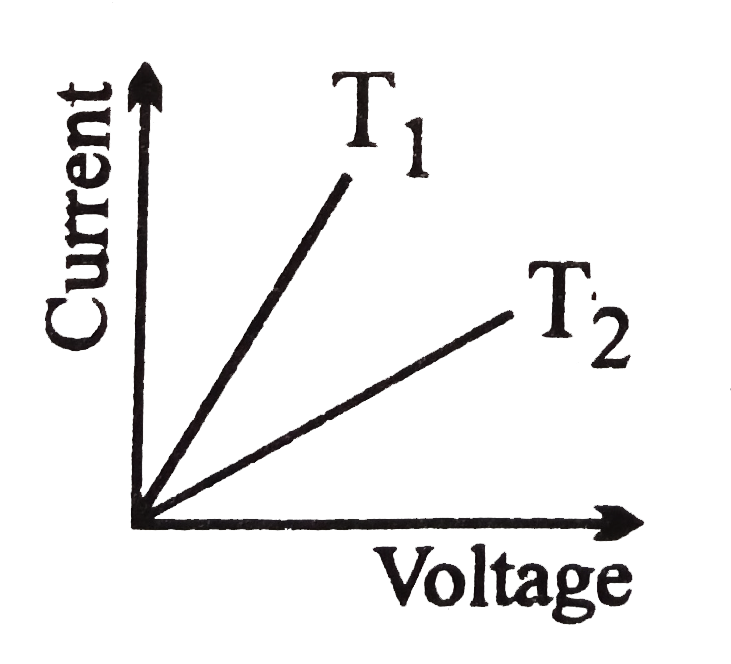
The voltage V and current I graph for a conductor at two different temperatures T1 and T2 are shown in the figure.
The relation between T1 and T2 is-

T1>T2
T1=T2
T1=T2
T1<T2
The correct Answer is:A
Since,
Slope of V- I graph gives resistances.
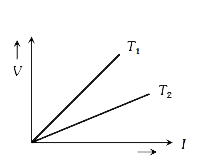
R1>R2
as T1>T2
Similar Questions
The current voltage graphs for a given metalic wire two different temperature T1 and T2 are shown in figure The temperature T2 is greater than T1. Is this statement true or false?
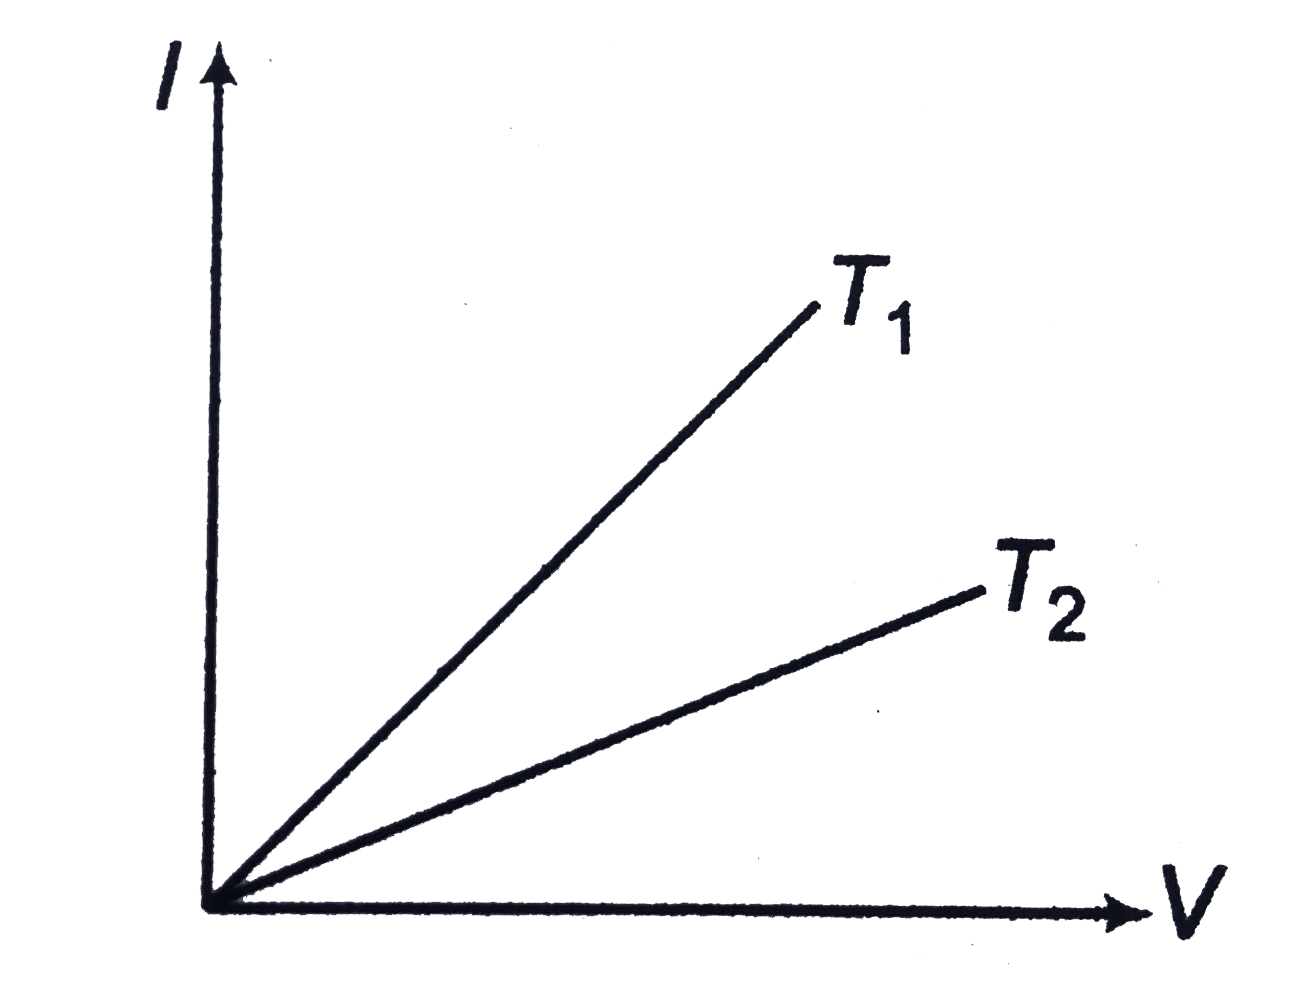 04:33View Solution
The VI graphs for a conductor at temperature T1 and T2 are shown in the figure
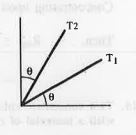 . Here (T2−T1) is proportional to06:07View Solution
The current voltage graph for a given metallic conductor at two different temperatures T1 and T2 are as shown in the figure
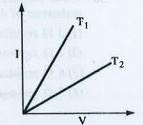 . Then05:32View Solution
The current voltage graphs for a given metalic wire two different temperature T1 and T2 are shown in figure The temperature T2 is greater than T1. Is this statement true or false?
 03:20View Solution
The current - voltage graphs for a given metallic wire at two different temperatures T_1 and T_2 are shown in the figure. The temperature T_2 is greater than T_1 .
03:02View SolutionThe current in a metallic conductor is plotted against voltage at two different temperatures T1 and T2. Which is correct
 02:10View Solution
The current - voltage graphs for a given metallic wire at two different temperatures T_1 and T_2 are shown in the figure. The temperature T_2 is greater than T_1 .
01:29View SolutionV-I graph for a mettalic wire at two different temperatures T1 and T2 is as shown in figure. WHich of the temperatures T1 and T2 is higher and why.
 02:15View Solution
