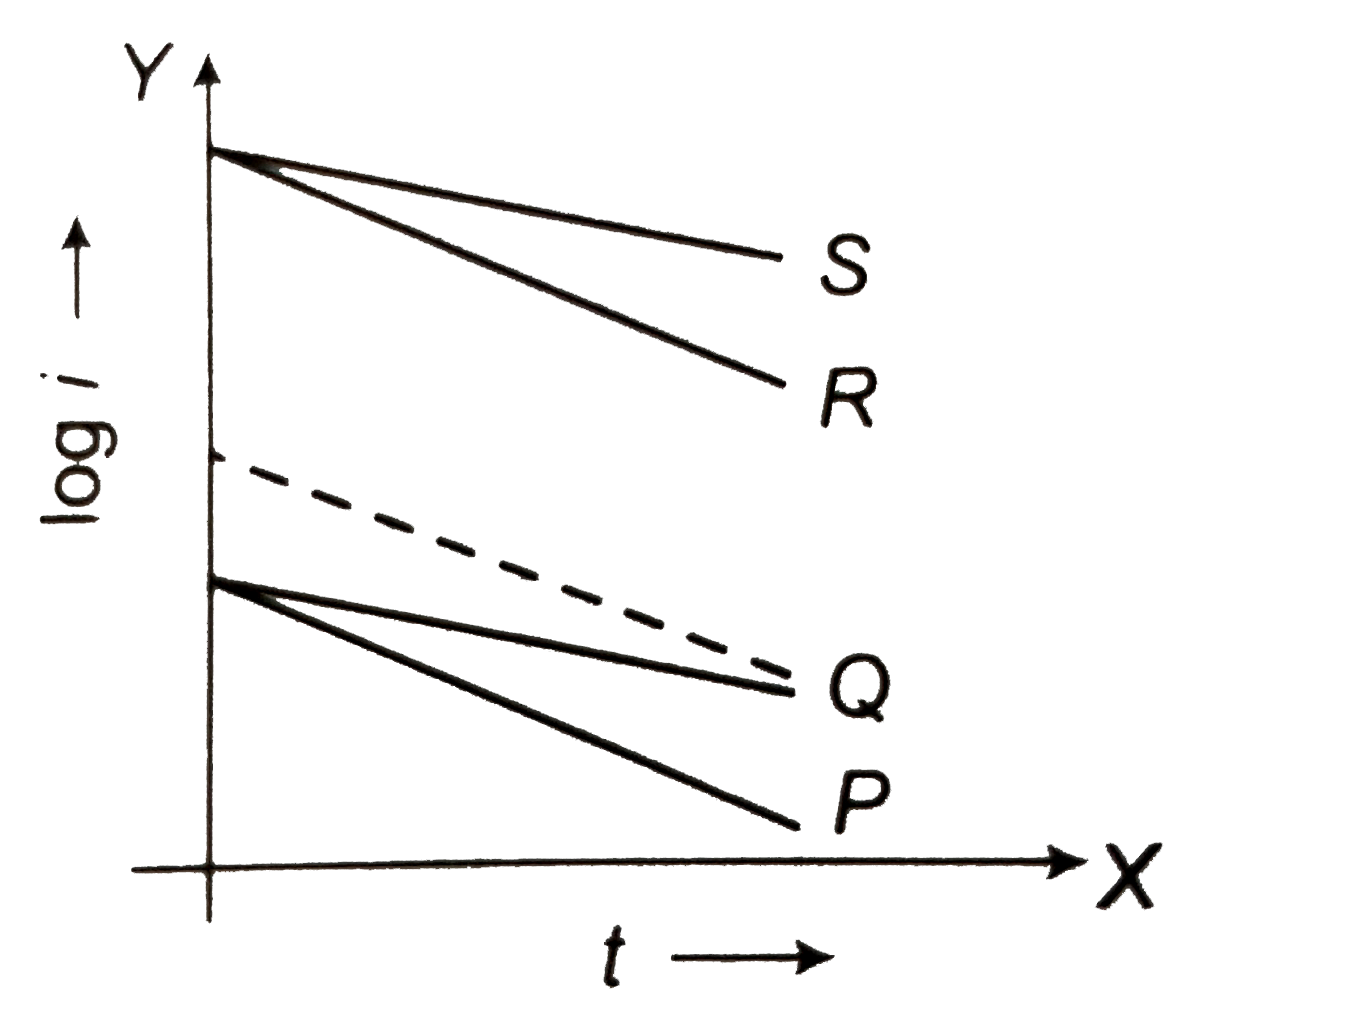
In an RC circuit while charging, the graph of 1ni versis time is as shown by the dotted line in the diagram figure. Where i is the current. When the value of the resistance is doubled, which of the solid curve best represents the variation of 1ni versus time

P
Q
R
S
The correct Answer is:B
i=ERe−t/RC⇒logi=−tRc+logeER
R→ double, slope of curve increase at t = 0, the current will be less for an increase value of resistance.
Similar Questions
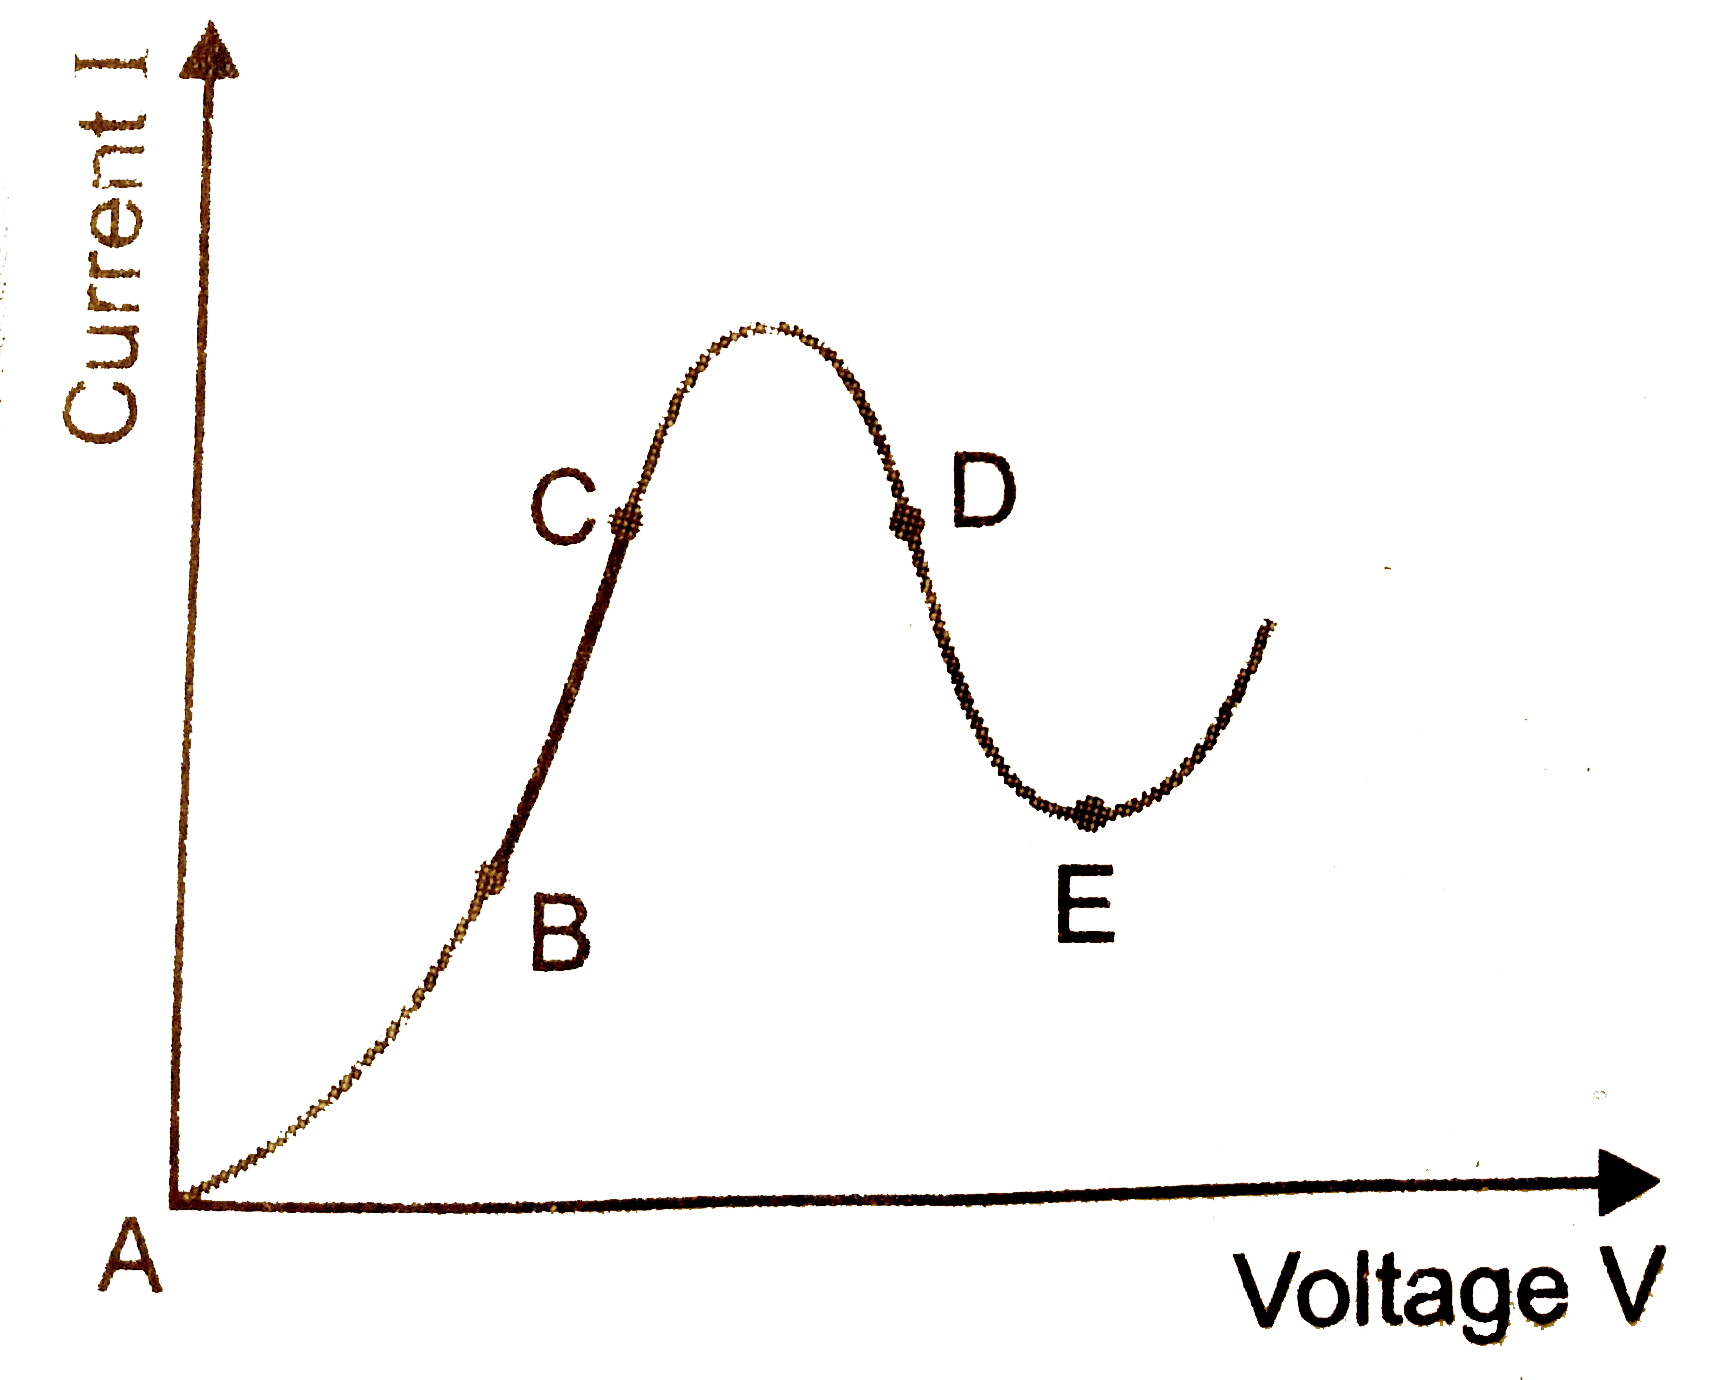
Graph showing the variation of current versus voltage for a material GaAs is shown in figure. Identify the region of (i) negative resistance (ii) where Ohm's law is obeyed.

View Solutionदिये गये चित्र में एक RC परिपथ के आवेशम (Charging ) के लिए i एवं समय के बीच का ग्राफ बिन्दुवत रेखा के द्वारा दर्शाया गया है, जहाँ i परिपथ की धारा हैं यदि परिपथ के प्रतिरोध को दुगना कर दिया जाये तो कौनसा ठोस वक्र उचित रूप से lni के परिवर्तन को समय के साथ दर्शाता है

View SolutionThe variation of current (I) and voltage (V) is as shown in figure. The variation of power P with currnet I is best shown by which of the following graph

View SolutionThe variation of current (I) and voltage (V) is as shown in figure A . The variation of power P with current I is best shown by which of the following graph
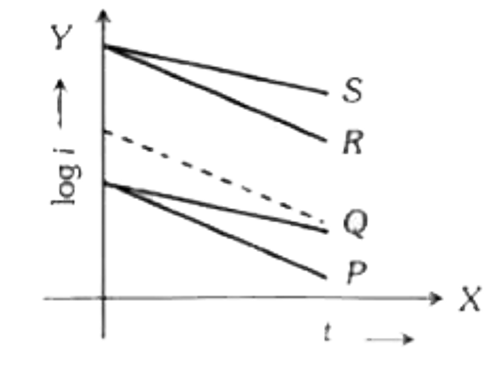
View SolutionA capacitor is charged using an external battery with a resistance x in series. The dashed line showns the variation of In I with respect to time. If the resistance is changed to 2x, the new graph will be
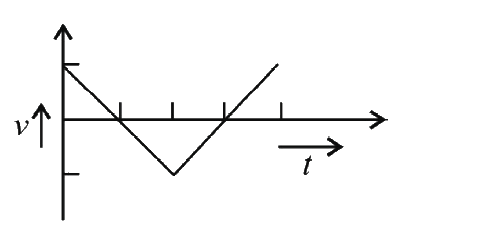
View SolutionThe graph in figure shows the velocity v versus time t for a body. Which of the graphs shown in figure represents the correesponding acceleration versus time graphs ?

View Solutionआरेख में दर्शाए गए विद्युत परिपथ के लिए धारा I का मान होगा

View Solutionकिसी प्रेरक में विद्युत धारा (I) समय के साथ आरेख में दर्शाये गये वक्र के अनुसार परिवर्तित होती है

तो, निम्नांकित में से कौन सा ग्राफ (आरेख) समय के साथ वोल्टता के सही परिवर्तन को दर्शाता है?
View Solution
