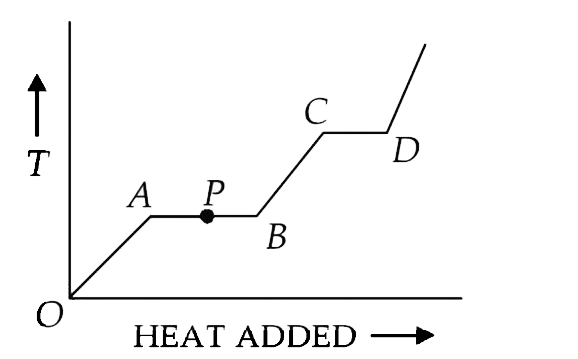
The graph shows the variation of temperature (T) of one kilogram of a material with the heat (H) supplied to it. At O, the substance is in the solid state. From the graph, we can conclude that

T2 is the melting point of the solid
BC represents the change of state from solid to liquid
(H2−H1) represents the latent heat of fusion of the substance
(H3−H1) represents the latent heat of vaporization of the liquid
The correct Answer is:C
(H2−H1)→ Latent heat of melting
(H4−H3)→Latent heat of vaporisation.
Similar Questions
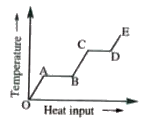
A source of heat supplies heat at a constant rate to a substance. Fig. shows the variation of temperature of the substance with the heat supplied. The slope of segment DE represents:

View Solution
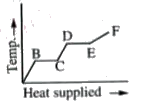
A source of heat supplies heat at a constant rate to solid cube. The variation of temperature of the . cube with heat supplied is shown
The portion DE of graph represents conversion of:
View SolutionA source of heat supplies heat at a constant rate to solid cube. The variation of temperature of the . cube with heat supplied is shown The reciprocal of the slope of the portion EF of the graph shown in figure represents:
View SolutionDraw a graph showing the variation of resistivity with temperature for a semiconductor.
View SolutionThe variation of temperature of a material as heat is given to it at a constant rate is shown in the figure. The material is in solid state at the point O. The state of the material at the point P is…..

View SolutionA substance initially in solid state at 0∘C is heated. The graph showing the variation in temperature with the amount of heat supplied is shown in Fig. 11.7. If the specific heat capacity of the solid substance is 500 J kg−1^∘C−1, use graph to find : (i) the mass of the substance, and (ii) the specific latent heat of fusion of the substance in the liquid state.
View SolutionThe variation of temperature of a material as heat is given to it at a constant rate is shown in the figure. The material is in solid state at the point O. The state of the material at the point P is…..

View SolutionThe correct graph which shows the variation of paramagnetic susceptibility S with temperature T is
View Solution
