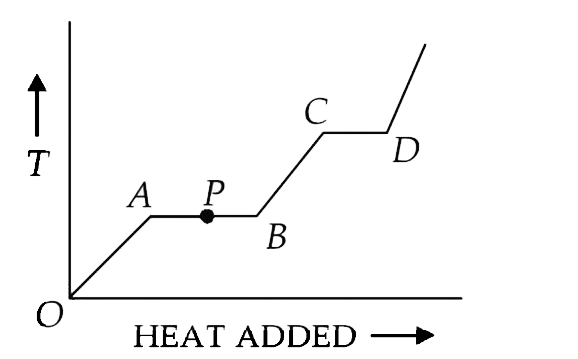
The graph shows the variation of temperature (T) of one kilogram of a material with the heat (H) supplied to it. At O, the substance is in the solid state. From the graph, we can conclude that

T2 is the melting point of the solid
BC represent the change of state from solid to liquid
(H2−H1) represent the latest heat of fusion of the subsatance
(H3−H1) represent the latest heat of vaporization of the liquid
The correct Answer is:C
Step by step video, text & image solution for The graph shows the variation of temperature (T) of one kilogram of a material with the heat (H) supplied to it. At O, the substance is in the solid state. From the graph, we can conclude that by Physics experts to help you in doubts & scoring excellent marks in Class 11 exams.
Updated on:21/07/2023Topper's Solved these Questions
Similar Questions
The variation of temprature of a material as heat is given to it at a constant rate is shown in the figure. The material is in solid state at the point O. The state of the material at the point P is…..
View Solution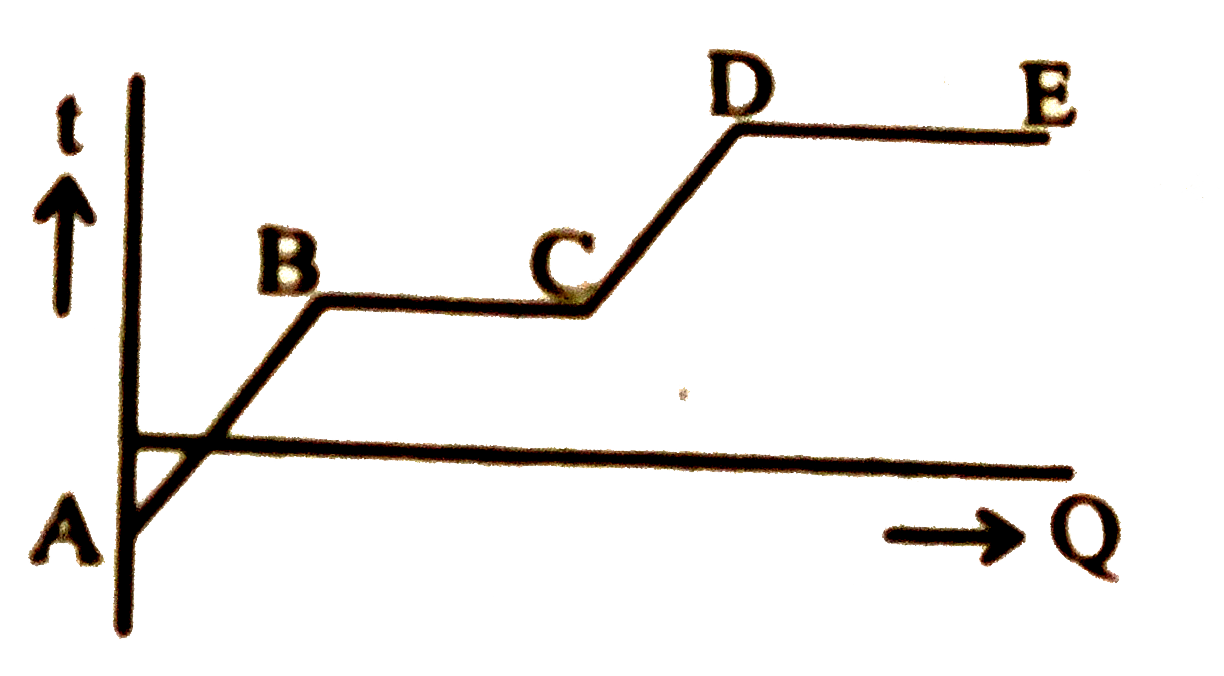
The graph given above indicates change in temperature (Δt) when heat (Q) was given to a substance. Which among the following parts of the graph correctly depict the latent heat of the substance?
View Solution
Knowledge Check
Figure shows the stress-strain curve of two metals P and Q. From the graph, it can be concluded that
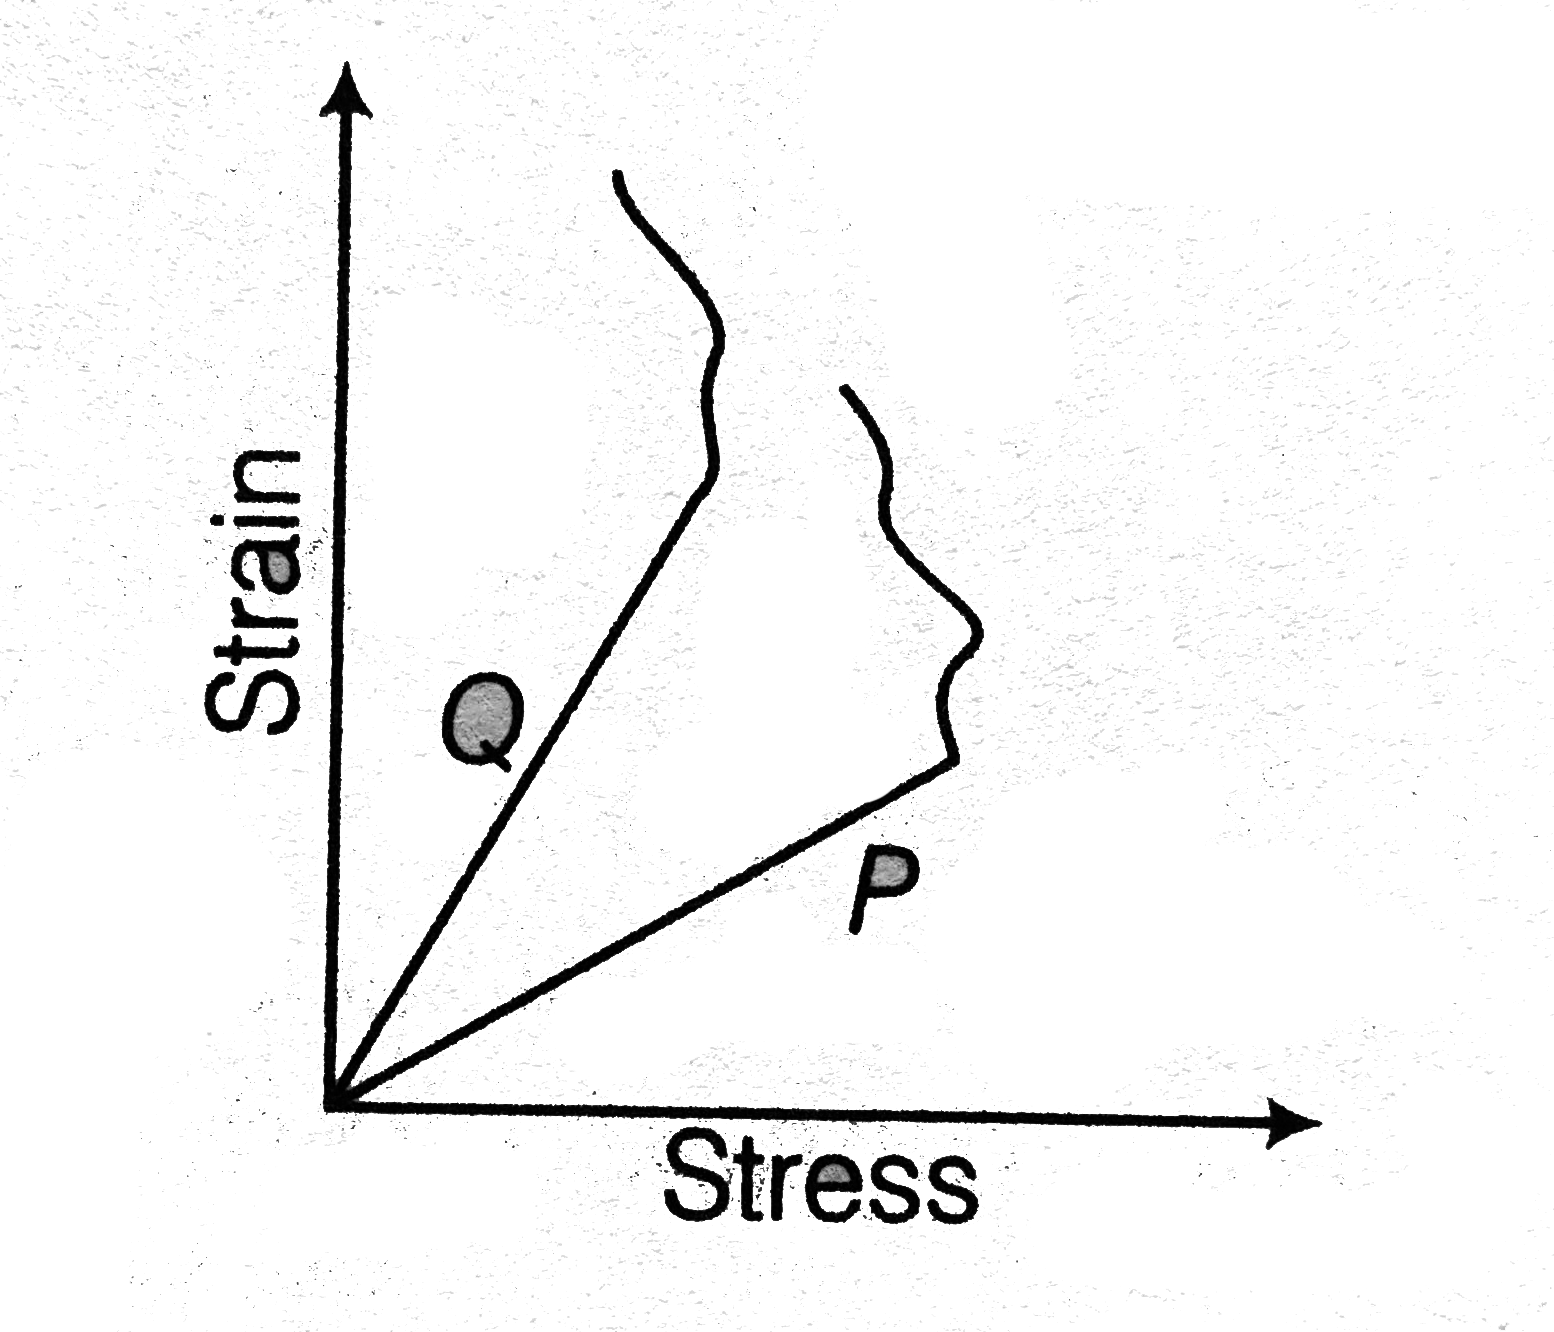 A(A) P has greater young's modulus and lesser ductilityB(B) Q has greater young's modulus and lesser ductilityC(C) P has greater young's modulus and greater ductilityD(D) Q has greater young's modulus and greater ductility
The correct graph which shows the variation of paramagnetic susceptibility S with temperature T is
A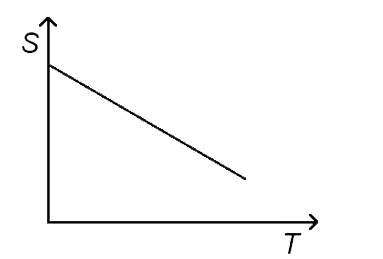 B
B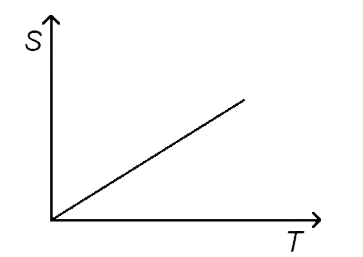 C
C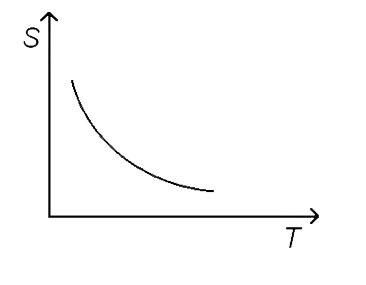 D
D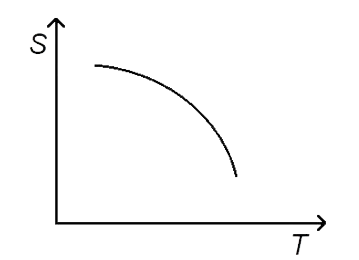
The graph shows the variation of displacement of a particle executing SHM with time . We infer from this graph that
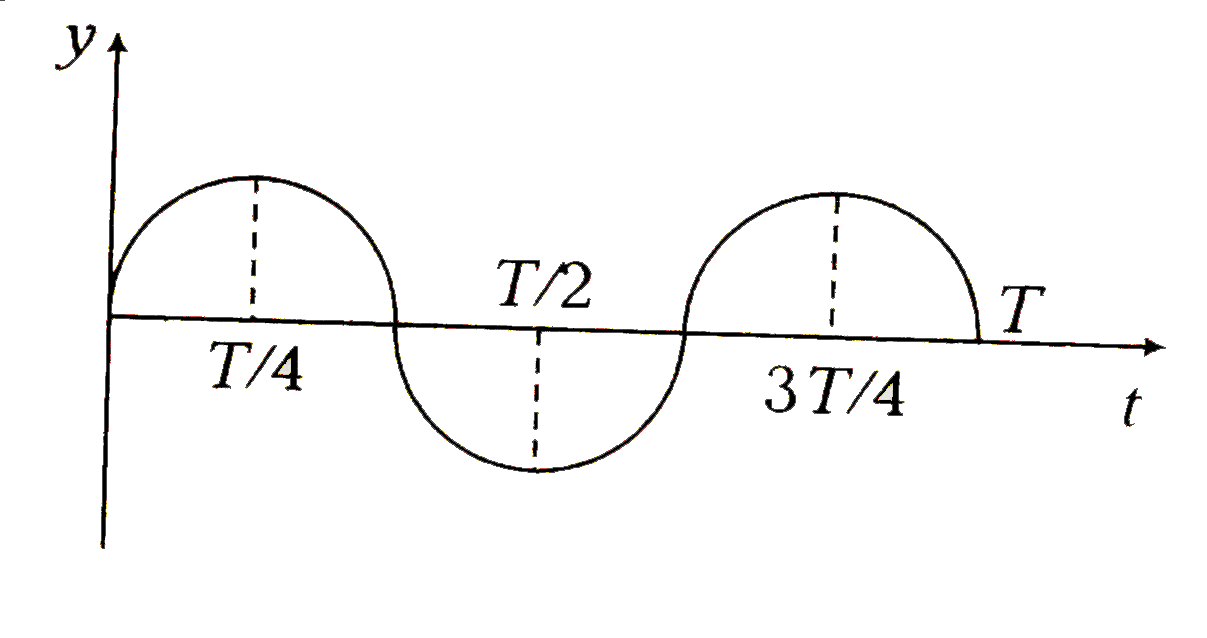 Athe force is zero at time 3T4Bthe velocity is maximum at time T2Cthe acceleration is maximum at time TDthe PE is equal to total energy at time T2
The given graph shows the heating curve for a pure substance. The temperature rises with time as the substance is heated :
(a) What is the physical state of the substance at the points A, B, C and D ?
What is the melting point of the substance ?
(c ) What is its boiling point ?
(d) What happens to the temperature while the substance is changing state ?
(e ) The substance is not water. How can you judge from the graph ?
View SolutionThe graph shows the variation of displacement of a particle executing S.H.M with time. We inference form this graph that :-
_E01_037_Q01.png)
View SolutionWhich one of the following graphs represents the variation of electric field with distance r from the centre of a charged spherical conductor of radius R?
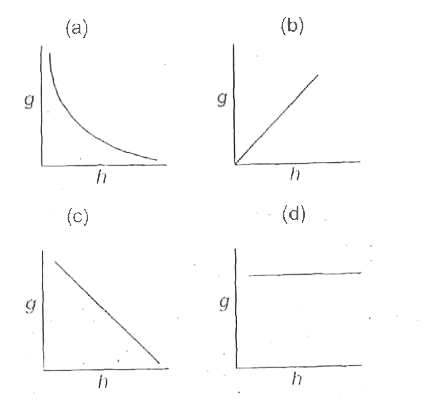
View SolutionWhich of the following graphs shows the variation of acceleration due to gravity g with depth h from the surface of the earth ?
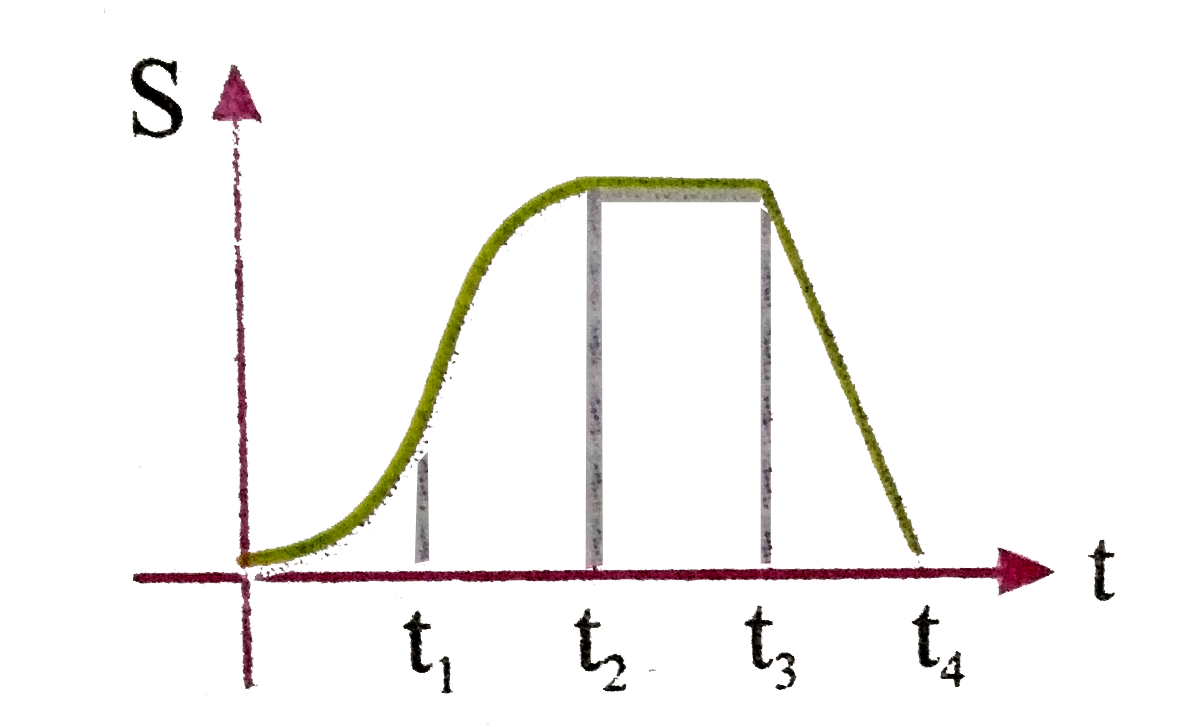
View SolutionDisplacement time graph of a particle moving in a straight line is as shown in figure.
From the graph we can conclude that work done on the block is :
 .
.
View Solution

