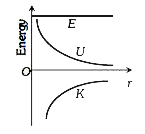
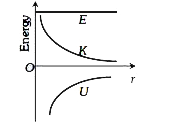
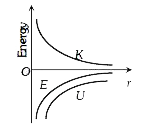
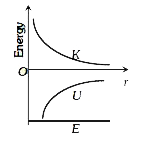
The correct graph representing the variation of total energy (Et), kinetic energy (Ek) and potential energy (U) of a satellite with its distance form the centre of earth is


The correct Answer is:C
U=−GMmr,U∝−1r
E=−GMm2r,E∝−12r
k=GMm2r,k∝12r
Similar Questions
The correct graph representing the variation of total energy (Et), kinetic energy (Ek) and potential energy (U) of a satellite with its distance form the centre of earth is
View Solutionएक उपग्रह की कुल ऊर्जा, गतिज ऊर्जा (K) तथा स्थितिज ऊर्जा (U) की पृथ्वी के केन्द्र से दूरी के साथ वृद्धि को निम्न ग्राफ से सही प्रकार प्रदर्शित किया जाता है
View SolutionAn artificial satellite moving in a circular orbit around the earth has a total energy E_(0) . Its potential energy is
View SolutionAn artificial satellite moving in a circular orbit at a distance h from the centre of the earth has a total energy E0. Its potential energy is
View SolutionThe correct graph representing the variation of total energy (E_(t)) , kinetic energy (E_(k)) and potential energy (U) of a satellite with its distance form the centre of earth is
View SolutionThe correct graph representing the variation of total energy (E) kinetic energy (K) and potential energy (U) of a satellite with its distance from the centre of earth is
View SolutionThe potential energy U(x) of a particle moving along x- axis is shown in figure. Which one of the following graphs represents the variation of kinetic energy of this particle if its total mechanical enery is E_(0)
View SolutionAn artificial satellite moving in a circular orbit around the earth has a total energy E_(0) . Its potential energy is
View Solution
