Direction: Study the table and answer the given question:
Table depicting literacy in 5 villages in 2011
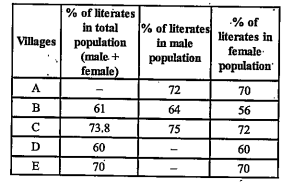
In village C, the number of females increased by 20% from 2011 to 2015. If the number of literate females was equal in 2011 and 2015, what percent of female population of village C was literate in 2015?
66
54
60
72
The correct Answer is:C
Step by step video, text & image solution for Direction: Study the table and answer the given question:Table depicting literacy in 5 villages in 2011In village C, the number of females increased by 20% from 2011 to 2015. If the number of literate females was equal in 2011 and 2015, what percent of female population of village C was literate in 2015? by Maths experts to help you in doubts & scoring excellent marks in Class 14 exams.
Similar Questions
The present population of a village is 5500. If the number of males increases by 11% and the number of females increases by 20% then the population will become 6330. What is the present population of females in the village?
View SolutionStudy the following table and answer questions: Number of employees working in five different companies.
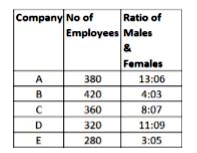
The number of female employees in company C is what percent more than the number of male employees in company E?View Solution
Knowledge Check
- Question 1 - Select One
The given Bar graph present the number of students from Science and Arts streams from a school in different years
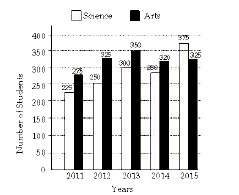
The average number of science students in 2011,2013 and 2015 is what percentage more than the number of Arts students in 2011?A1119%B9311%C9111%D819% - Question 2 - Select One
The table given below shows number of literate people and total population in a village from the year 2011 to 2016.

What is the percentage of people who are literate in 2012?A26.49B27.92C29.14D22.74 - Question 3 - Select One
Study the following table and answer the questions.
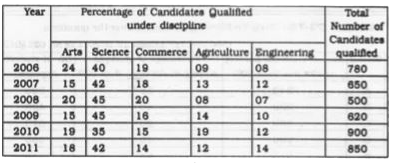
The decrease in the number of candidates qualified under Arts discipline from 2010 to 2011 wasA11B18C42D69
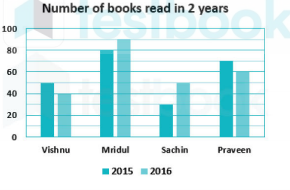
Directions: Read the bar graph carefully and answer the given questions.Books read by Praveen in the year 2015 is what percent more or less than the number of books read by Mridul in the year 2015 ?View SolutionThe bar chart given below shows the number of staff in colleges A and B from years 2011 to 2016.
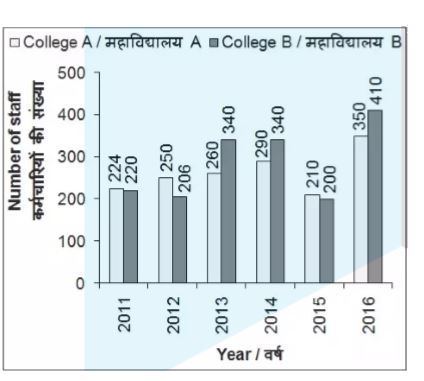
The number of staff in college A in year 2015 is how much percent more than the number of staff in college B in year 2015?View SolutionThe bar chart given below shows the number of staff in college A and B from years 2011 to 2016.
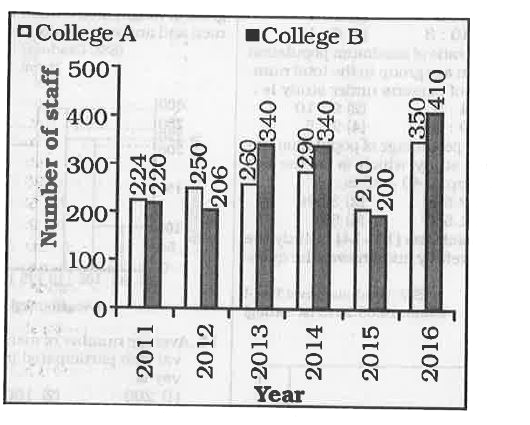
The number of staff in college A in year 2015 is how much per cent nmore than the number of staff in college B in year 2015?View SolutionStudy the following table and answer the questions.
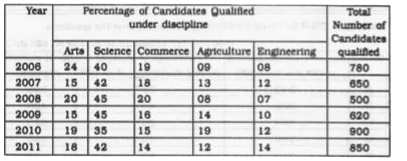
The difference in the average number of candidates qualified in Science discipline per year from 2006 to 2008 and the average number of candidates qualified in the same discipline from 2009 to 2011 wasView SolutionStudy the given table and answer the following question:
Annual consumption (in hundred tonnes) of tea in five states (A, B, C, D and E) across 6 years (2014 to 2019):

The total consumption of tea in state C in 2015 to 2017 is by what percentage more than the total consumption of tea in states A, B and D in 2015?View Solution
