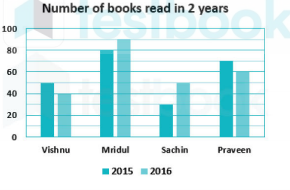
Directions: Read the bar graph carefully and answer the given questions.Books read by Praveen in the year 2015 is what percent more or less than the number of books read by
Mridul in the year 2015 ?
0.15
0.1
0.125
0.4
Step by step video & image solution for Directions: Read the bar graph carefully and answer the given questions.Books read by Praveen in the year 2015 is what percent more or less than the number of books read by Mridul in the year 2015 ? by Maths experts to help you in doubts & scoring excellent marks in Class 14 exams.
Updated on:21/07/2023Similar Questions
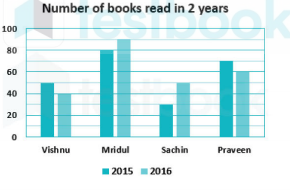
Directions: Read the bar graph carefully and answer the given questions.Total number of books read by Sachin and Mridul in both the years is how much more or less than the total number of books read by Praveen and Vishnu in both the years?
View Solution.
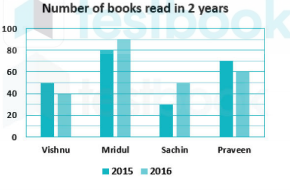
Directions: Read the bar graph carefully and answer the given questions.What is the sum of all the books read by all of them in both the years ?
View Solution
Knowledge Check
Study the following graph carefully and answer the questions that
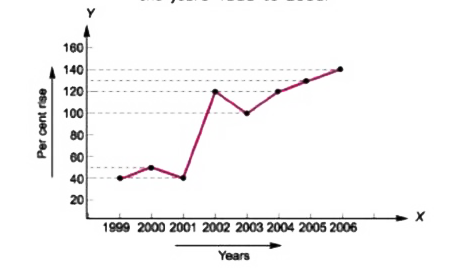
For how many years , the percent rise was more than 100 % ?AOneBTwoCThreeDNone of these
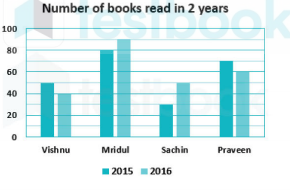
Directions: Read the bar graph carefully and answer the given questions.What is the average of total number of books read by all of them in the year 2016?
View Solution.
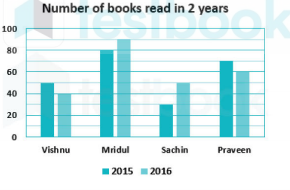
Directions: Read the bar graph carefully and answer the given questionsFind the ratio of sum of number of books read by Vishnu and Mridul together in 2015 to the sum of number of books read by Sachin and Praveen together in 2015.
View SolutionRead the bar graph and answer the following questons.
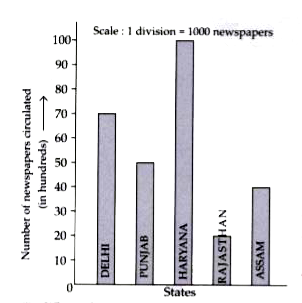
What information is given by graph ?
View SolutionStudy the following bar graph carefully to answer the questions.
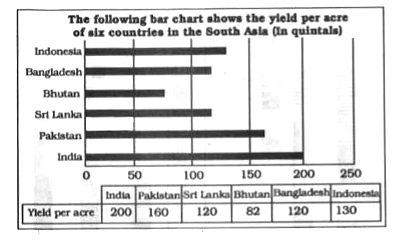
The yield per acre of India is what percent more than that of Pakistan?
View SolutionRead the following graph carefully and answer the questions given below:
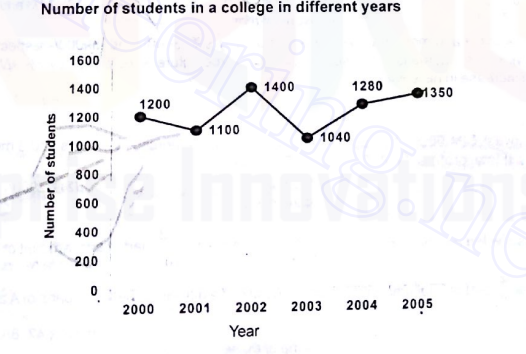
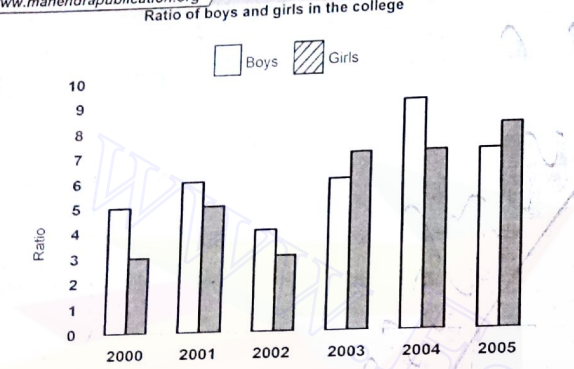
What is the average number of girls in all the years?
View SolutionRead the following graph carefully and answer the questions given below:


In which two years the number of girls is equal ?
View SolutionRead the bar graph given below and answer the following questions:

In which year is the number of students maximum?
View Solution
