Two different isotherms representing the relationship between pressure p and volume V at a given temperature of the same ideal gas are shown for masses m1 and m2 then
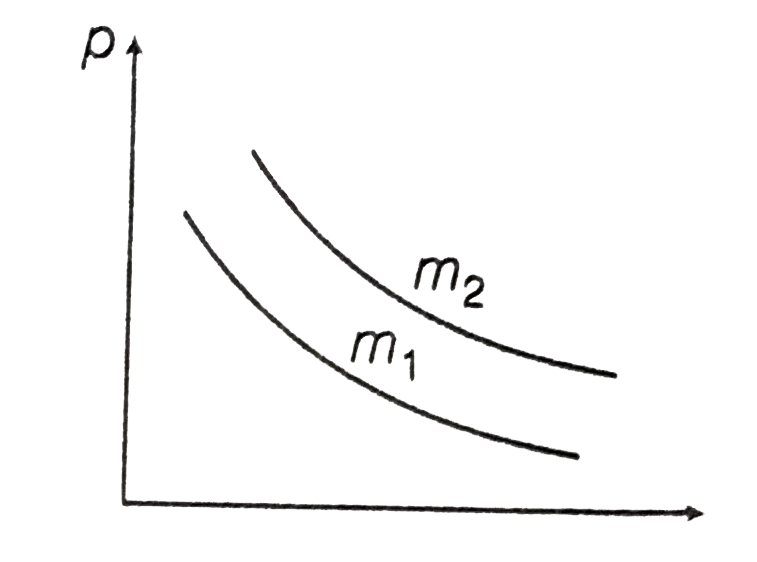
m1>m2
m1=m2
m1<m2
m1><m2
The correct Answer is:C
PV=mMRT
For 1st graph, P=m1MRTV1
For 2nd graph, P=m2MRTV2
m1m2=V1V2⇒m∝V
As V2>V1⇒m1<m2
Topper's Solved these Questions
- KINETIC THEORY OF GASES Book:ERRORLESSChapter:KINETIC THEORY OF GASES Exercise:NCERT BASED QUESTIONS (Speed of Gas)
Explore 24 Videos
- KINETIC THEORY OF GASES Book:ERRORLESSChapter:KINETIC THEORY OF GASES Exercise:NCERT BASED QUESTIONS (Degree of Freedom and Specific Heat)
Explore 30 Videos
- GRAVITATIONBook:ERRORLESSChapter:GRAVITATIONExercise:Assertion and Reason
Explore 25 Videos
- MOTION IN ONE DIMENSIONBook:ERRORLESSChapter:MOTION IN ONE DIMENSIONExercise:ASSERTION AND REASON
Explore 24 Videos
Similar Questions
Knowledge Check
Two different masses m and 3m of an ideal gas are heated separately in a vessel of constant volume, the pressure P and absolute temperature T, graphs for these two cases are shown in the figure as A and B. The ratio of slopes of curves B to A is
 A3:1B1:3C9:1D1:9
An ideal gas in thermally insulated vessel at internal (pressure)=P1,(volume)=V1 and absolute temperature=T1 expands irreversiby against zero external, pressure , as shown in the diagram,
The final internal pressure, volume and absolute temperature of the gas are p2,V2andT2, respectively . For this expansion
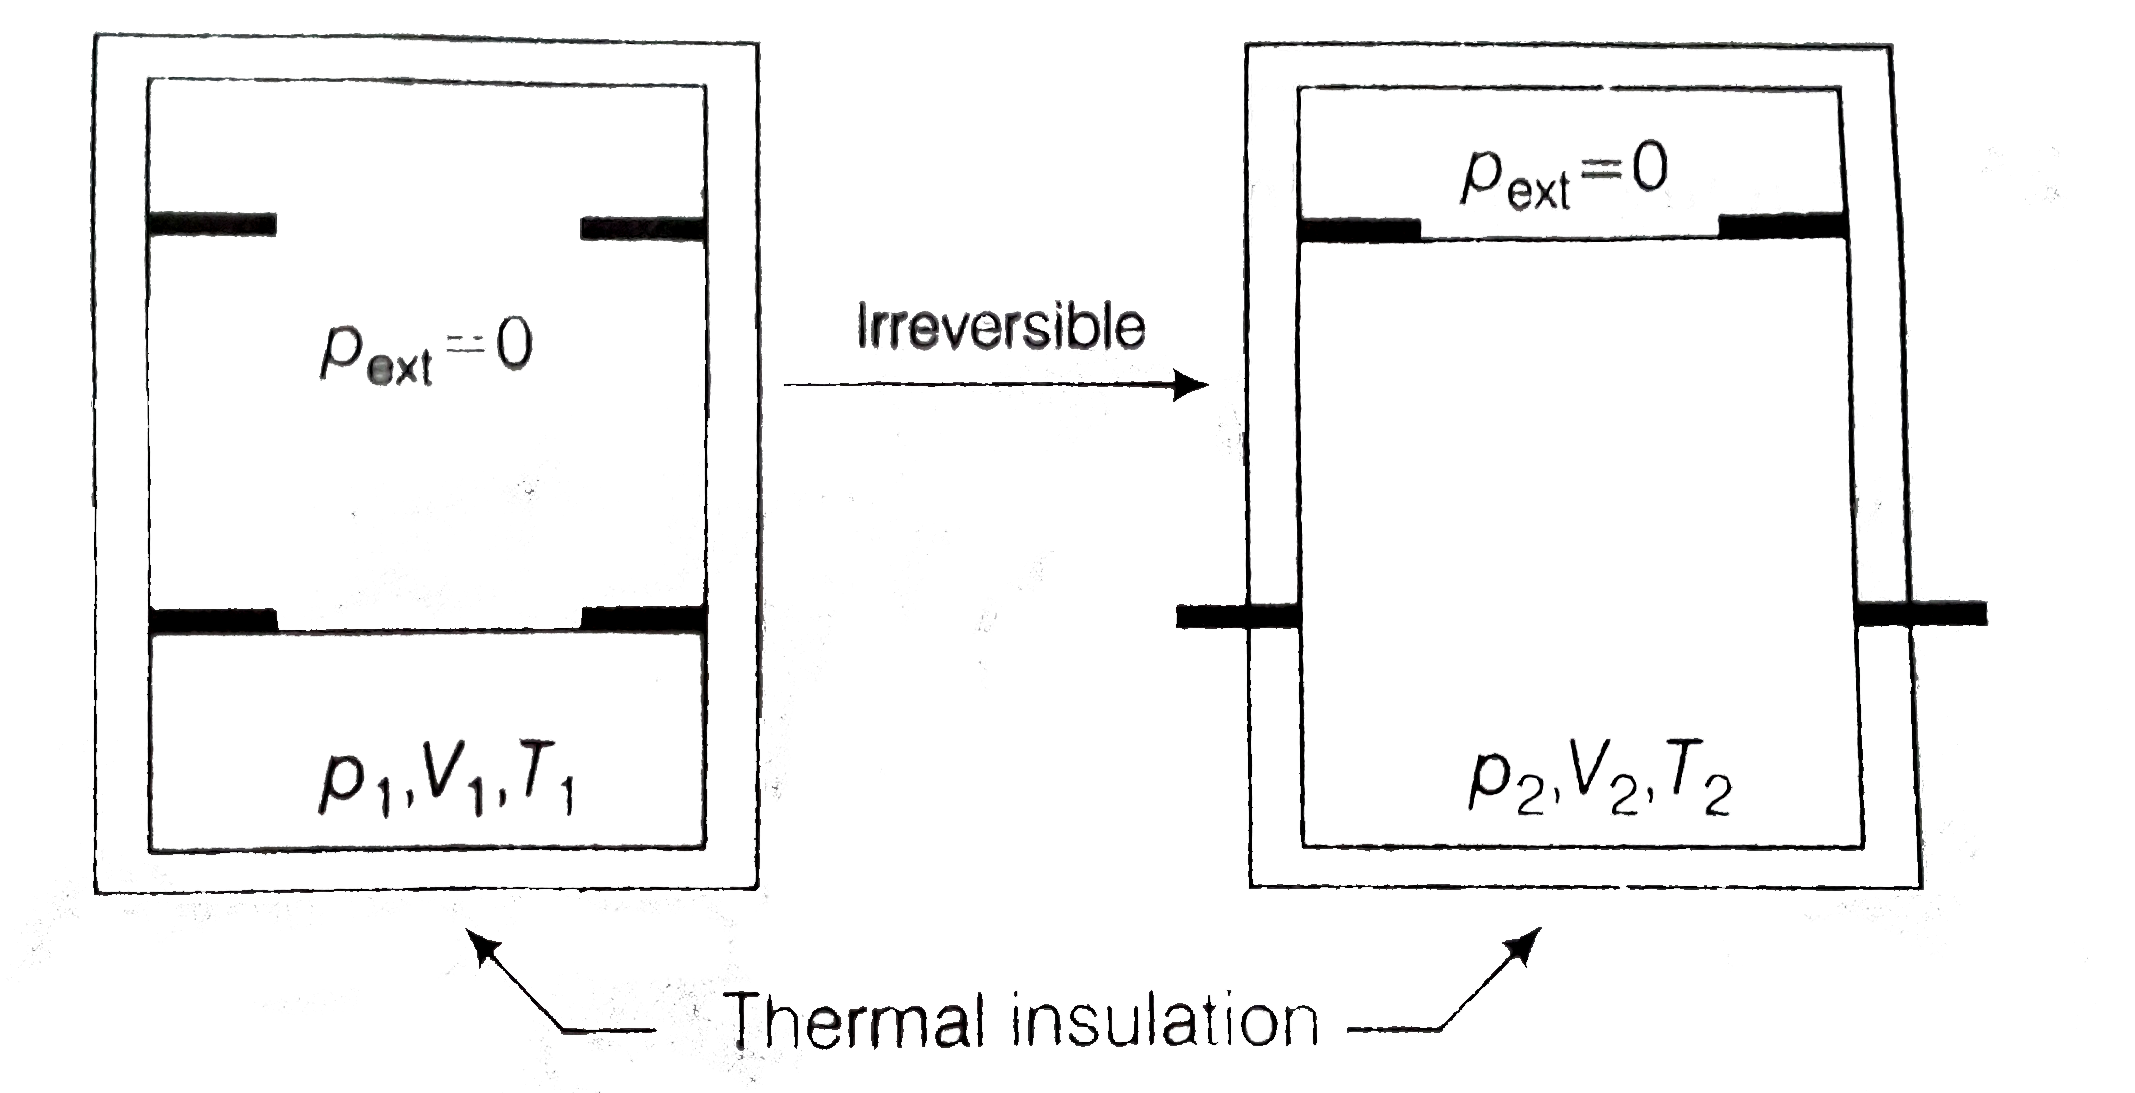 Aq=0BT2=T1Cp2V2=p1V1DP2Vγ2=P1Vγ2
An ideal gas in a thermally insulated vessel at internal pressure =P1, volume =V1 and absolute temperature =T1 expands irreversibly against zero external pressure, as shown in the diagram. The final internal pressure, volume and absolute temperature of the gas are P2,V2 and T2 respectively. For this expansion.
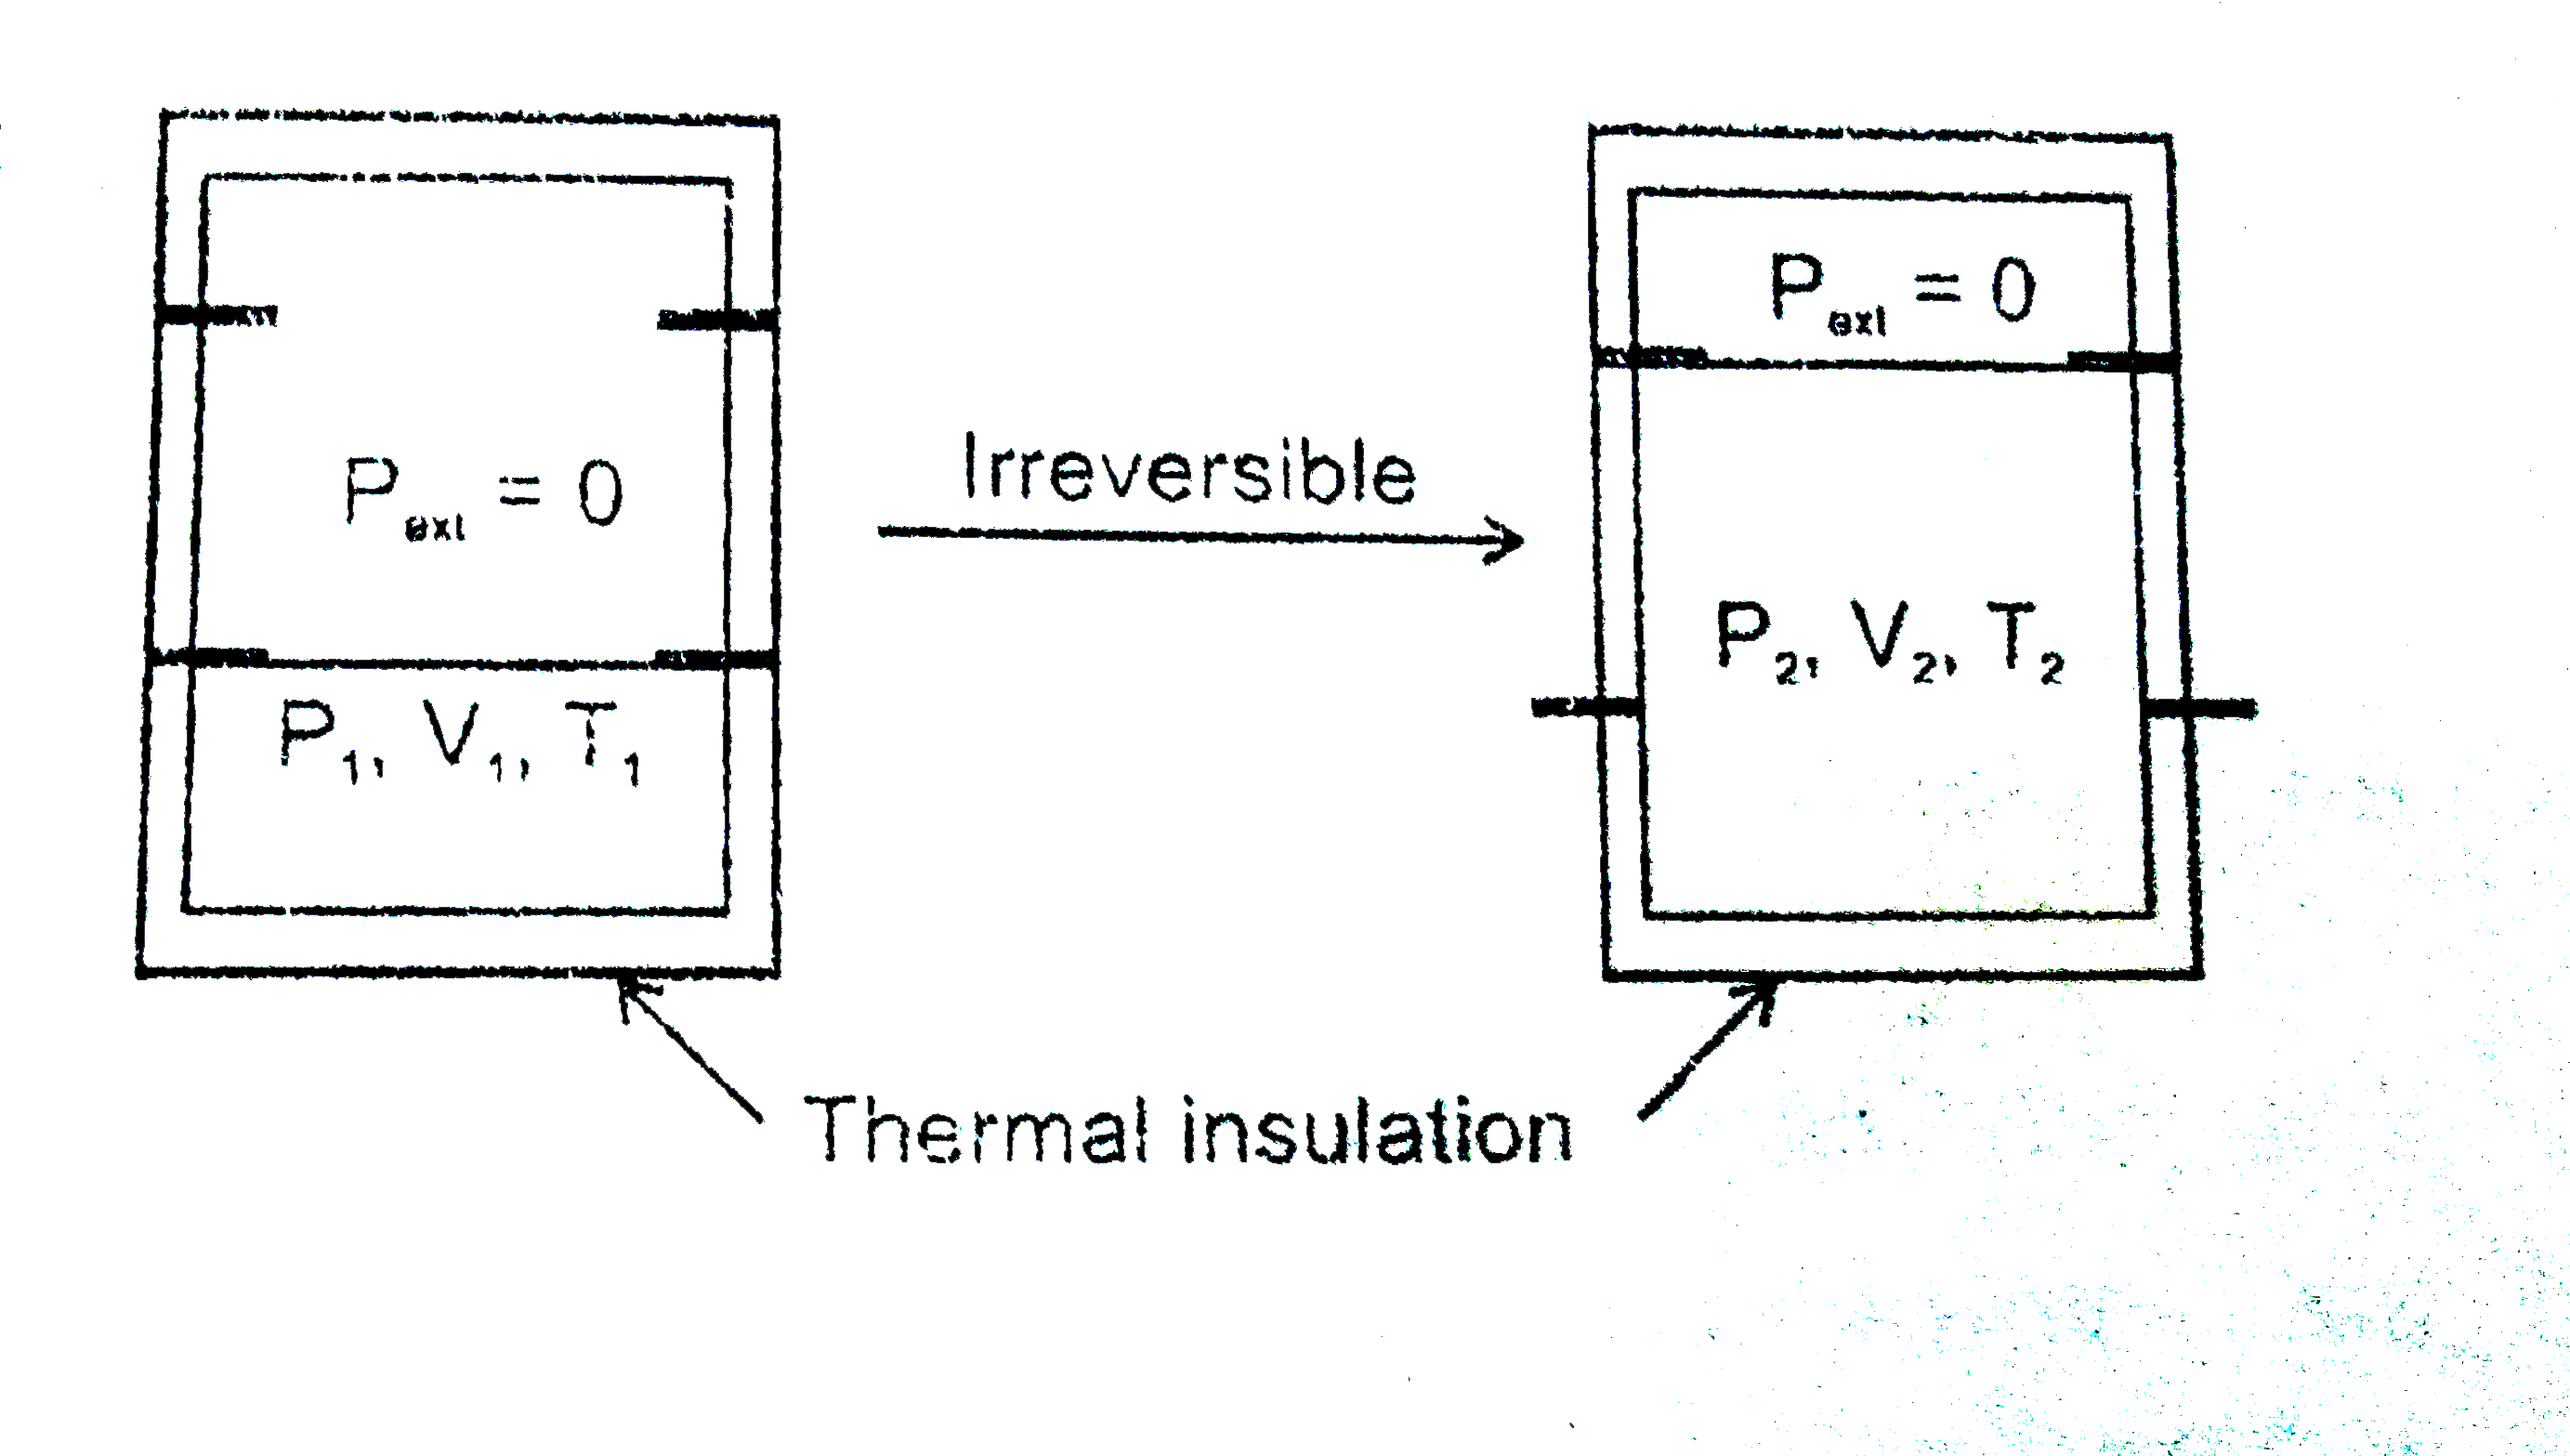 Aq=0BT2=T1CP2V2=PtV1DP2Vγ2=P1Vγ1
What is the nature of graph between pressure (P) and volume(V)for a given mass of a gas at a fixed temperature ?
View SolutionGraph between pressure and volume are plotted at different temperature. Which of the following isotherms represent Boyle's law as PV = constant?
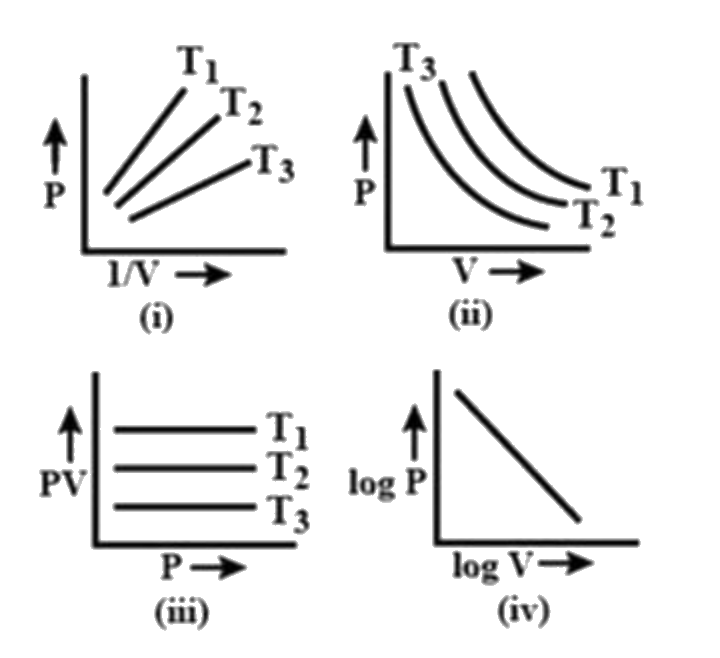
View SolutionOne of the important approach to the study of real gases involves the analysis of parameter Z called the compressibility factor Z=PVmRT where P is pressure, Vm is molar volume, T is absolute temperature and R is the universal gas constant. such a relation can also be expressed as Z=(VmrealVmal) (where Vmal and Vmreal are the molar volume for ideal and real gas respectively). Gas corresponding Z<1 have attractive forces amoung constituent particles. As the pressure is lowered or temperature is increased the value of Z approaches 1. (reaching the ideal behaviour)
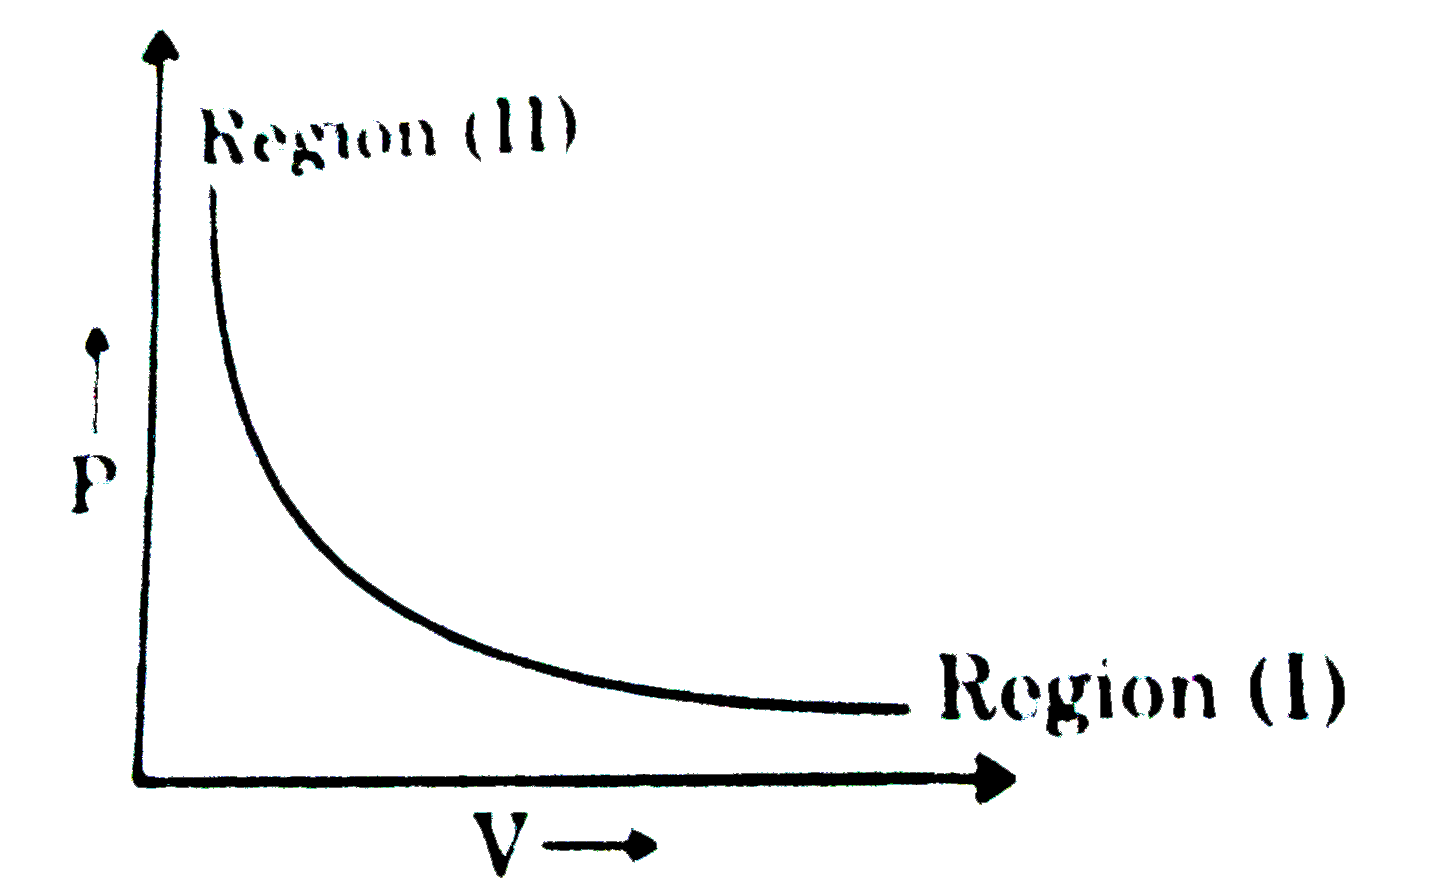
Following graph represents a pressure (P) volume (V) relationship at a fixed temperature (T) for n moles of a real gas. The graph has two regions marked (I) and (II). Which of the following options is true.

View SolutionOne of the important approach of the study of real gases involves the analysis of a parameter Z called the compressibility factor Z=PVmRT where P is pressure, Vm is molar volume ,T is absolute temperature and R is the universal gas constant .Such a relation can also be expressed as Z=(V m realVm ideal) (where Vm ideal and V_("m real") are the moler volume for ideal and real gas respectively tendencies among constituent particles.As pressure is force among is lowered or temperature is increased the value of Z approaches ideal behaviour
Following graph represents a pressure (P) volume (V) relationship at a fixed temperature (T) for moles of a real gas.The graph has two regions masked (I) and (II). Which of the folloing option true ?
View SolutionThe P−T graph for the given mass of an ideal gas is shown in figure. Then the volume
_E01_022_Q01.png)
View Solution