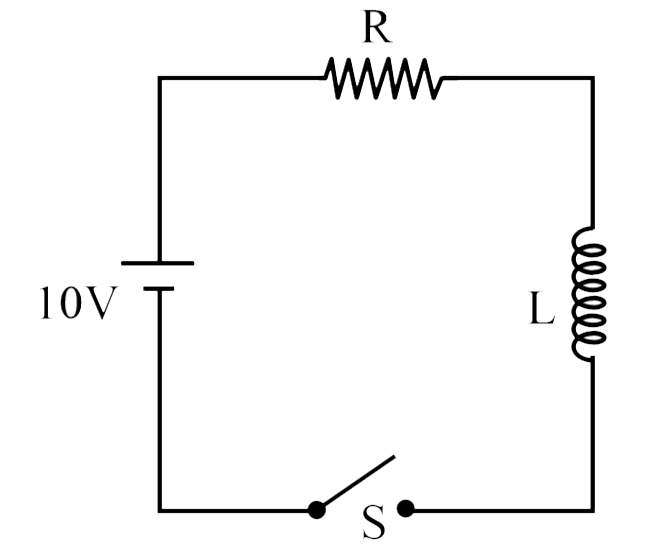
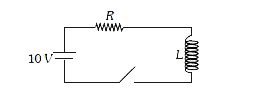
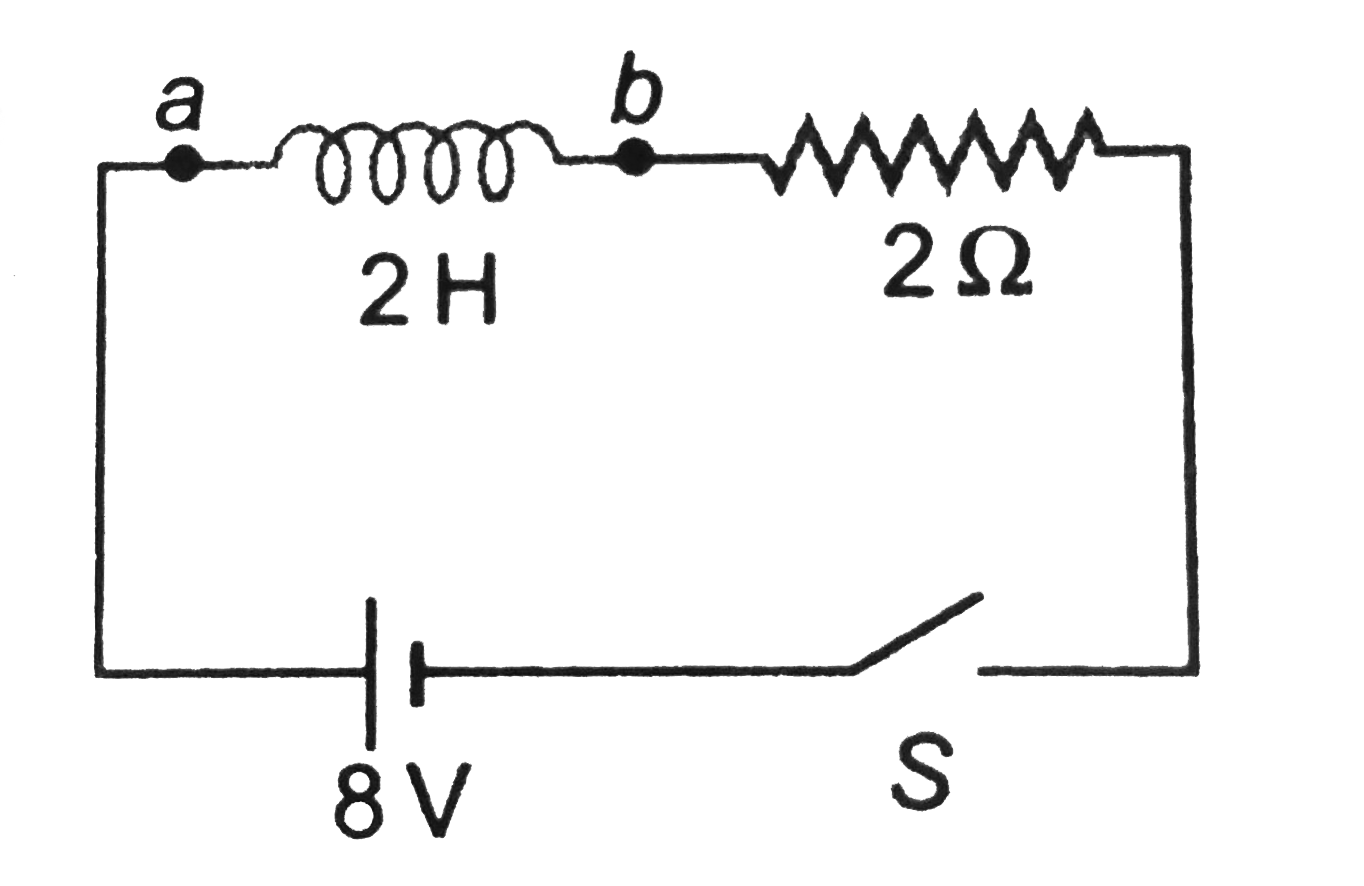
In the circuit shown, the switch is closed at time t = 0.
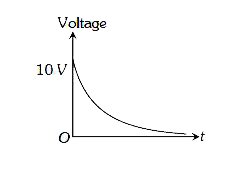
Which of the graphs shown below best represents the voltage across the inductor, as seen on an oscilloscope ?

A
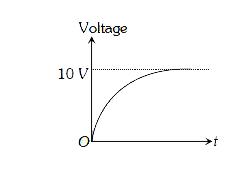
B
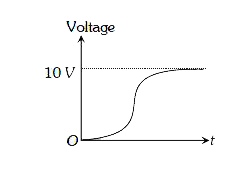
C
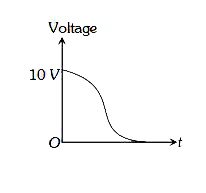
D
Video Solution
Text Solution
The correct Answer is:D
|e|=VRe−RL×t
|
Topper's Solved these Questions
- ELECTROMAGNETIC INDUCTIONBook:ERRORLESSChapter:ELECTROMAGNETIC INDUCTIONExercise:NCERT BASED QUESTIONS (APPLICATION OF EMI (Dynamo, Transformer…))
Explore 20 Videos
- ELECTROMAGNETIC INDUCTIONBook:ERRORLESSChapter:ELECTROMAGNETIC INDUCTIONExercise:PAST YEARS QUESTIONS
Explore 31 Videos
- ELECTROMAGNETIC INDUCTIONBook:ERRORLESSChapter:ELECTROMAGNETIC INDUCTIONExercise:NCERT BASED QUESTIONS (Motional EMI)
Explore 25 Videos
- CURRENT ELECTRICITYBook:ERRORLESSChapter:CURRENT ELECTRICITYExercise:ASSERTION AND REASON
Explore 26 Videos
- ELECTRON, PHOTON, PHOTOELECTRIC EFFECT & X -RAYBook:ERRORLESSChapter:ELECTRON, PHOTON, PHOTOELECTRIC EFFECT & X -RAYExercise:ASSERTION & REASON
Explore 27 Videos
Similar Questions
Knowledge Check
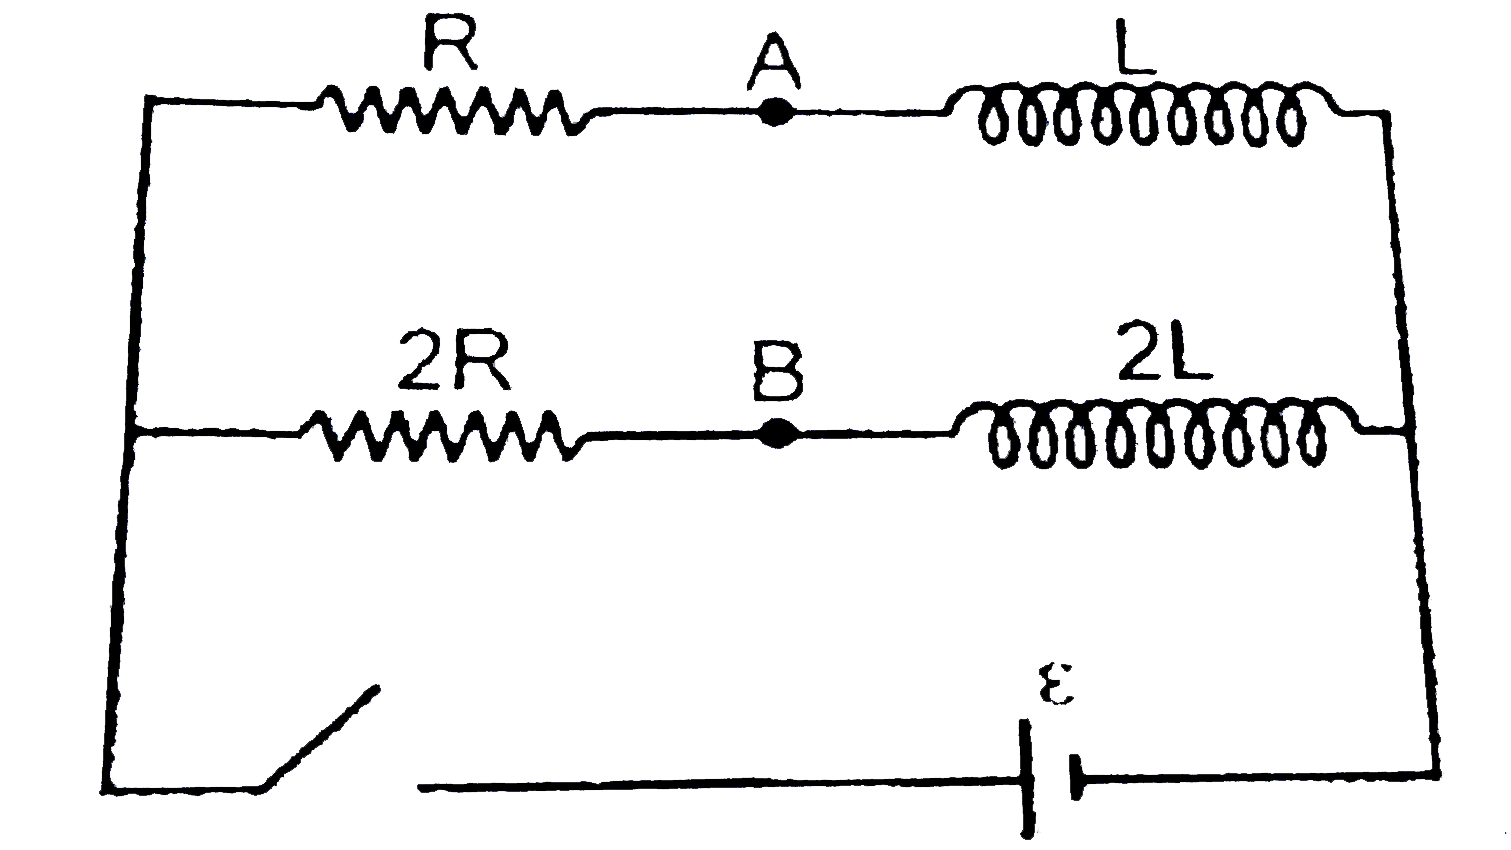
In given LR circuit the switch S is closed at time t=0 thenAThe ratio of induced emfs in the inductors of inductance L and 2L will be constantBThe ratio of induced emfs in the inductor of inductance L and 2L will be time varyingCthe potential difference VA−VB increases with timeDThe potential difference VA−VB will be constant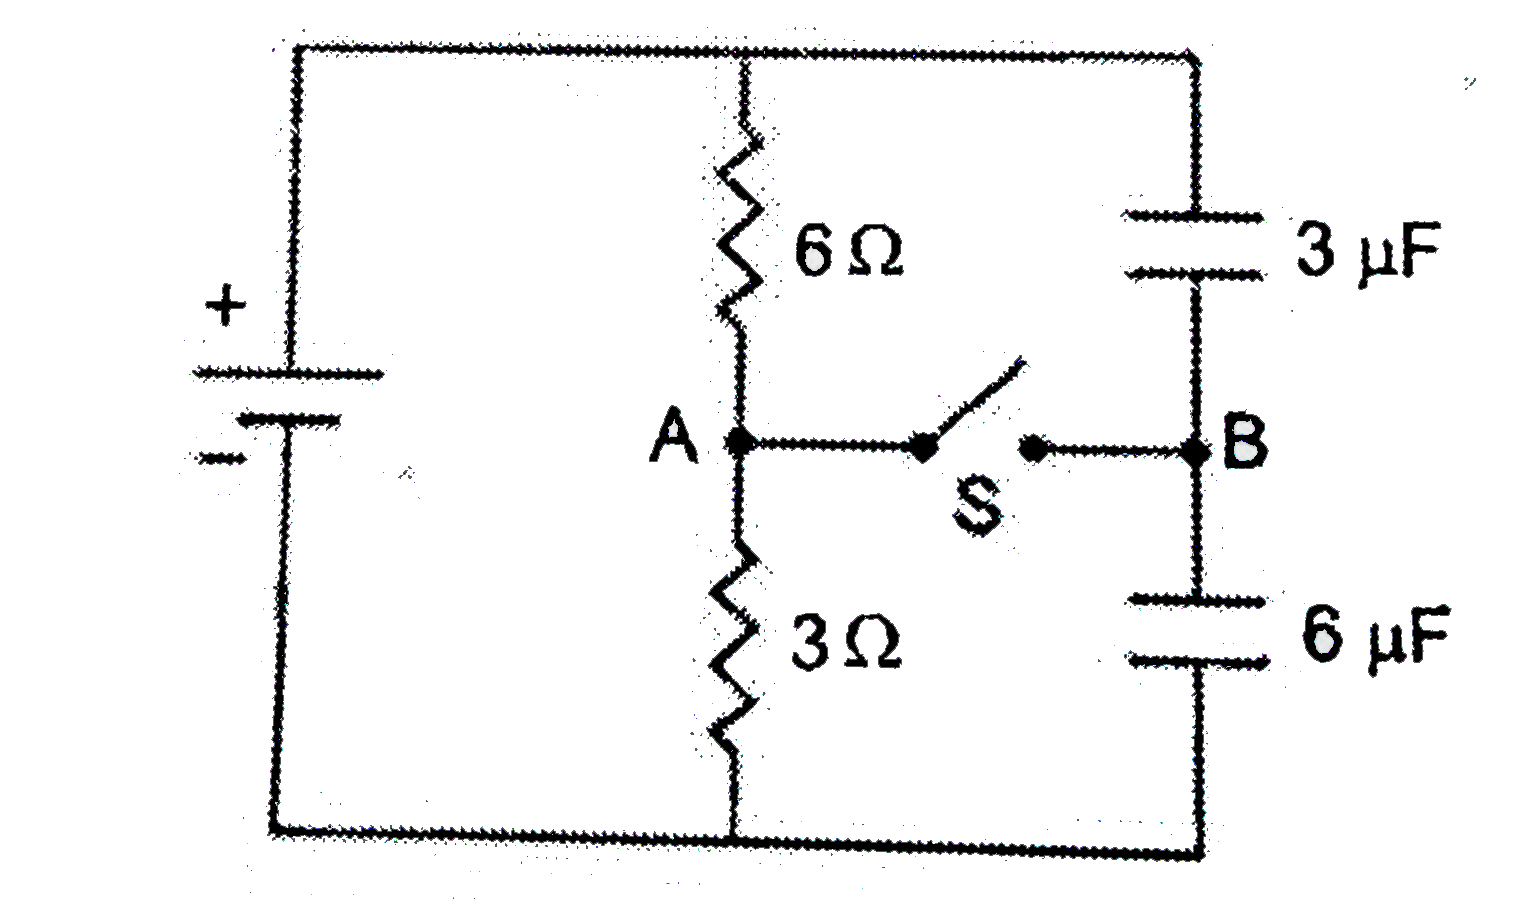
In the circuit shown above, when then switch S is closed,Ano charge flows through SBcharge flows from A to BCcharge flows from B to ADcharge flows initially from A to B and later from B to AIn the circuit shown, the switch is closed at t=0, the currents I1,I2 and I3 are
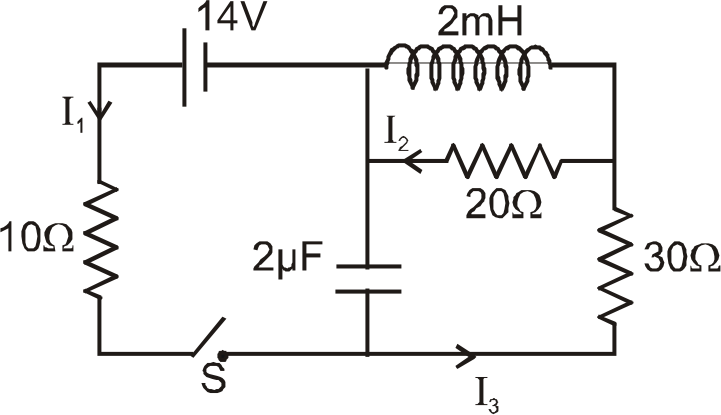 A1.4A,0,0B1.4 A,0.70 A,0.70 AC0,0,0D1.2A,0.6A,0.6A
In the circuit shown in the figure, switch S is closed at time t=0. Select the correct statements.
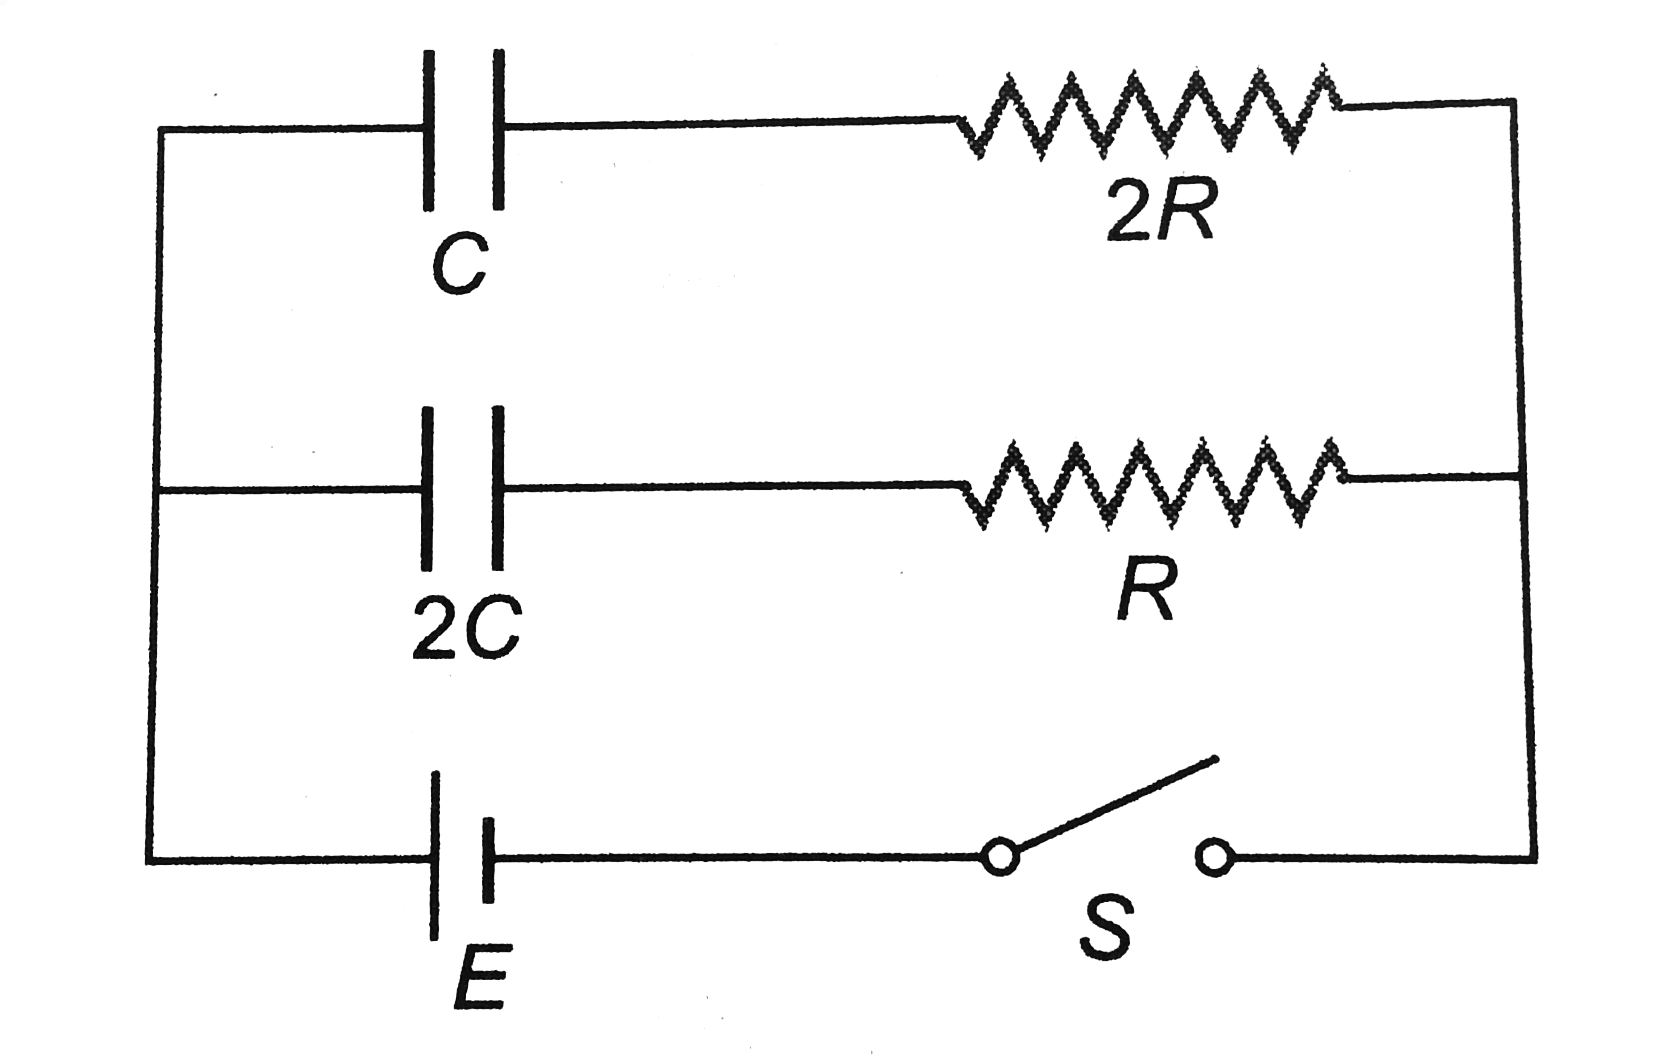
View SolutionIn the circuit as shown in figure the switch is closed at t=0.
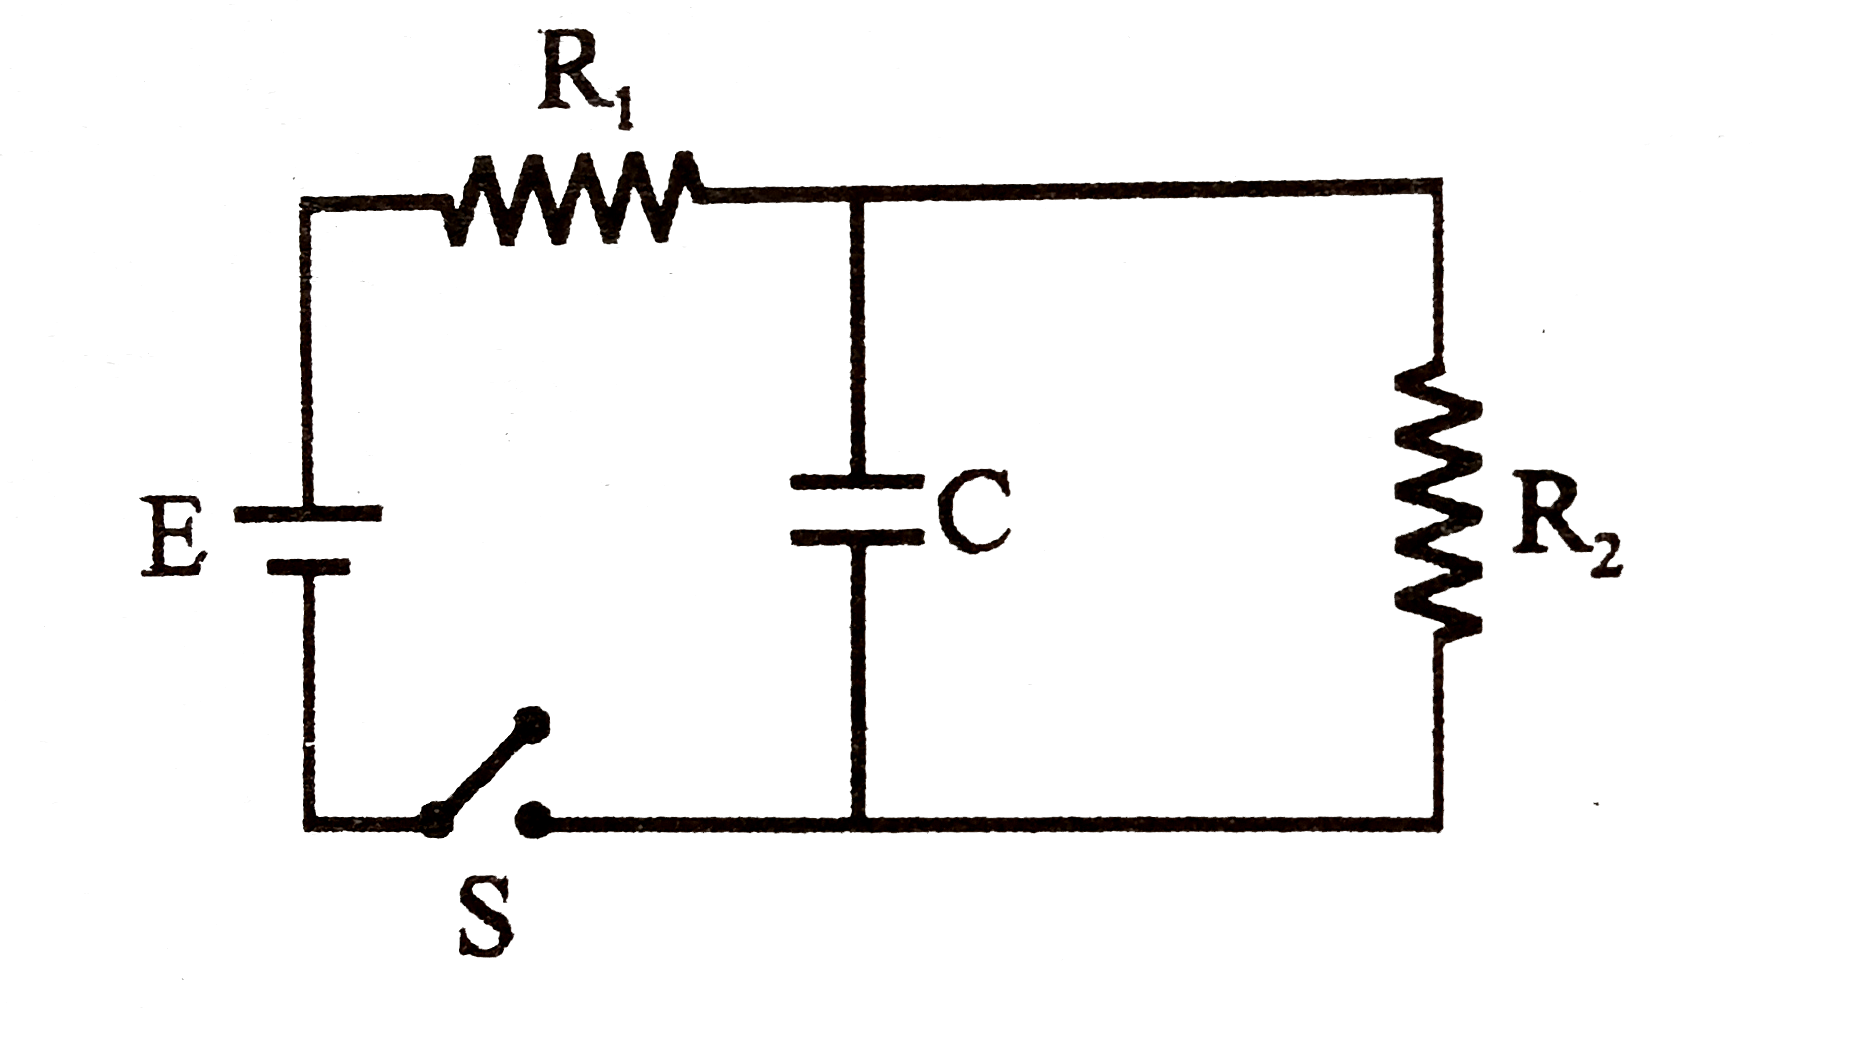
At the instant of closing the switch
View SolutionIn the circuit as shown in figure the switch is closed at t=0.
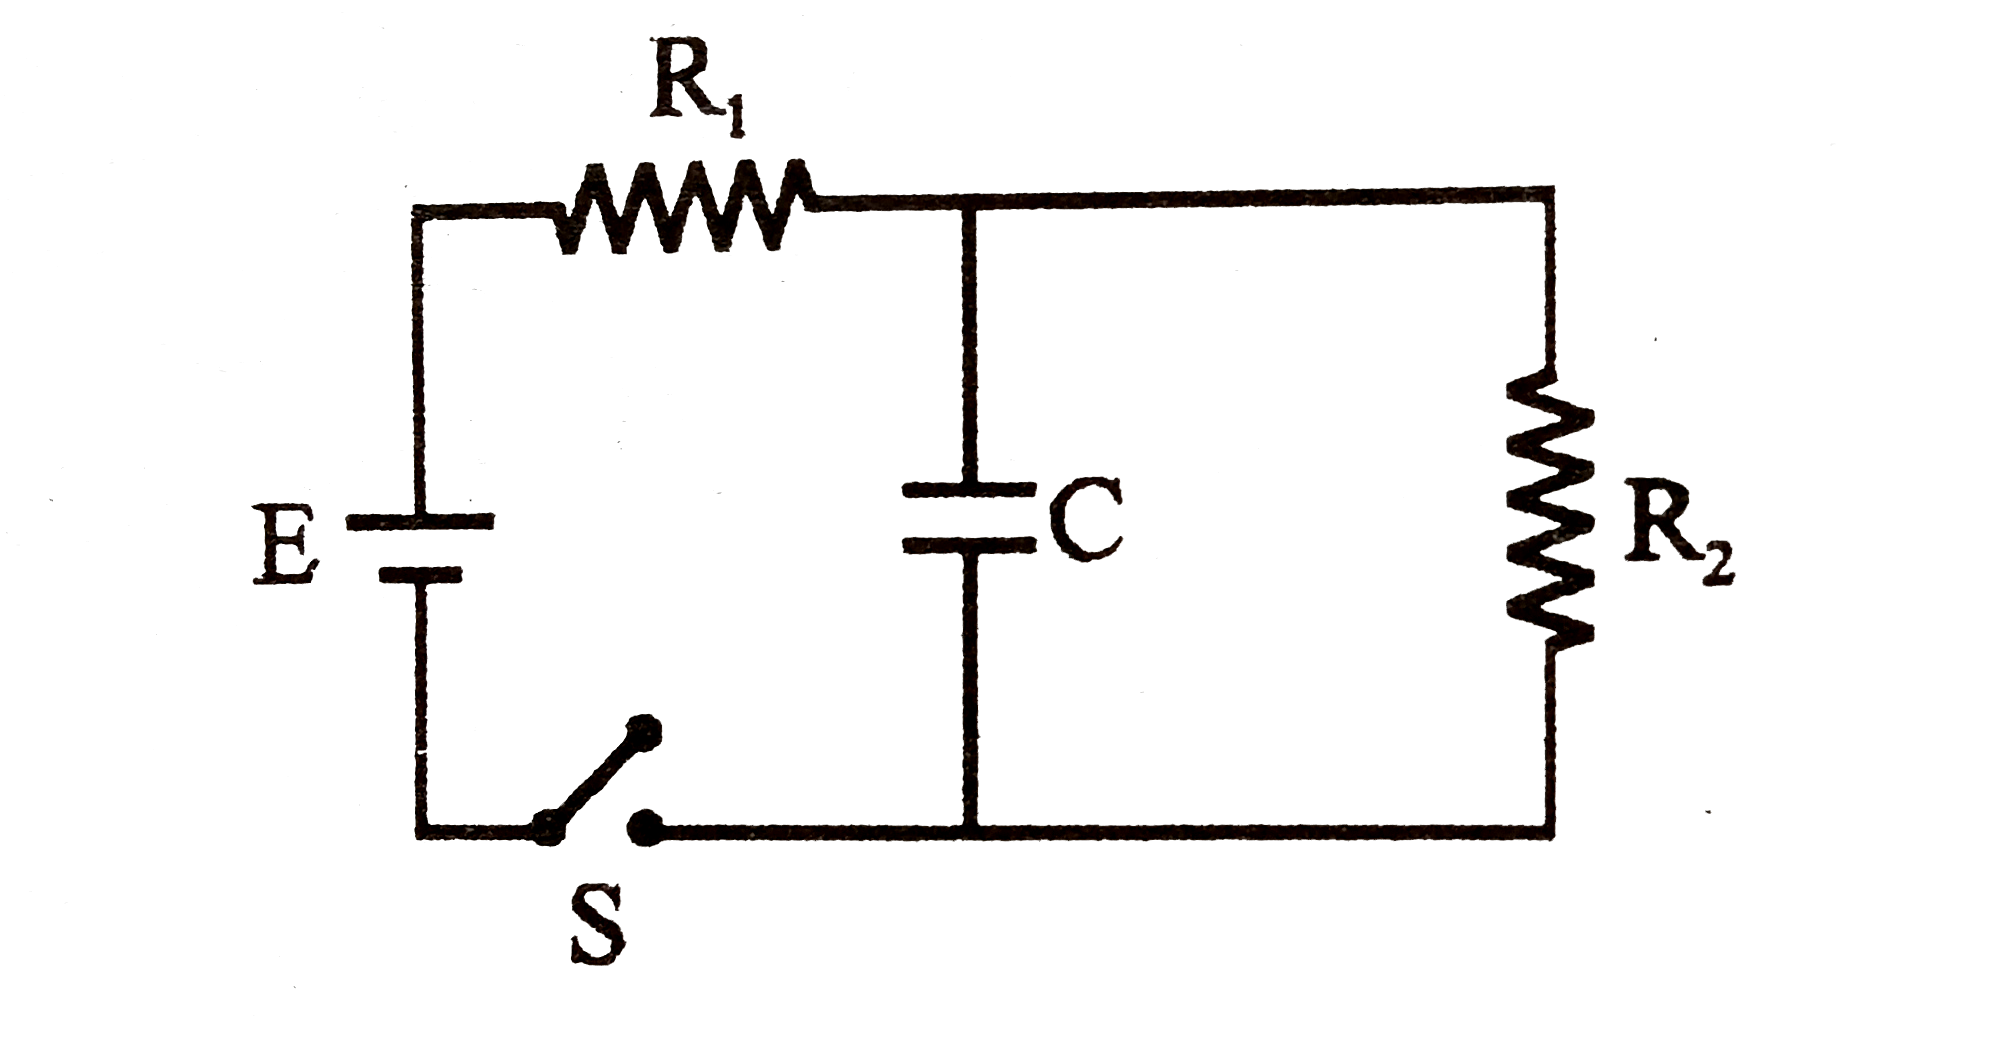
A long time after closing the switch
View SolutionIn the circuit shown in figure, circuit is closed at time t=0. At time t=ln(2) second
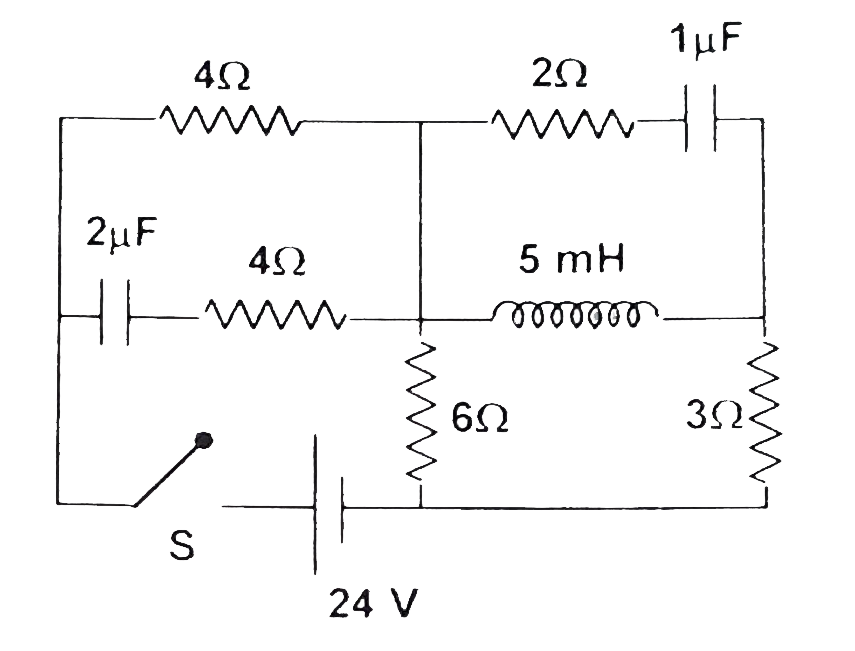
View SolutionIn the circuit shown, the switch 'S' is closed at t=0. Then the current through the battery steady state reached is
View Solution
