A rectangular loop of wire in the plane of the paper starts outside a perpendicular uniform magnetic field directed into the paper as shown in the following figure. The loop is pulled with a constant velocity through the magnetic field and out the other side. Which of the following graphs would best represent the variation of the electric current in the wire with time?
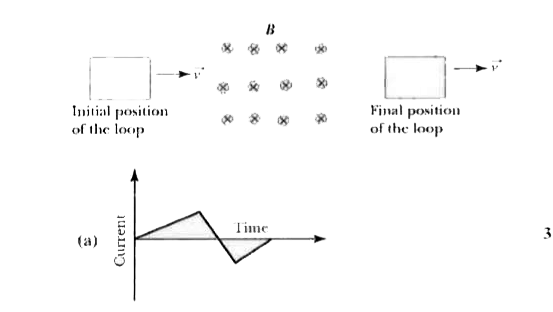


The correct Answer is:D
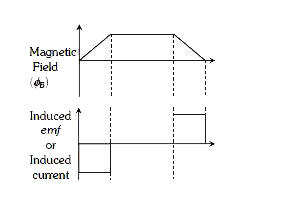
As e=−dφBdt, Current (i) = er
r → is the resistance.
Topper's Solved these Questions
- ELECTROMAGNETIC INDUCTIONBOOK - ERRORLESSCHAPTER - ELECTROMAGNETIC INDUCTIONEXERCISE - NCERT BASED QUESTIONS (STATIC EMI)
39 Videos
- ELECTROMAGNETIC INDUCTIONBOOK - ERRORLESSCHAPTER - ELECTROMAGNETIC INDUCTIONEXERCISE - NCERT BASED QUESTIONS (APPLICATION OF EMI (Dynamo, Transformer…))
20 Videos
- ELECTROMAGNETIC INDUCTIONBOOK - ERRORLESSCHAPTER - ELECTROMAGNETIC INDUCTIONEXERCISE - ASSERTION & REASON
20 Videos
- CURRENT ELECTRICITYBOOK - ERRORLESSCHAPTER - CURRENT ELECTRICITYEXERCISE - ASSERTION AND REASON
26 Videos
- ELECTRON, PHOTON, PHOTOELECTRIC EFFECT & X -RAYBOOK - ERRORLESSCHAPTER - ELECTRON, PHOTON, PHOTOELECTRIC EFFECT & X -RAYEXERCISE - ASSERTION & REASON
27 Videos
Similar Questions
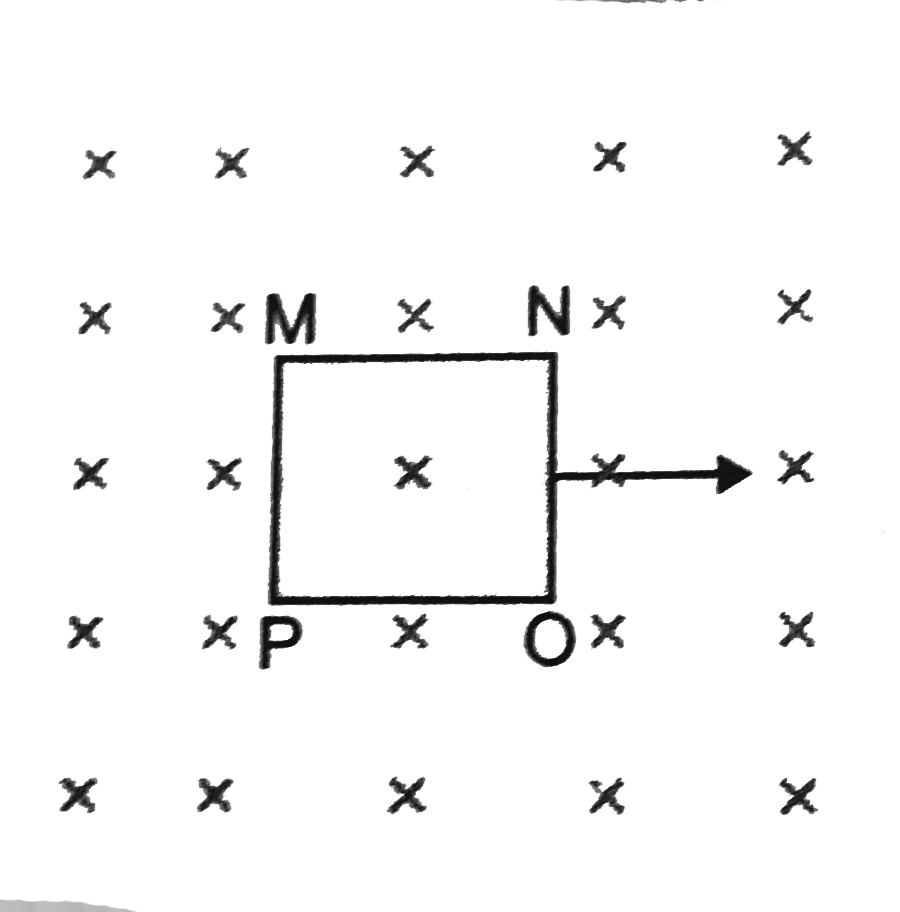
A square loop MNOP of side 20 cm is placed horizontally in a uniform magnetic field acting vertically downwards as shown in Fig. The loop is pulled with a constant velocity of 20cm/s till it goes out of the field.
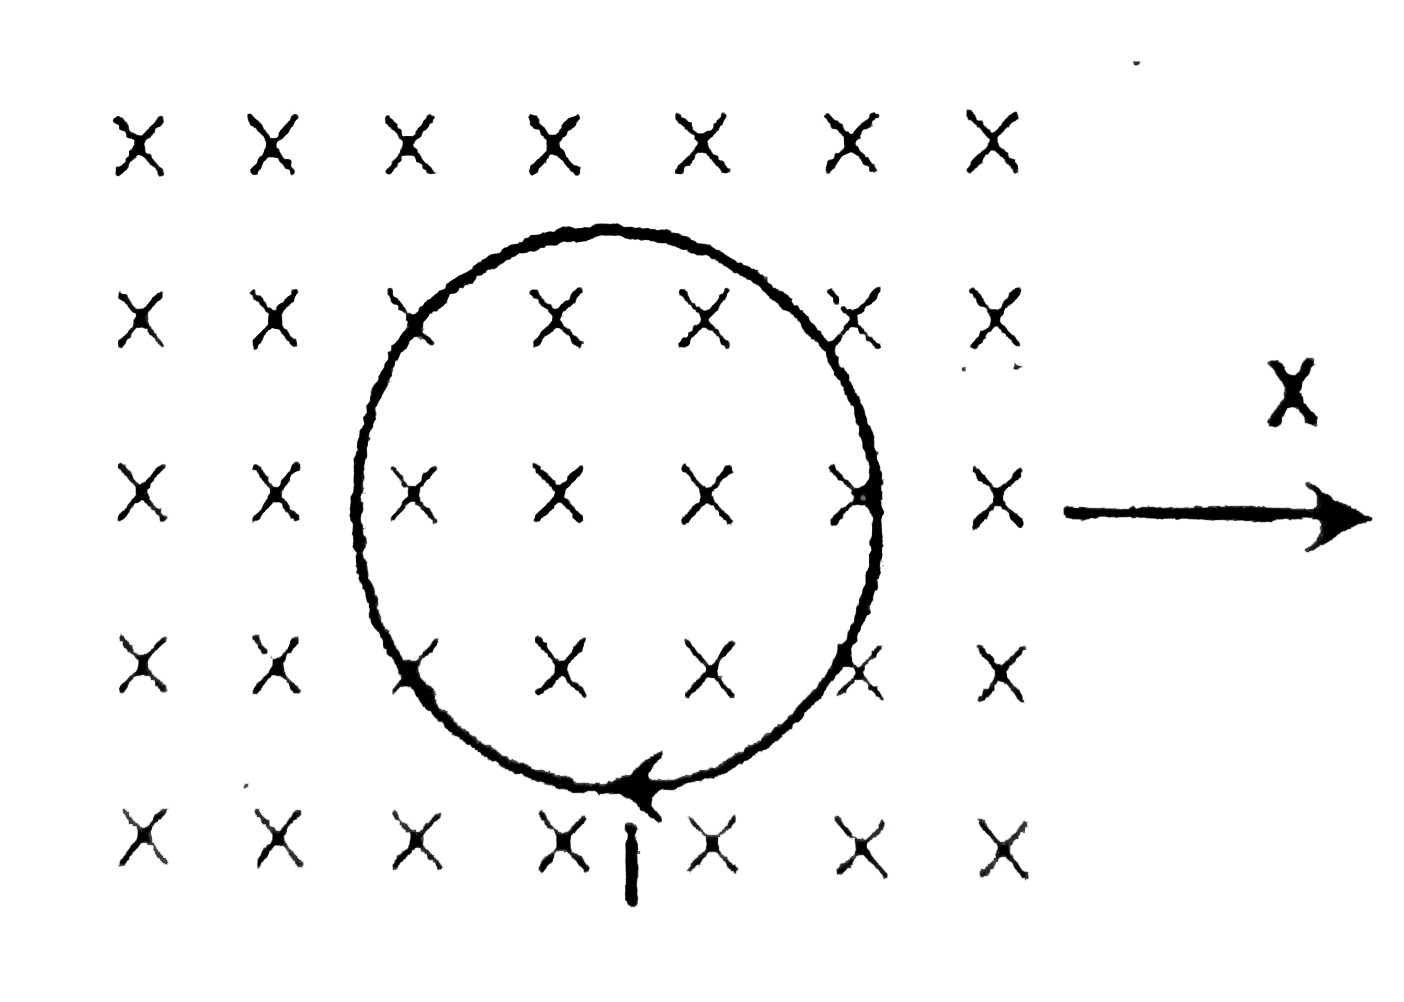
View SolutionA circular loop of wire is carring a current i (as shown in the figure). On applying a uniform magnetic field inward perpendicular to the plane of the loop, the loop
View Solution
Knowledge Check
A circular loop of wire is positioned half in and half out of a square region of uniform magnetic field directed in the +z direction, out of the paper, as shown in the following figure. To induce a counterclockwise current in this loop
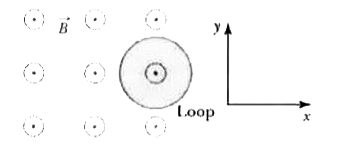 AMove it in the +y directionBMove it in the -x directionCMove it in the +x directionDMove it in the -y direction
A conducting loop carrying a current I is placed in a uniform magnetic field ponting into the plane of the paper as shown. The loop will have a tendency to
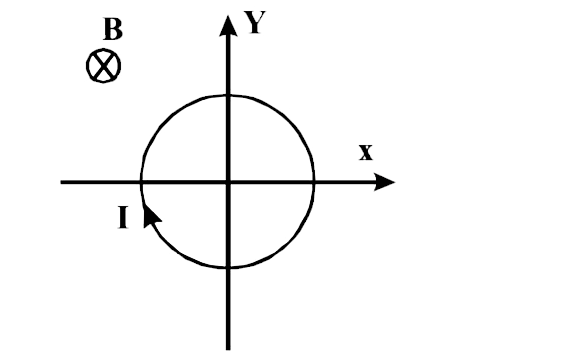 AcontractBexpandCmove towards +vex−aξsDmove towards −vex−aξs
A conducting loop is pulled with a constant velocity towards a region of uniform magnetic field as shown in the figure then the current involved in the loop is (d>r) -
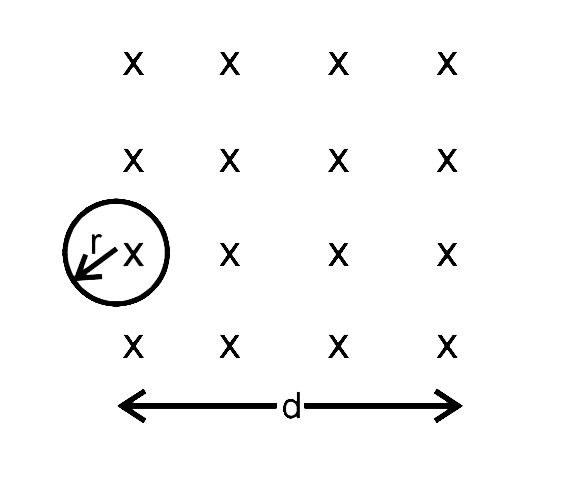 AClockwise while enteringBAnticlockwise while enteringCZero when partially outsideDAnticlockwise while leaving.
A wire loop confined in a plane is rotated in its oen plane with some angular velocity. A uniform magnetic field exists in the region. Fid the emf induced in the loop.
View SolutionA planar wire loop is placed perpendicular to uniform magnetic field . Wire loop starts rotating in its own plane about its axis with uniform angular velocity ω. If B is magnetic field intensity then what will be the induced emf in the loop ?
View SolutionA square loop of side L, resistance R placed in a uniform magnetic field B acting normally to the plane of the loop. If we attempt to pull it out of the field with a constant velocity v, then the power needed is
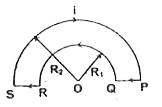
View SolutionThe wire loop shown in figure carries a current as shown. The magnetic field at the centre O is ,
View SolutionA triangle loop as shown in the figure is started to being pulled out at t=0 from a uniform magnetic field with a constant velocity v.Total resistance of the loop is constant and equals to R.Then the variation of power produced in the loop with time will be:
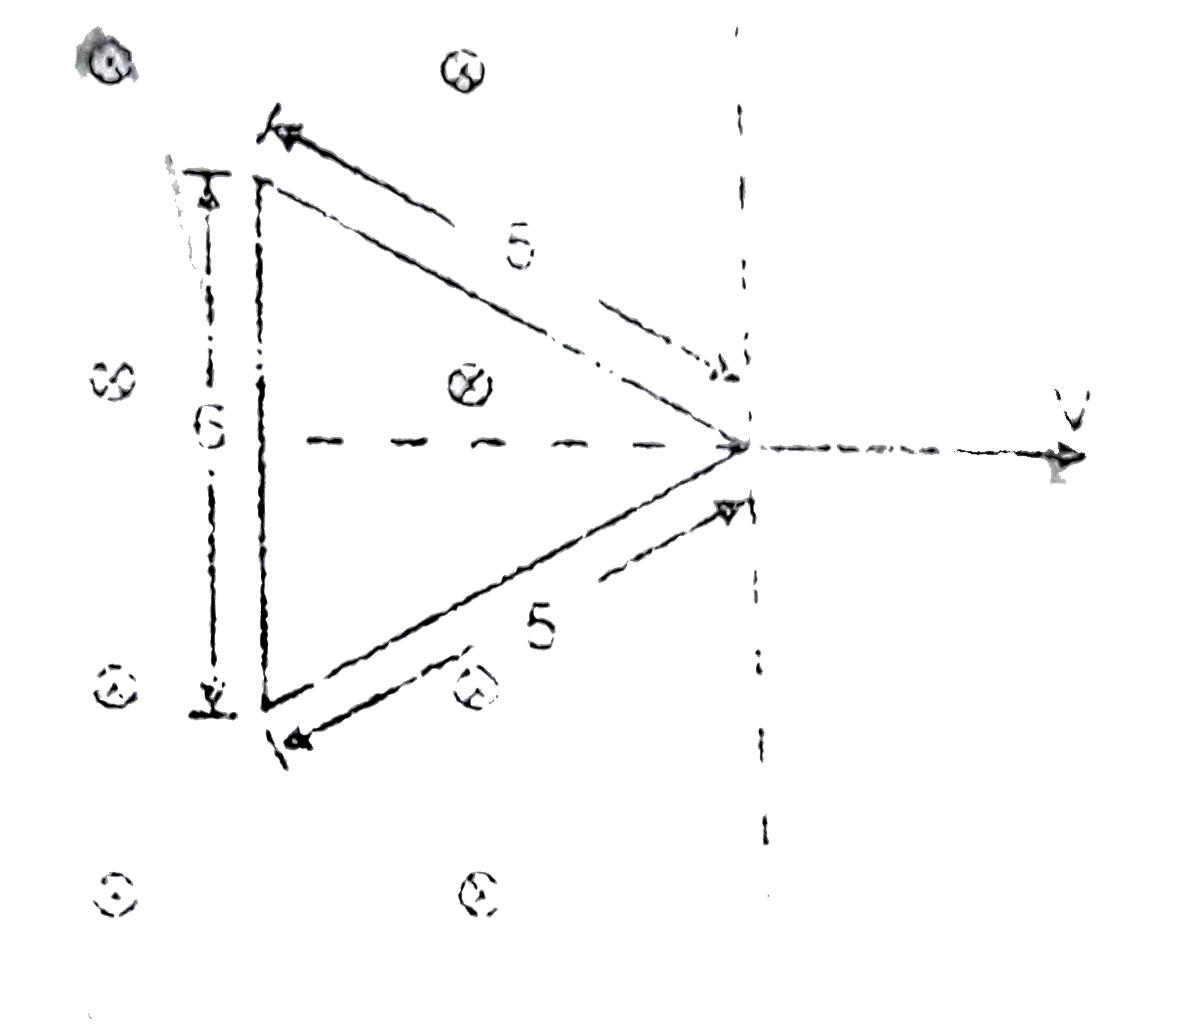
View Solution
