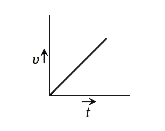
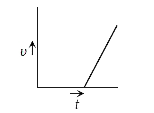
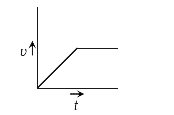
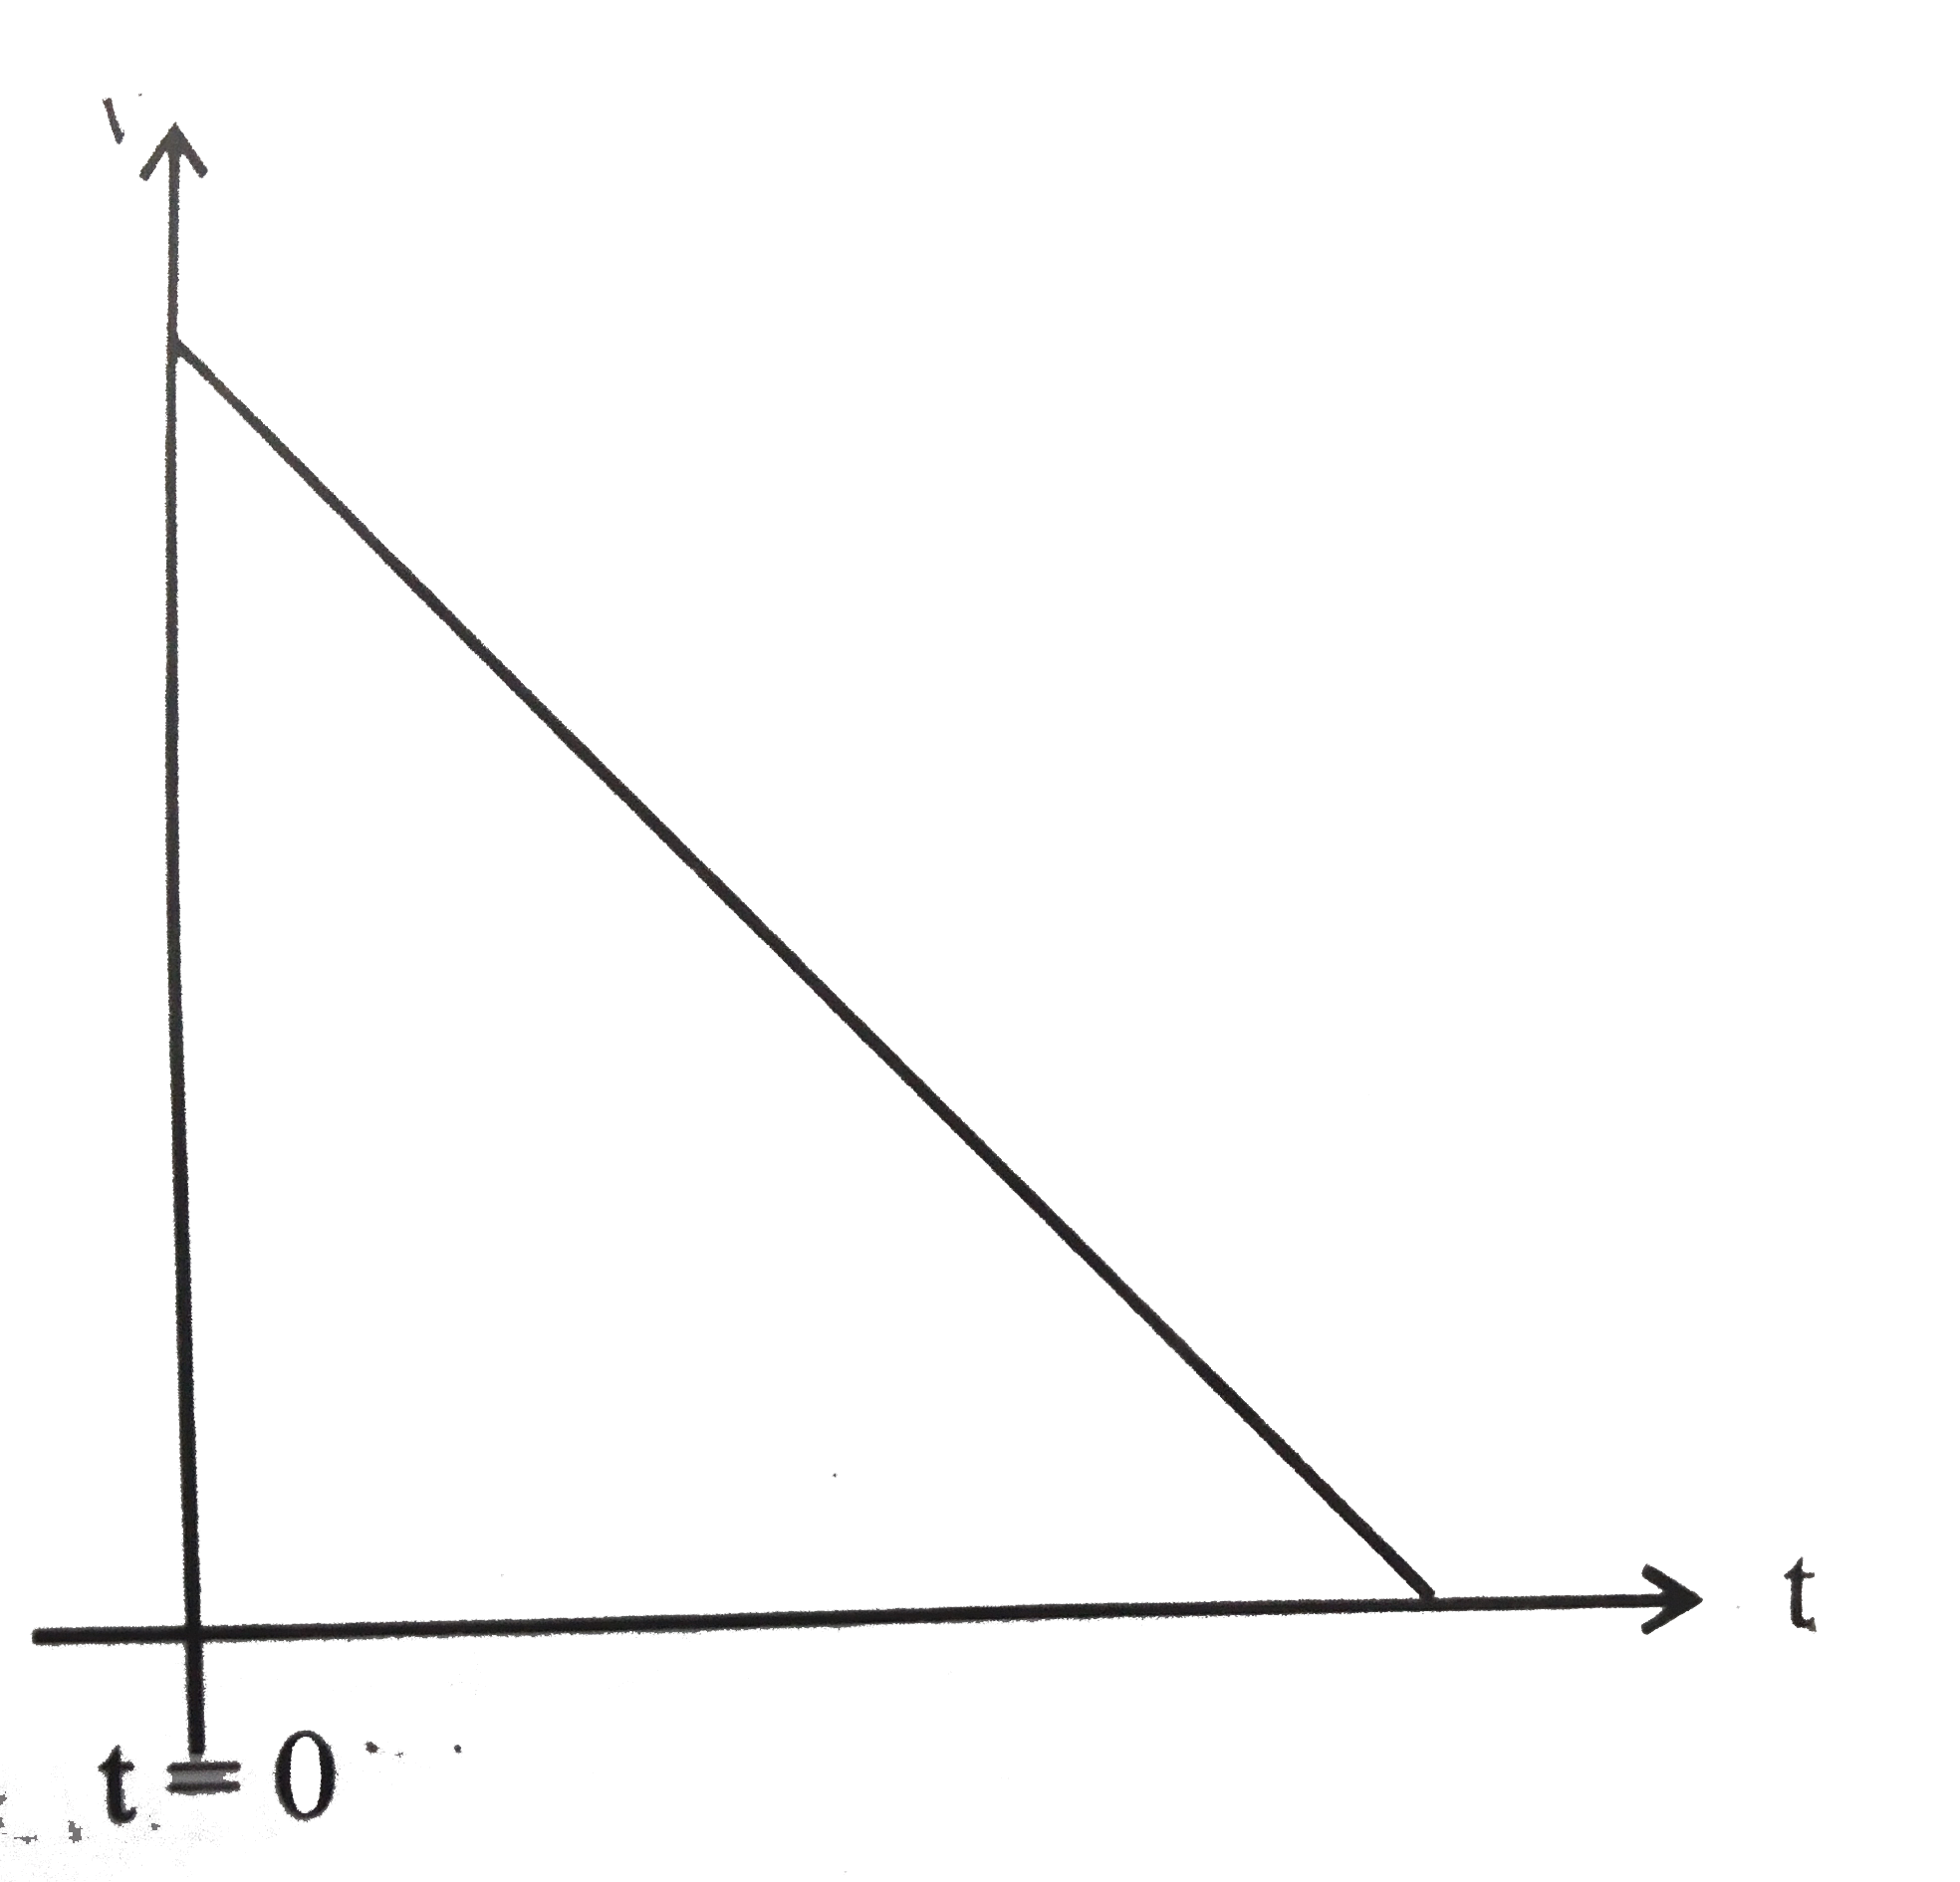
A tall cylinder is filled with viscous oil. A round pebble is dropped from the top with zero initial velocity. From the plot shown in figure, indicate the one that represents the velocity (v) of the pebble as a function of time (t)
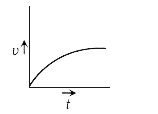
The correct Answer is:C
When the pebble is falling through the viscous oil the viscous force is
F=6πηrv
Where r is radius of the pebble, v is instantaneous speed. η is coefficient of viscosity.
As the force is variable, hence acceleration is also variable so v-t graph will not be straight line. First velocity increases and then becomes constant known as terminal velocity.
Topper's Solved these Questions
- FLUID MECHANICSBOOK - ERRORLESSCHAPTER - FLUID MECHANICSEXERCISE - PAST YEARS QUESTIONS
14 Videos
- FLUID MECHANICSBOOK - ERRORLESSCHAPTER - FLUID MECHANICSEXERCISE - ASSERTION AND REASON
23 Videos
- FLUID MECHANICSBOOK - ERRORLESSCHAPTER - FLUID MECHANICSEXERCISE - NCERT BASED QUESTIONS(PASCAL.S LAW AND ARCHIMEDES PRINCIPLE)
23 Videos
- ELASTICITYBOOK - ERRORLESSCHAPTER - ELASTICITYEXERCISE - ASSERTION & REASON
10 Videos
- FRICTION BOOK - ERRORLESSCHAPTER - FRICTION EXERCISE - ASSERTION & REASON
8 Videos
Similar Questions
Which one among the following situation is best represented by the velocity - time plot shown above?
View SolutionA round pebble is released from the point X inside a frictionless hemispherical ball as shown in the figure such that it just upto edge Y of the bowl . With what speed the pebble is released down inside the bowl ?
View Solution
Knowledge Check
A tall cylinder is filled with viscous oil. A round pebble is dropped from the top with zero initial velocity. From the plot shown in figure, indicate the one that represents the velocity (v) of the pebble as a function of time (t)
A B
B C
C D
D
A tall cylinder is filled with viscous oil. A round pebble is dropped from the top with zero initial velocity. From the plot shown in figure, indicate the one that represents the velocity (v) of the pebble as a function of time (t)
A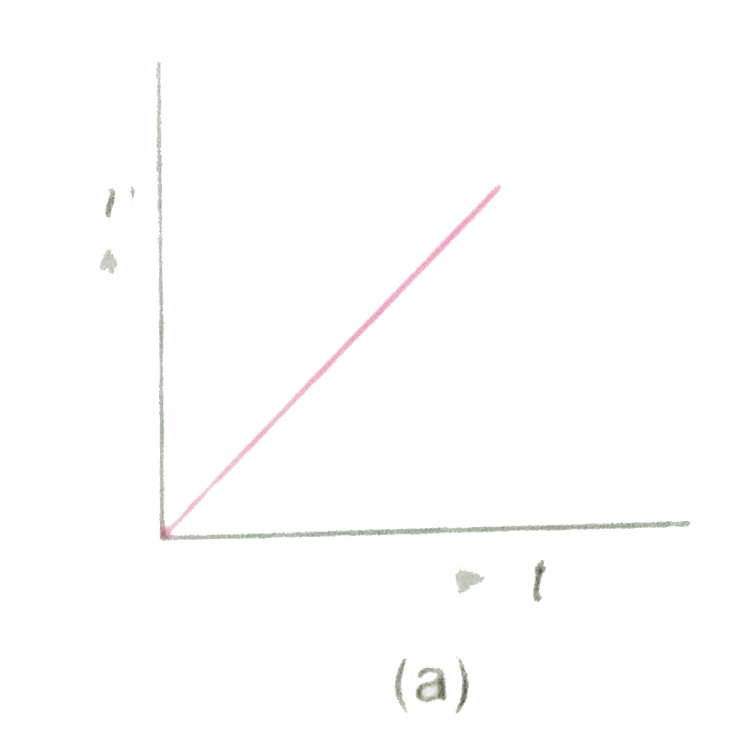 B
B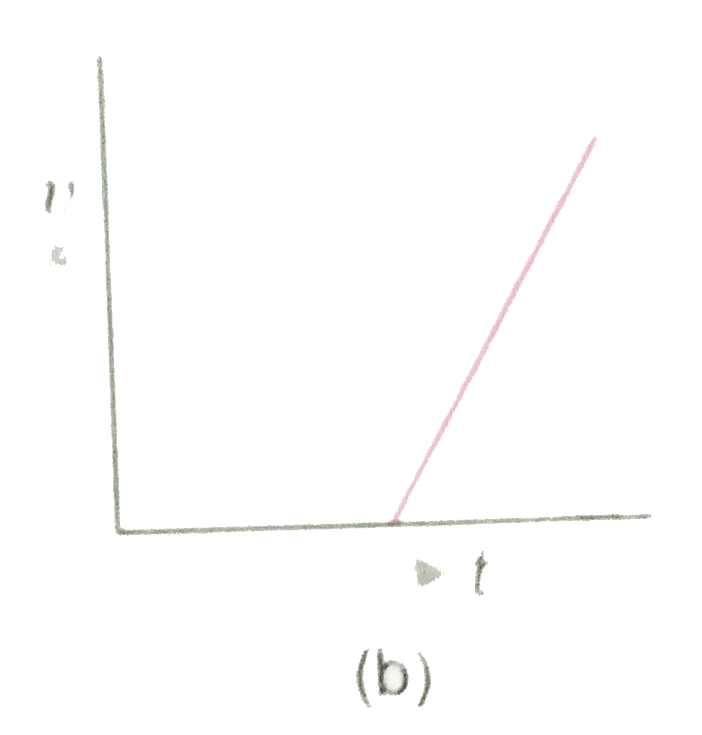 CD
CDO04.png)
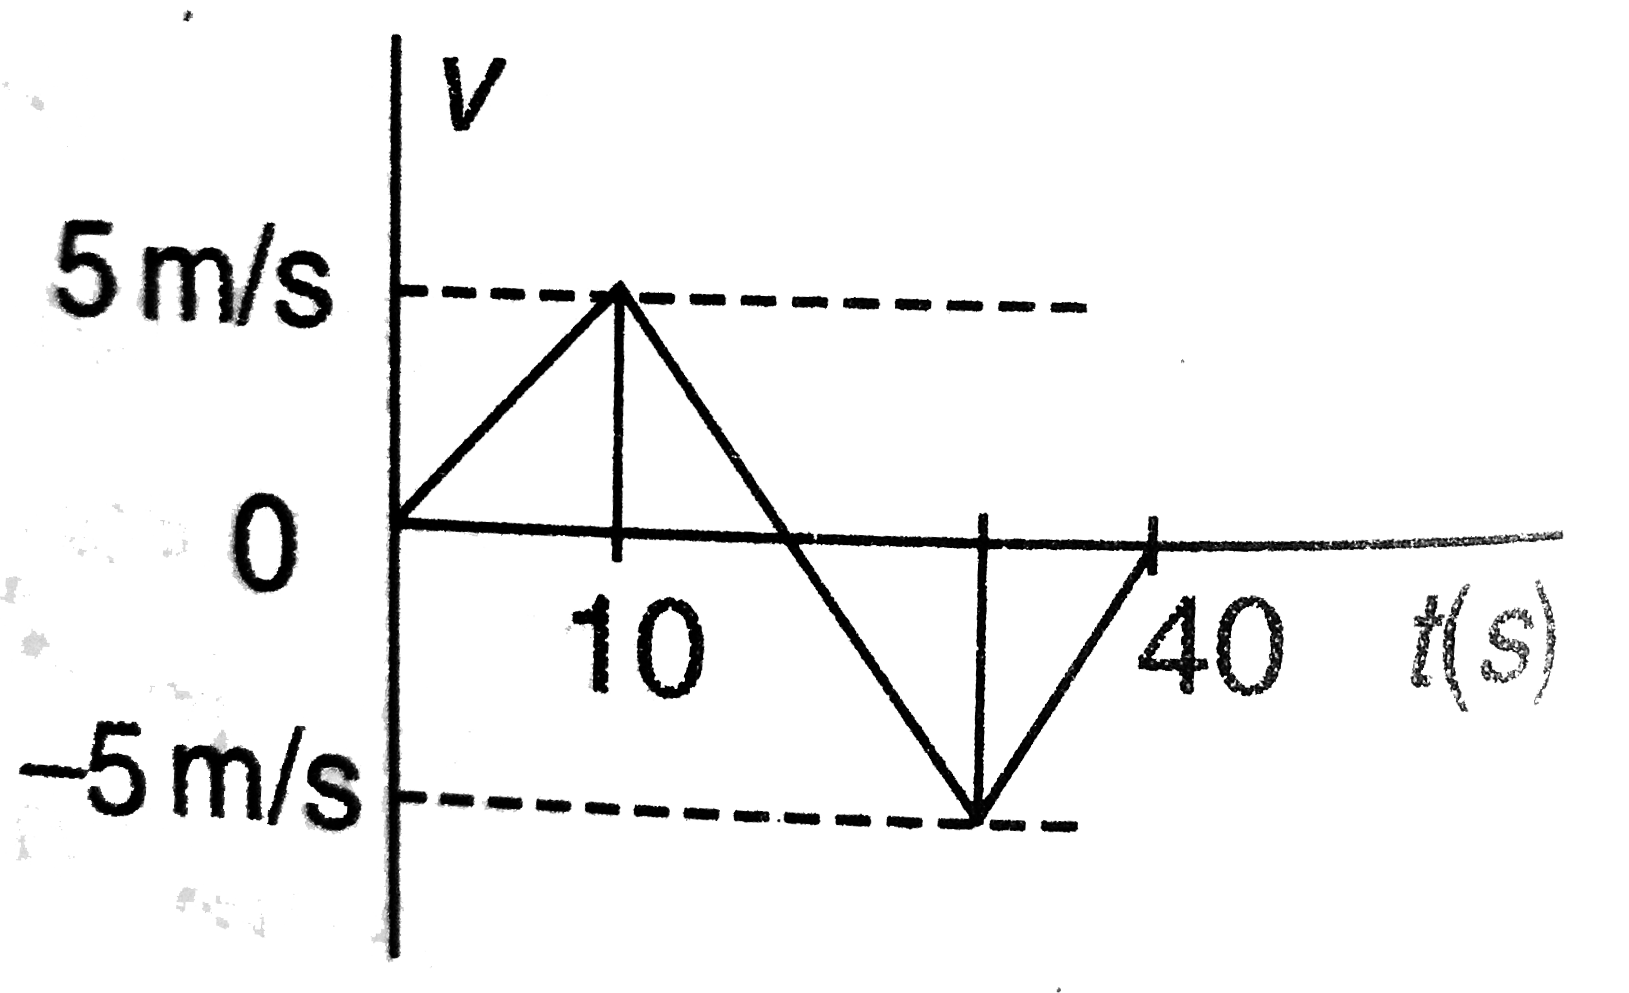
The figure shows the velocity (v) of a particle plotted against time (t).
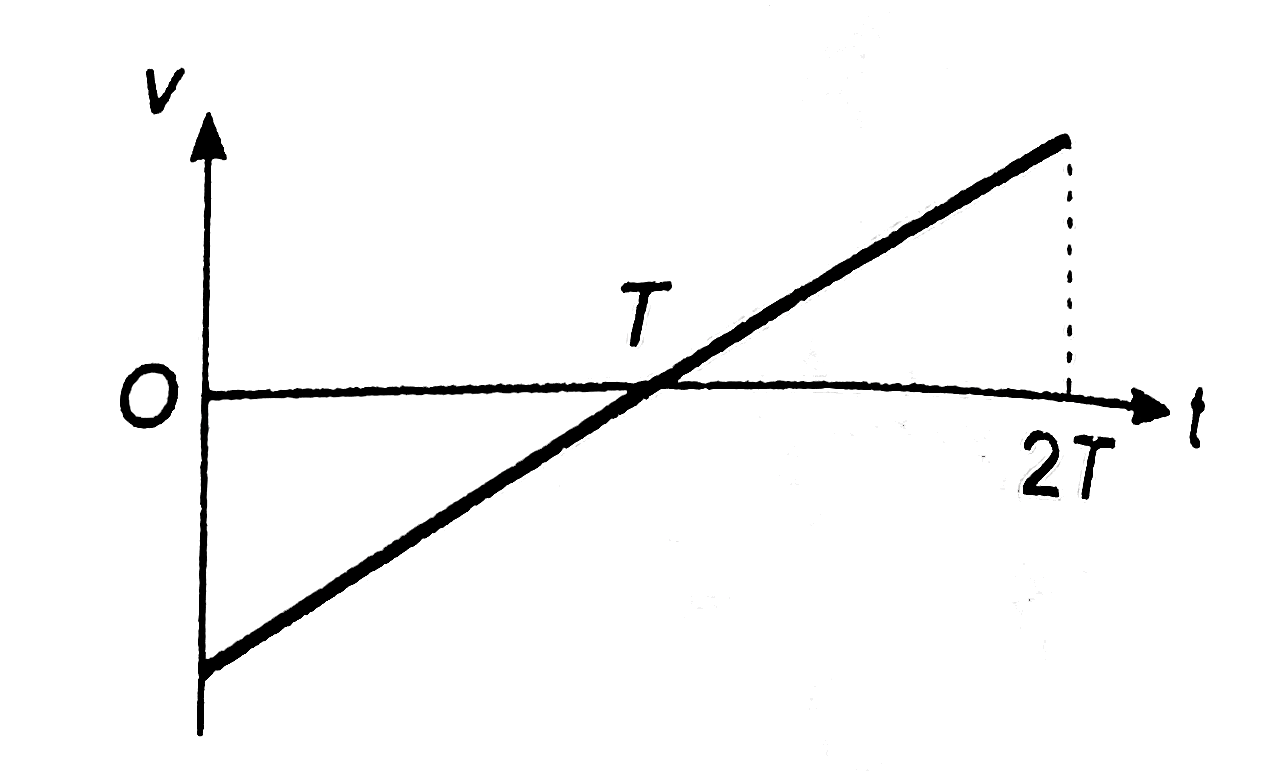 AThe particle changes its direction of motion at some point.BThe acceleration of the particle remains constantCThe displacement of the particle is zeroDThe initial and final speeds of the particle are the same
From the velocity time plot shown in figure find the distance travelled by the particle dureing the first 40 seconds. Also find the average velocity during this period.

View SolutionWhich of the velocity-time (v - 1) graphs shown in figure can possibly represent one-dimensional motion of a particle? (A) (B)
View SolutionThe velocity-time plot is shown in figure. Find the average speed in time interval t=0 to t=40s during the period.
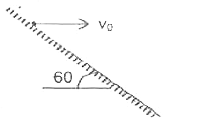
View SolutionA ball is projected horizontally from an inclined plane with a velocity V, as shown in the figure. It will strike the plane after a time
View SolutionA ball is thrown vertically upwards from the top of tower of height h with velocity v . The ball strikes the ground after time.
View Solution
