The intensity distribution of X-rays from two Coolidge tubes operated at different voltages V1 and V2 and using different target materials of atomic numbers Z1 and Z2 is shown in the figure which one of the following inequalities is true?

V1>V2,Z1<Z2
V1>V2,Z1>Z2
V1<V2,Z1>Z2
V1=V2,Z1<Z2
The correct Answer is:A
λmin=hceV⇒λ∝1V
λ2>λ1⇒V1V2
f=a(Z−b)2⇒f∝(Z−1)2
λ∝1(Z−1)2,λ1>λ2⇒Z2>Z1
Topper's Solved these Questions
- ELECTRON, PHOTON, PHOTOELECTRIC EFFECT & X -RAYBook:ERRORLESSChapter:ELECTRON, PHOTON, PHOTOELECTRIC EFFECT & X -RAYExercise:PAST YEARS QUESTIONS
Explore 71 Videos
- ELECTRON, PHOTON, PHOTOELECTRIC EFFECT & X -RAYBook:ERRORLESSChapter:ELECTRON, PHOTON, PHOTOELECTRIC EFFECT & X -RAYExercise:ASSERTION & REASON
Explore 27 Videos
- ELECTRON, PHOTON, PHOTOELECTRIC EFFECT & X -RAYBook:ERRORLESSChapter:ELECTRON, PHOTON, PHOTOELECTRIC EFFECT & X -RAYExercise:NCERT BASED QUESTIONS (Photon and Photoelectric Effect)
Explore 78 Videos
- ELECTROMAGNETIC INDUCTIONBook:ERRORLESSChapter:ELECTROMAGNETIC INDUCTIONExercise:ASSERTION & REASON
Explore 20 Videos
- ELECTRONICSBook:ERRORLESSChapter:ELECTRONICSExercise:Assertion & Reason
Explore 26 Videos
Similar Questions
Knowledge Check
The intensity distribution of X - rays from two Coolidge tubes operated on different voltages V1 and V2 and using is shown in the figure . Which one of the following inequalities is true ?
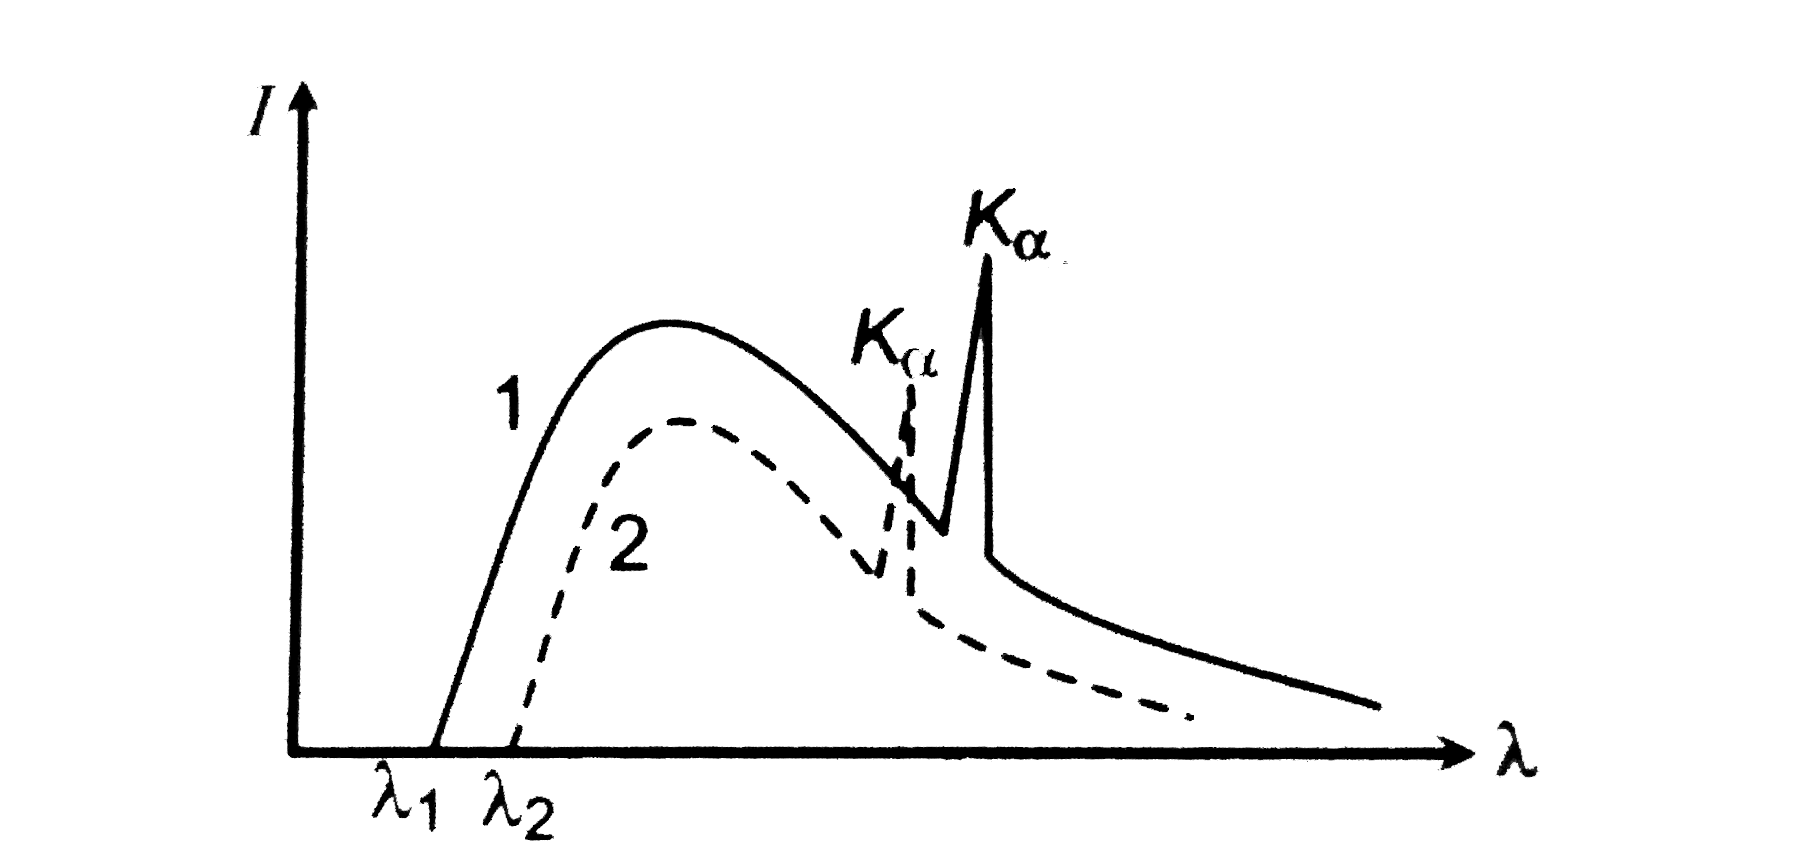 AV1>V2,Z1<Z2BV1>V2,Z1>Z2CV1<V2,Z1>Z2DV1=V2,Z1<Z2
The current I and voltage V variations for a given metallic wire at tow different temperature T1andT2 are shown in the figure. Then which one of the following is correct
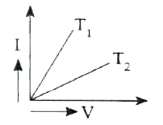 AT1>T2BT1<T2CT1=T2DT1=2T2
The energy ratio of two kα photons obtined in x -ray from two metal targets of atomic numbes, Z1 and Z2 is ,
AZ1Z2B(Z1Z2)2C(Z1−1Z2−1)2D√(Z1−1)(Z2−1)
find the difference of the complex numbers:
z1=−3+2iandz2=13−i.
View SolutionV- I graph for a metallic wire at two different temperature T1 and T2 is shown in figure. Which of the two temperature is higher and why?
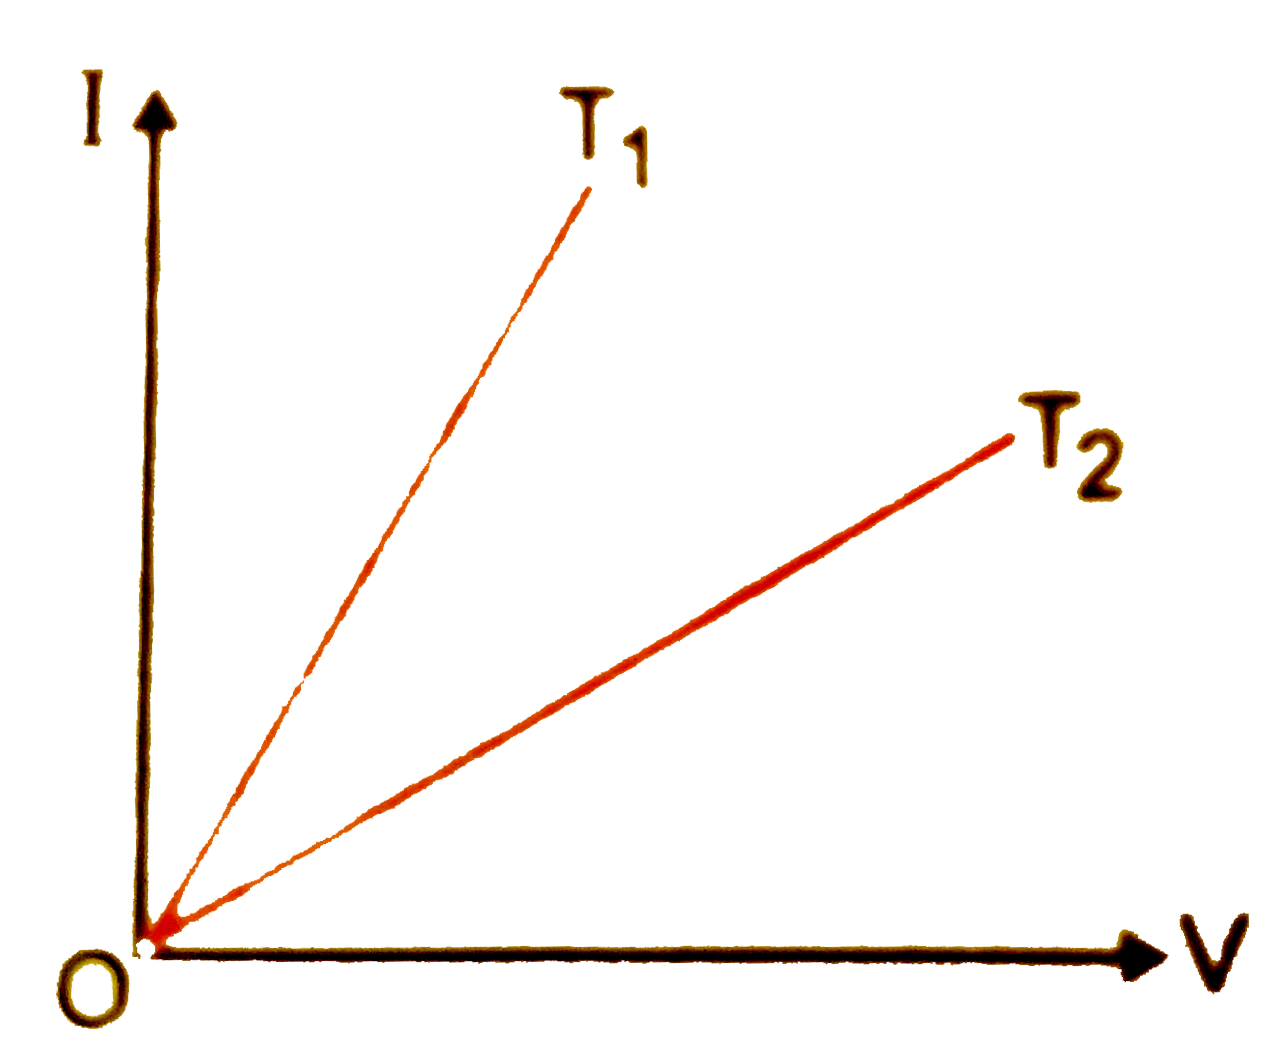
View SolutionThe voltage-current (V-I) graph of a metallic conductor at two different temperature T1 and T2 is shown in figure. At which temperature is the resistance higher?
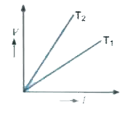
View SolutionThe voltage V and current I graph for a conductor at two different temperatures T1 and T2 are shown in the figure. The relation between T1 and T2 is
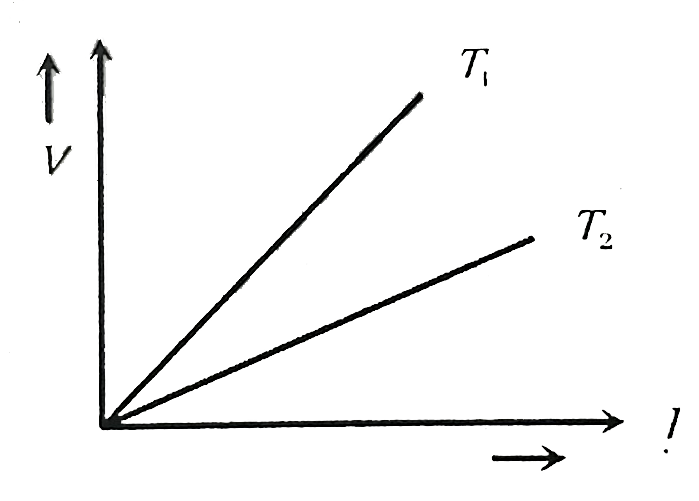
View SolutionThe voltage V and current I v graphs for a conductor at two different temperatures T1andT2 are shown in the figure. The relation between T1andT2 is

View Solution
