The graph in figure below shows how the number of X cells typically declines over a period of many years following the initial HIV infection. Study the graph below and answer the question:
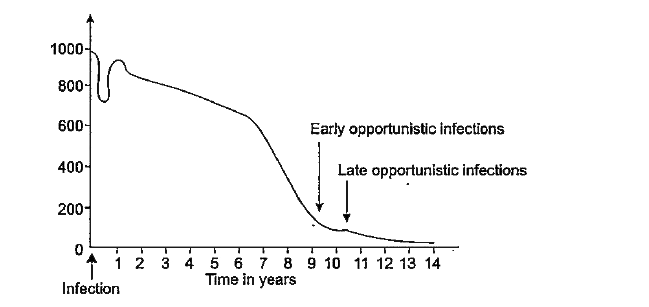
Name the cells X?
helper T-cells, HIV infects and destroys helper T cells.
Similar Questions
A bar graph showing the heights of six mountain peaks is given below. Study the bar graph and answer the questions.
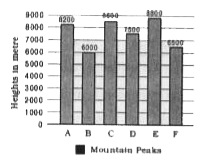
Which peak is the second highest ?
View SolutionThe following graph below shows the number of students (in thousands) who were admitted to three different courses in 5 years in a university. Study the graph and answer the question.
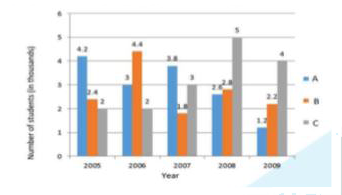
What is the ratio of the number of students who were admitted to course A in the year 2007 to that of students who were admitted to course C in the year 2009?
View Solution
Knowledge Check
The graph given below the daily income of 50 workers in a factory. Study the graph and answer the questions.
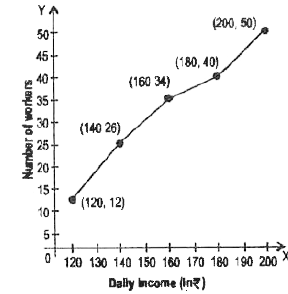
The median wages in the factory isARs 140BRs 138CRs 150DRs 160The given bar graph shows the biscuit exports of India over a period of five years. Study the graph and answer the questions that follows

In which two year was the value per tonne equal?A2006 and 2007B2008 and 2009C2007 and 2008D2005 and 2006The circle - graph given here shows the spendings of a country on various sports during a prticular year. Study the graph carefully and answer the questions given below It .

How much per cent less is spent on football than that Cricket ?A2229%B27%C3313 %D3712 %
The graph shows Income and Expenditure of a company. Study the graph and answer the questions.
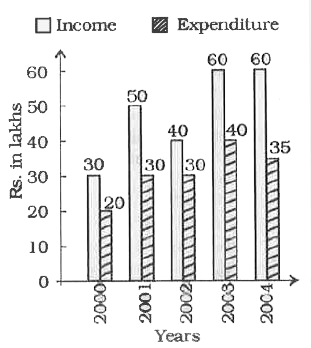
The profit was maximum in the year
View SolutionThe following graph shows the sales of cars (in thousands) in four cities in 4 years. Study the graph and answer the question
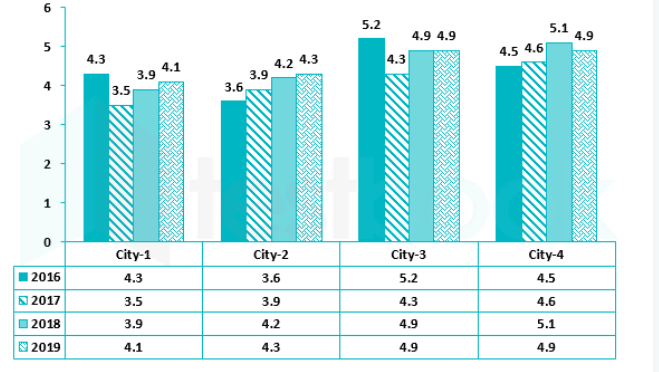
In which year. the sales are highest?
View SolutionThe circle graph given here shows the spendings of a country on various sports during a particular year, study the graph carefully and answer the questions given below it.
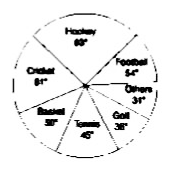
How much percent less is spent on Football than that on cricket?
View SolutionThe circle graph given here shows the spendings of a country on various sports during a particular year, study the graph carefully and answer the questions given below it.

How much per cent more is spent on Hockey than that on golf?
View SolutionThe circle - graph given here shows the spendings of a country on various sports during a prticular year. Study the graph carefully and answer the questions given below It .
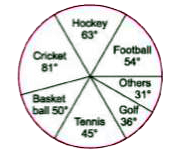
How much percent more is spent on Hockey than that on Golf?
View Solution
