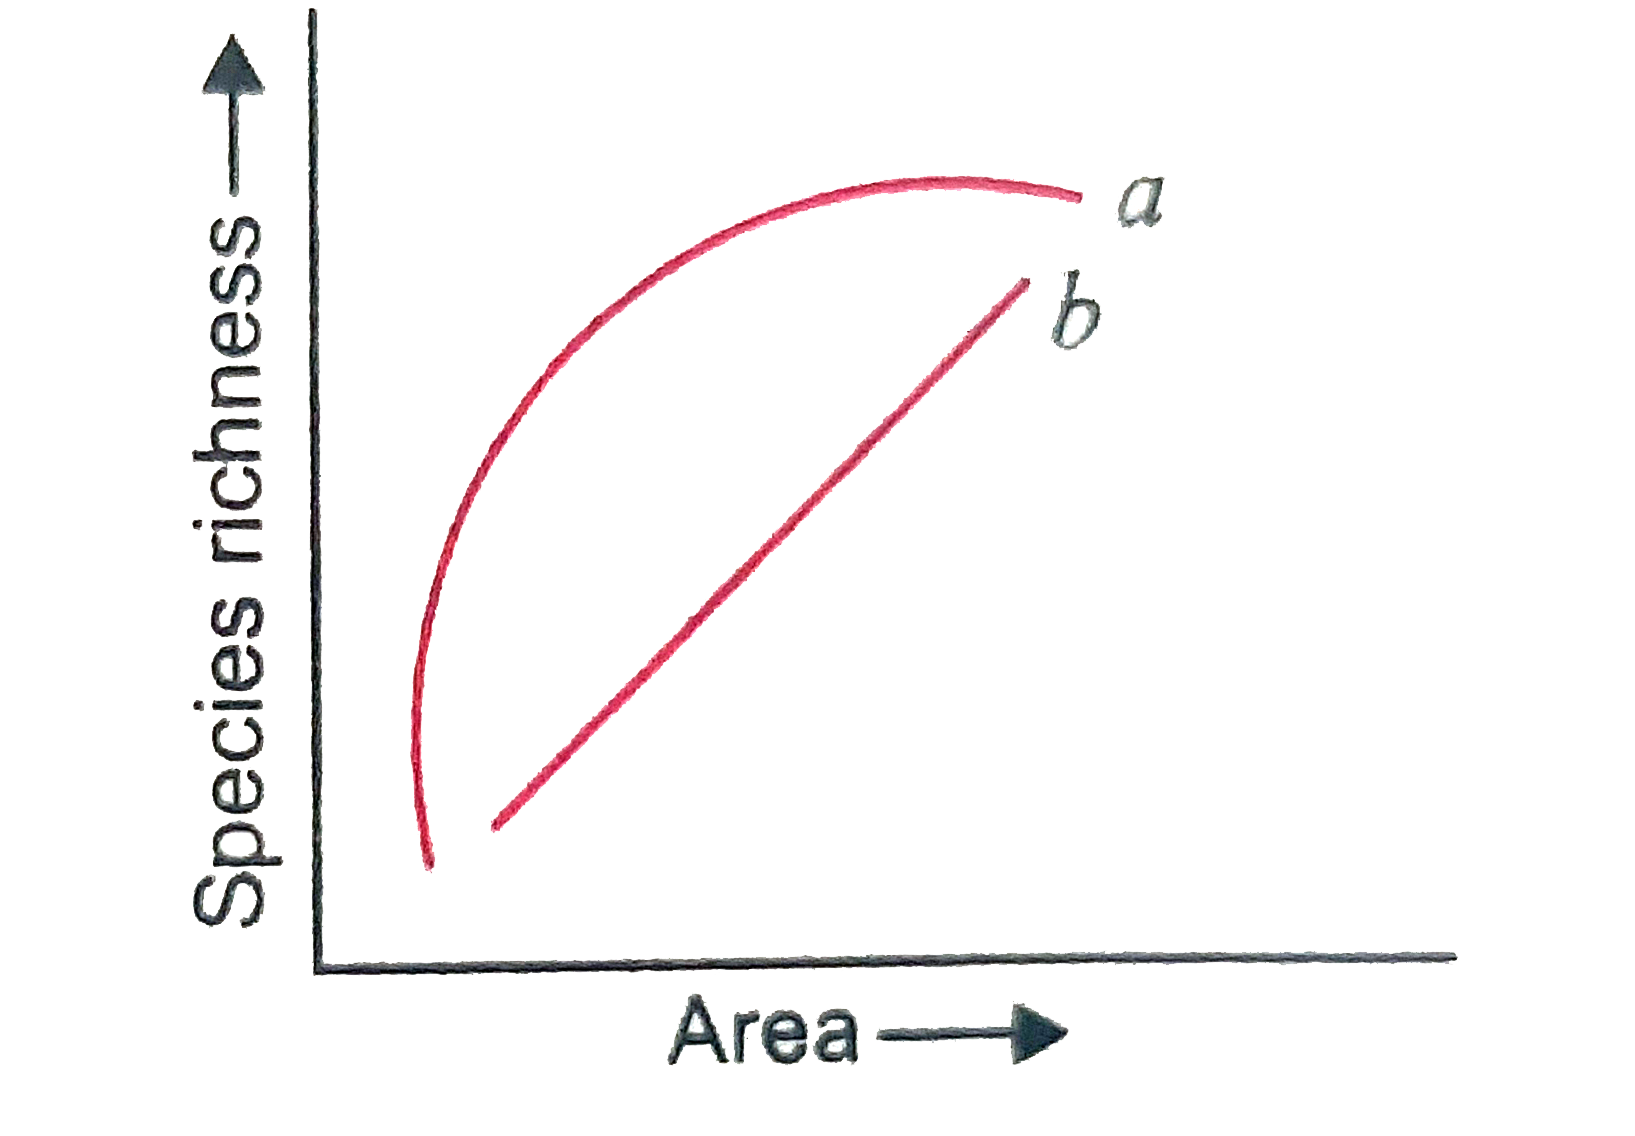
The graph given below shows the species-area relationship. Answer the following question as directed:
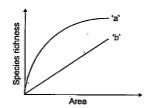
Name the naturalist who studied the kind of relationship shown in the graph. Write the observation made by him?
The naturalist Alexander Von Humboldt explained about the above given graph. His observations suggested that, the species richness increases with an increase in explored area but upto certain limit.
Similar Questions
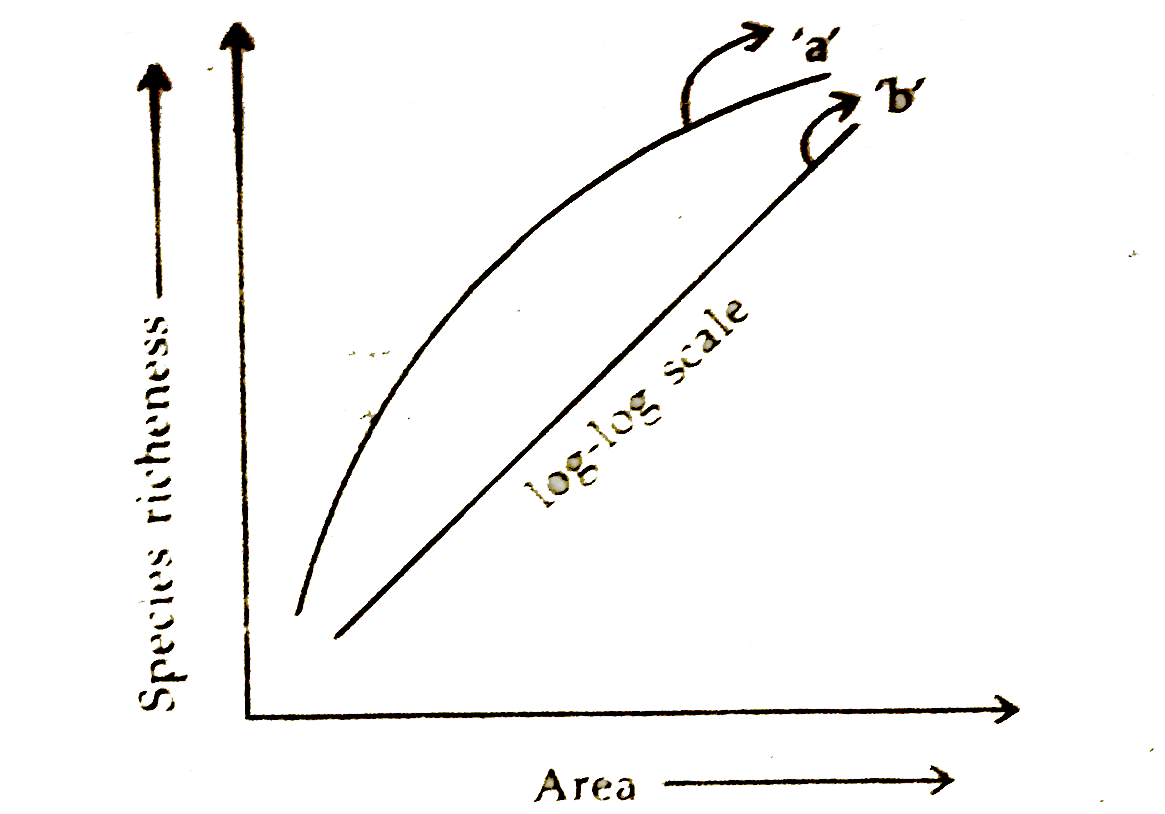
The following graph shows the species area relationship. Answers the Questions as directed.
(a) Name the naturalist who studied the kind of relationship shown in the graph.
Write the observations made by him.
(b) Write the situations as discovered by the ecologists when the value of 'Z' (slope of the line) lies between
(i) 0.1 and 0.2, (ii) 0.6 and 1.2
What does 'Z' stand for ?
(c ) When would the slope of the line 'b' become steeper ?
 View Solution
Answer the following questions below :
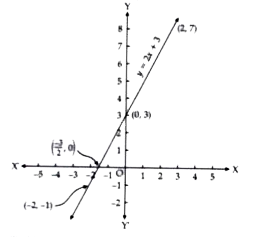
Name the shape of the graph.View SolutionAnswer the following questions below :
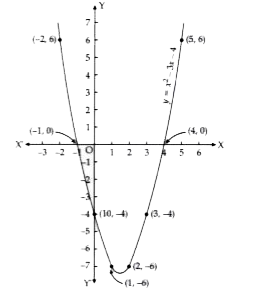 Name the shape of the graph . View Solution
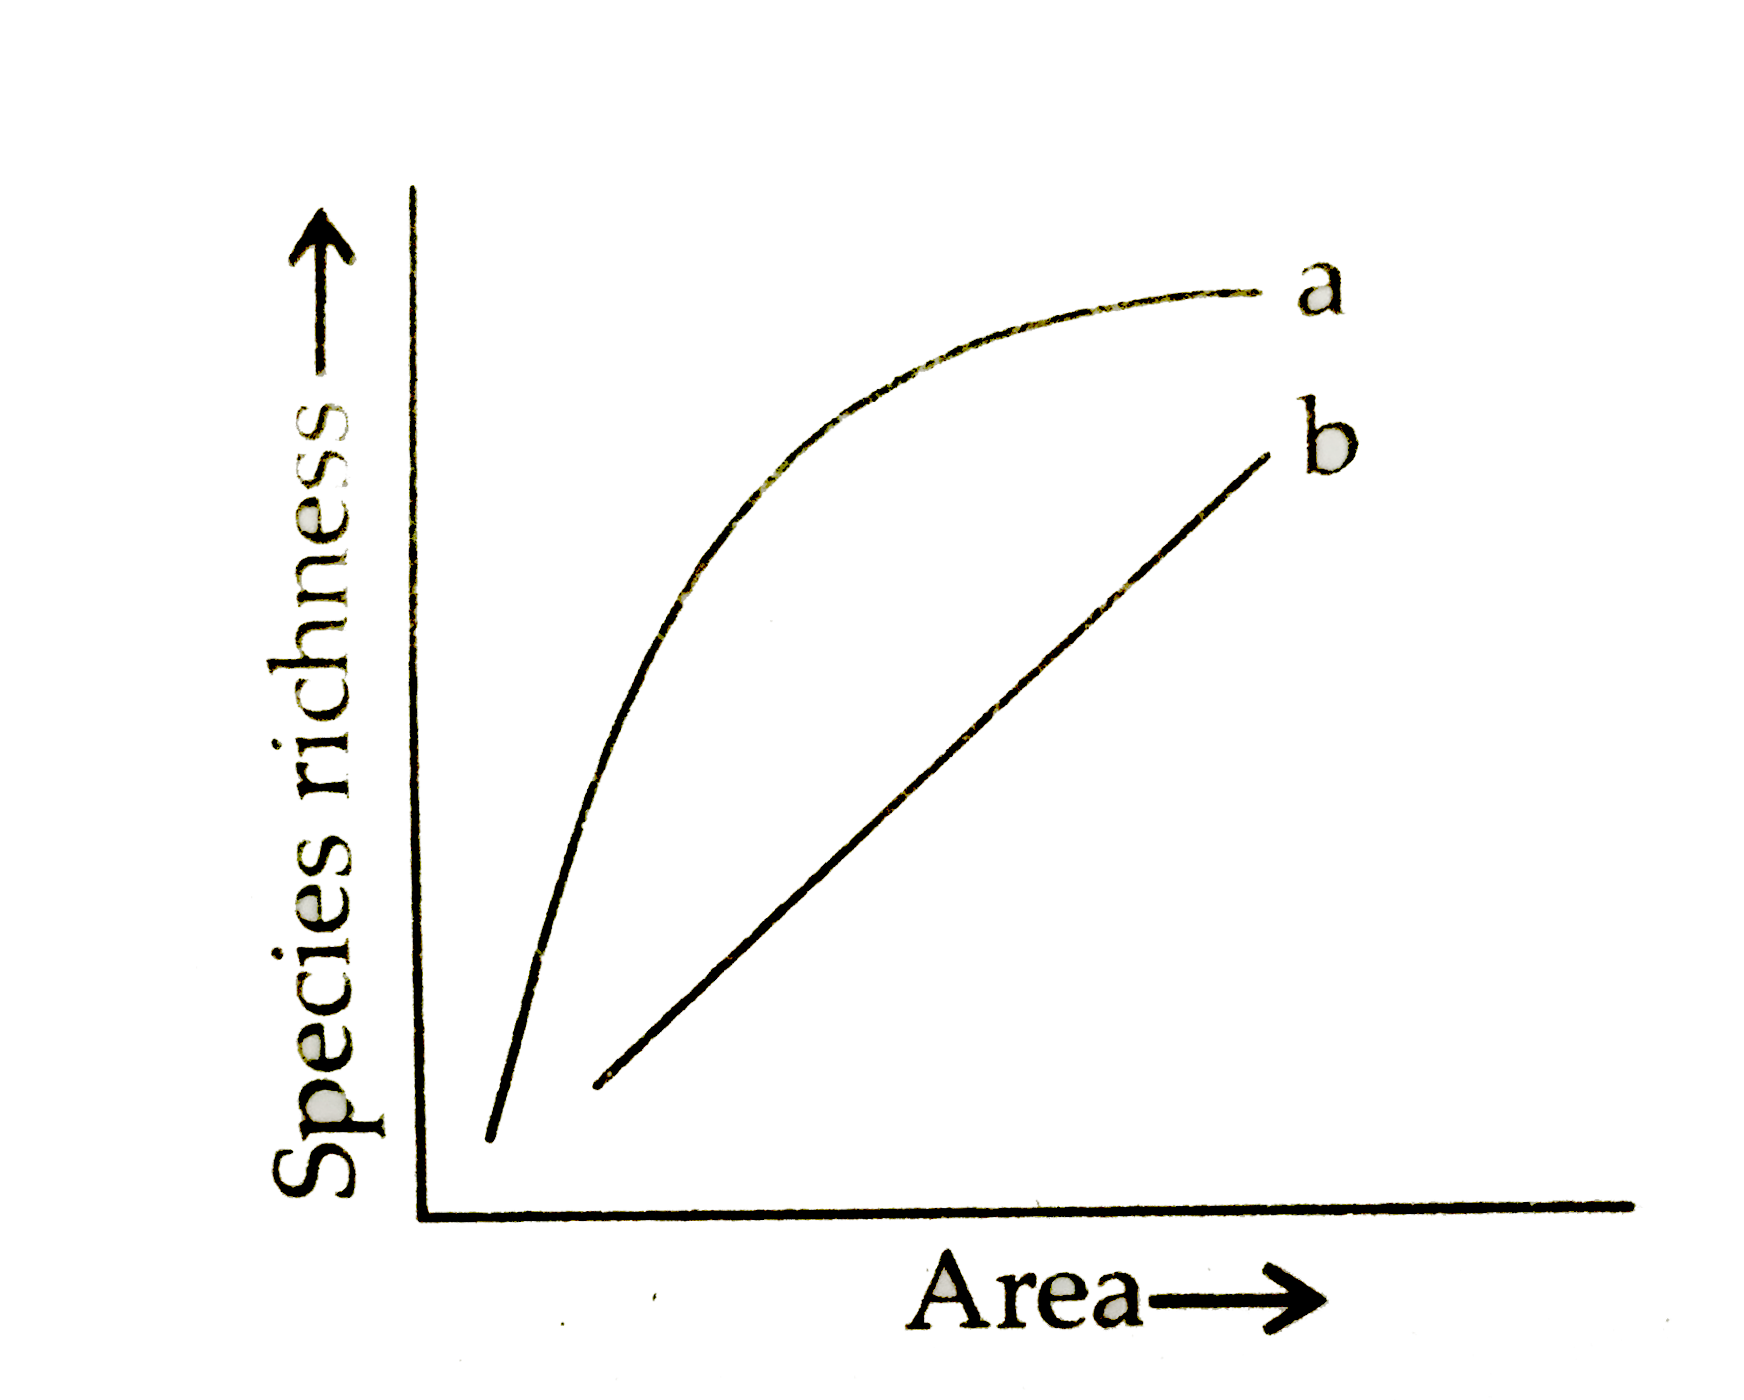
The given graph shows species-area relationship. Write the equation of the curve 'a' and explain.
 View Solution
The above graph show Species-Area relationship. Write the equation of the curve a and explain.
 View Solution
Read the bar graph given below and answer the following questions:

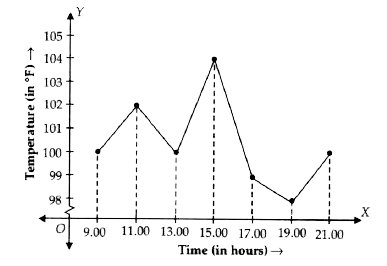
What information is given by the þar graph?View SolutionObserve the graph and answer the following questions.
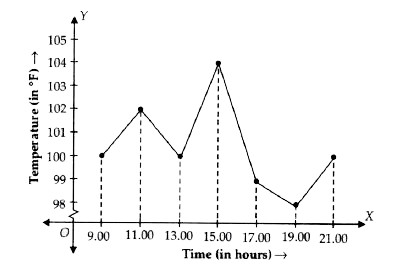
The temperature is minimum at
 View Solution
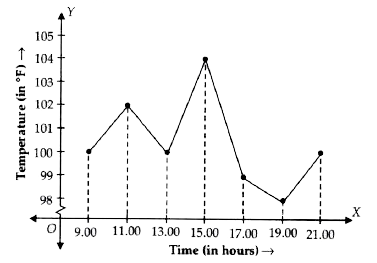
Observe the graph and answer the following questions.
The information given by the graph is:
 View Solution
Study the diagram given below and answer the following question.

What kind of motion does the swing show?View SolutionObserve the graph and answer the following questions.
The temperature is maximum at
 View Solution
