Which of the following graphs correctly represents the variation of particle momentum with associated de Broglie wavelength?
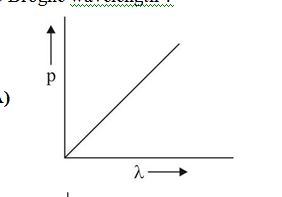
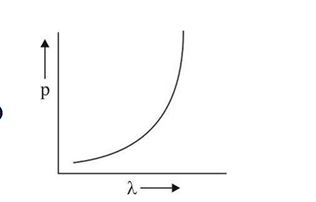
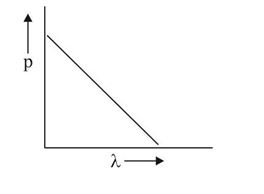
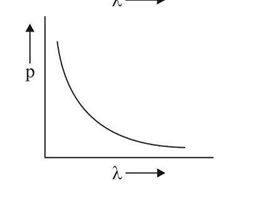
The correct Answer is:D
Step by step video & text solution for Which of the following graphs correctly represents the variation of particle momentum with associated de Broglie wavelength? by Chemistry experts to help you in doubts & scoring excellent marks in Class 12 exams.
Updated on:21/07/2023Similar Questions
Which of following graphs correctly represents the variation of particle momentum with de-Broglie wavelength?
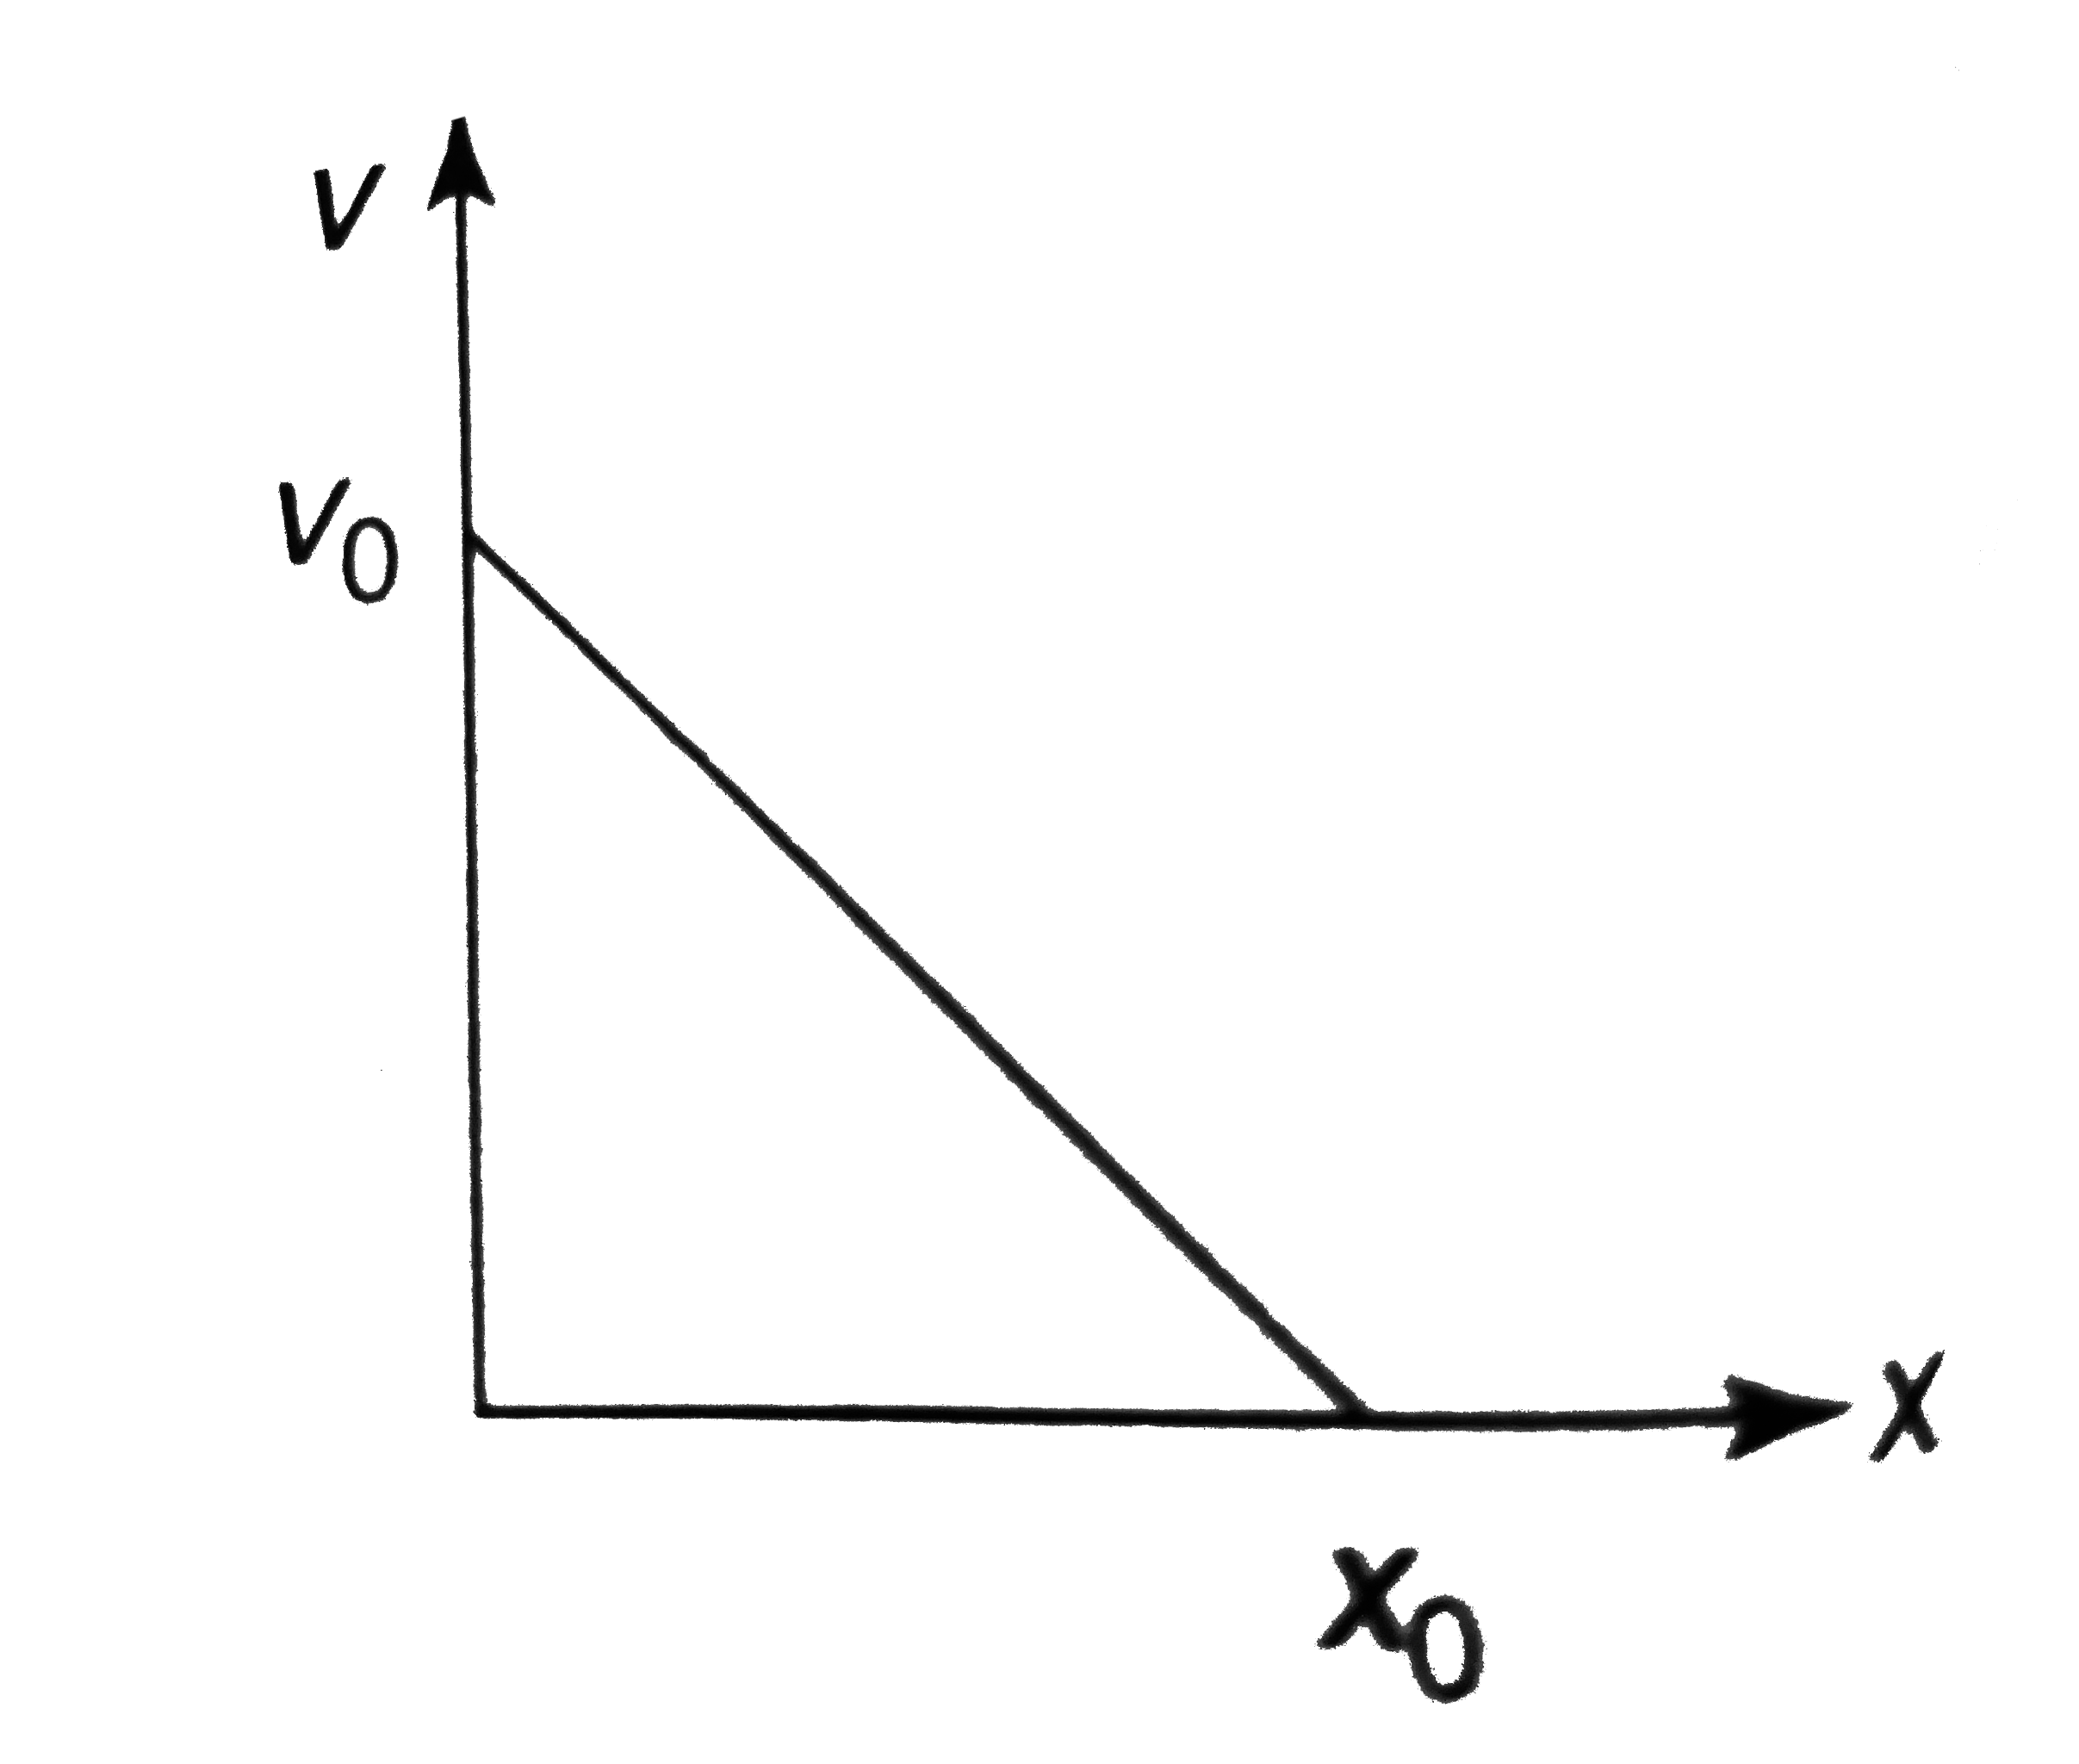
View SolutionThe velocity -displacement graph of a particle is as shown in the figure. Which of the following graphs correctly represents the variation of acceleration with displacement?

View Solution
Knowledge Check
Which of the following figure represents the variation of particle momentum and the associated de - Broglie wavelength ?
A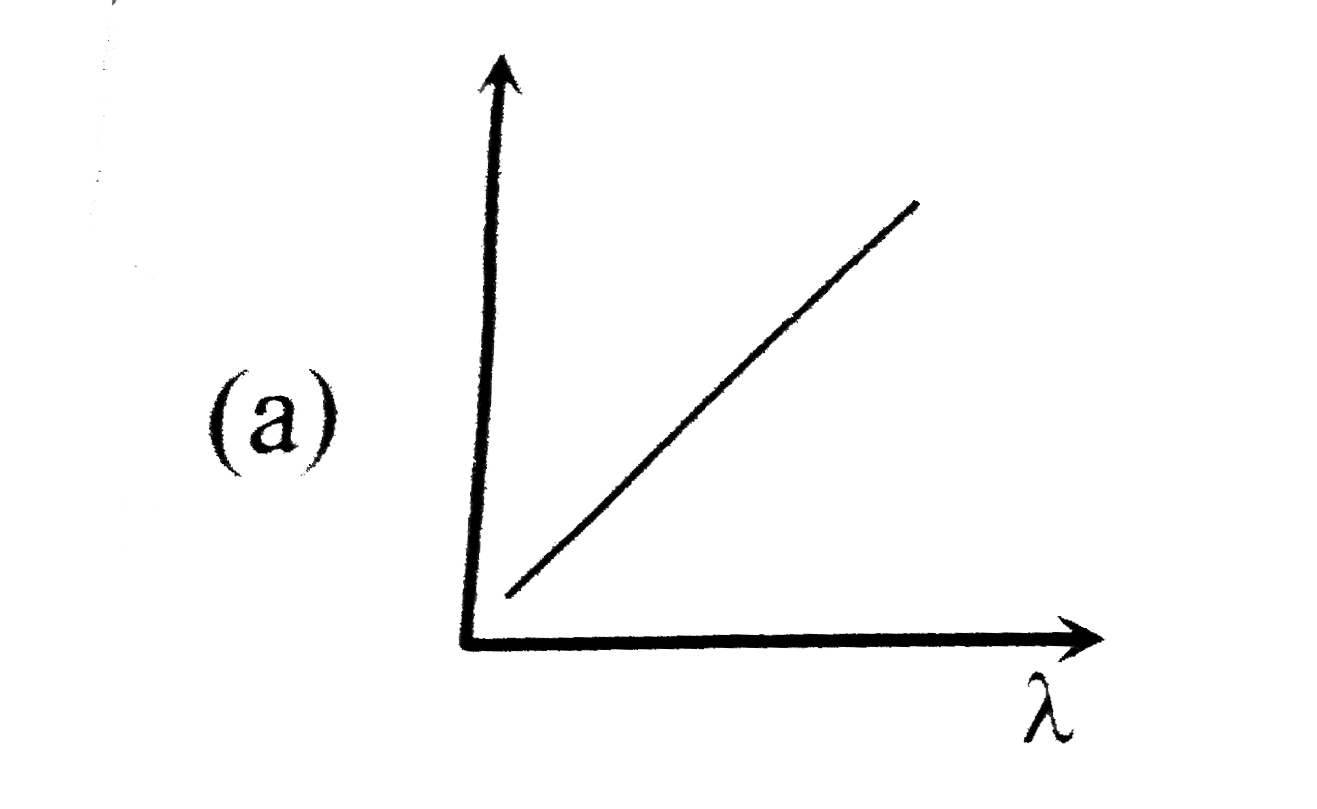 B
B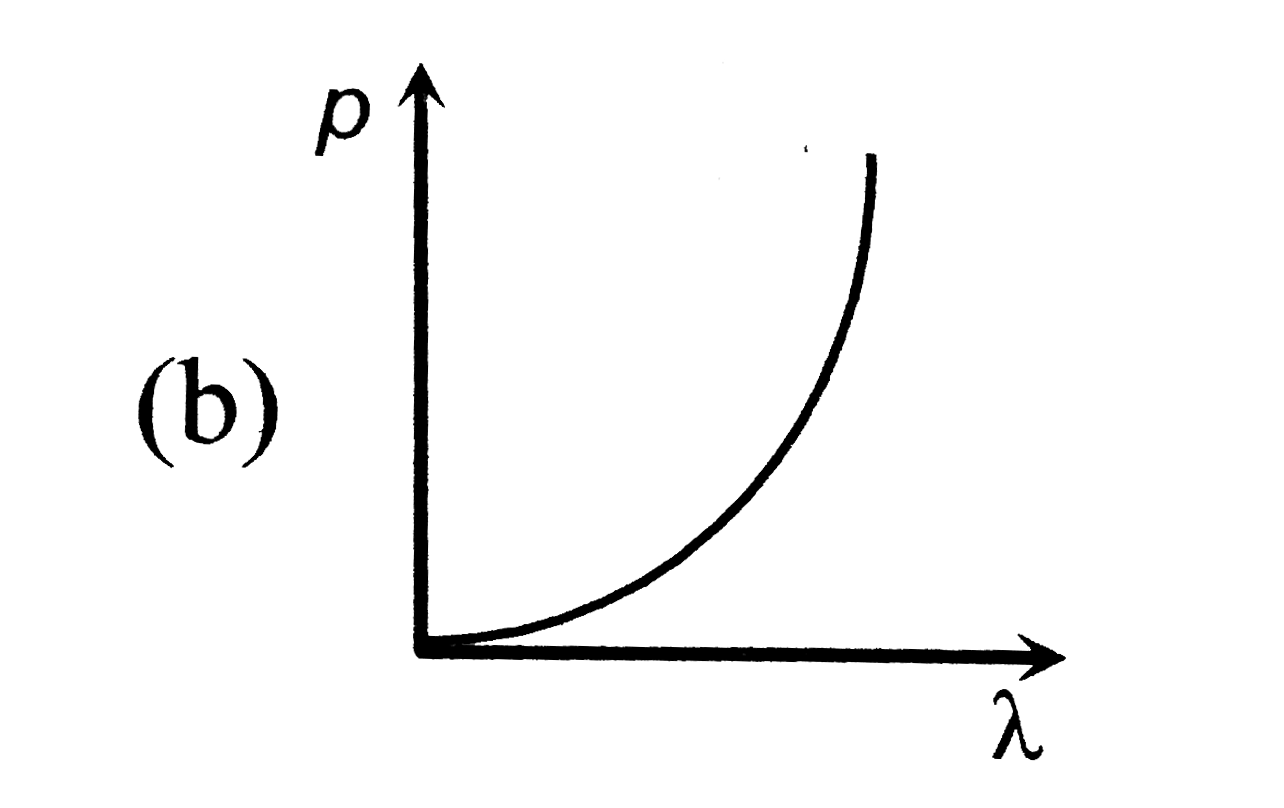 C
C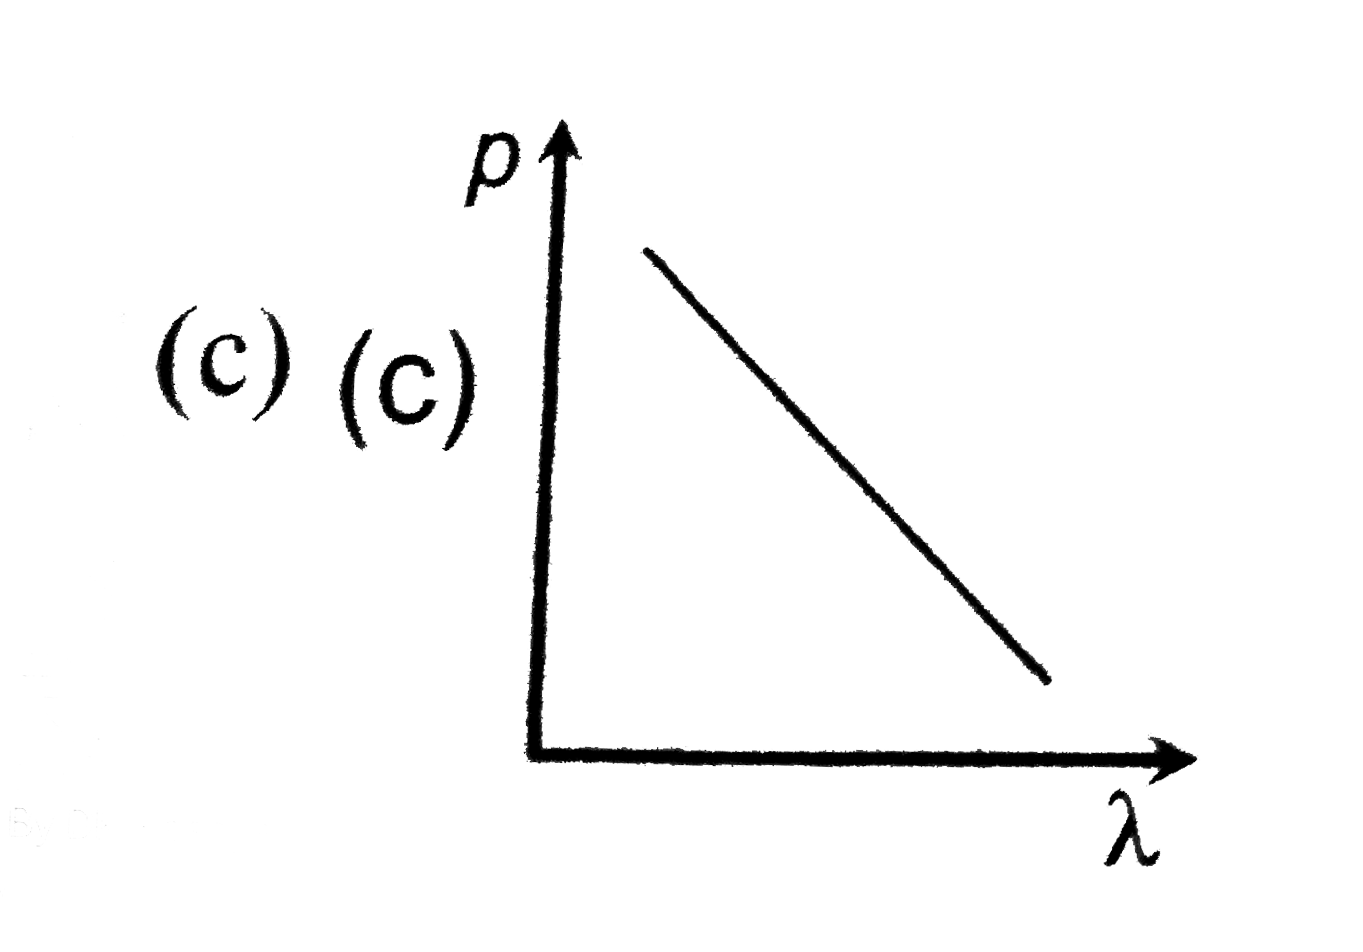 D
D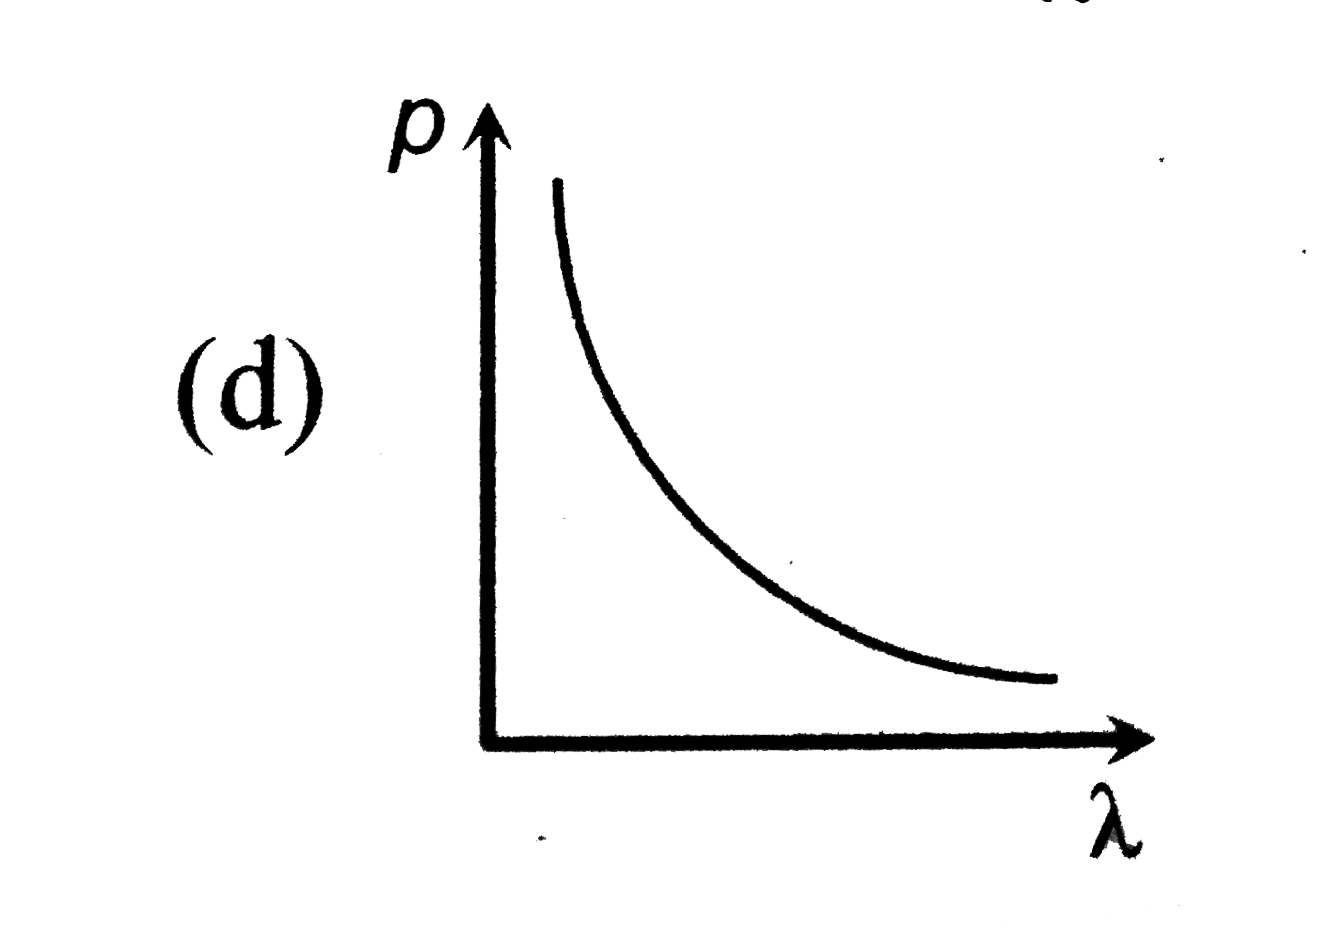
Which of the following graph represent the variation of particle momentum and associated de Broglie wavelength?
A B
B C
C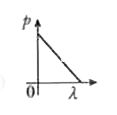 D
D
Which of the following figure represents the variation of particle momentum and the associated de - Broglie wavelength ?
A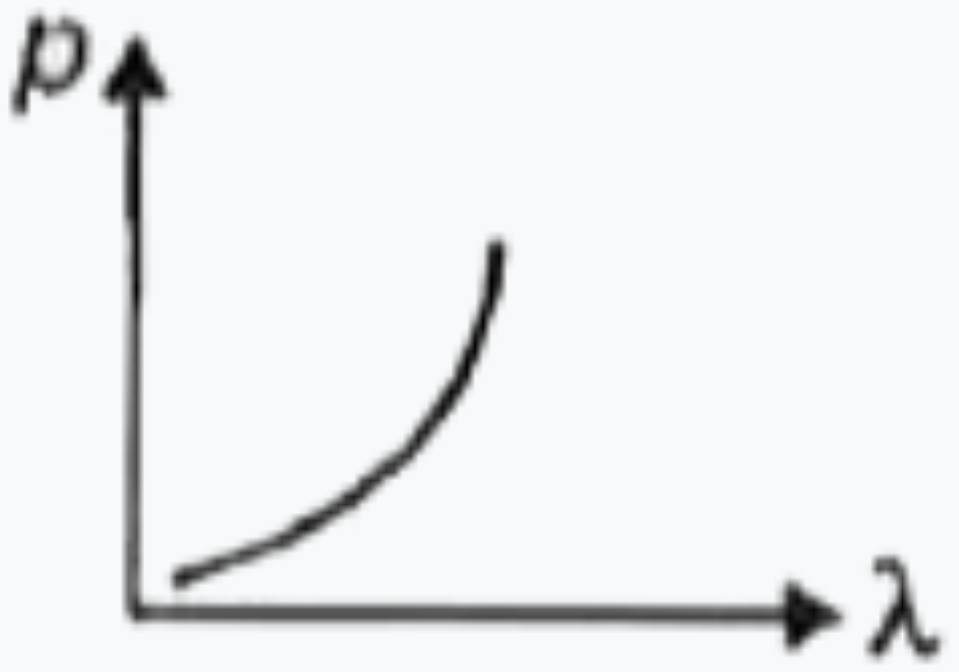 B
B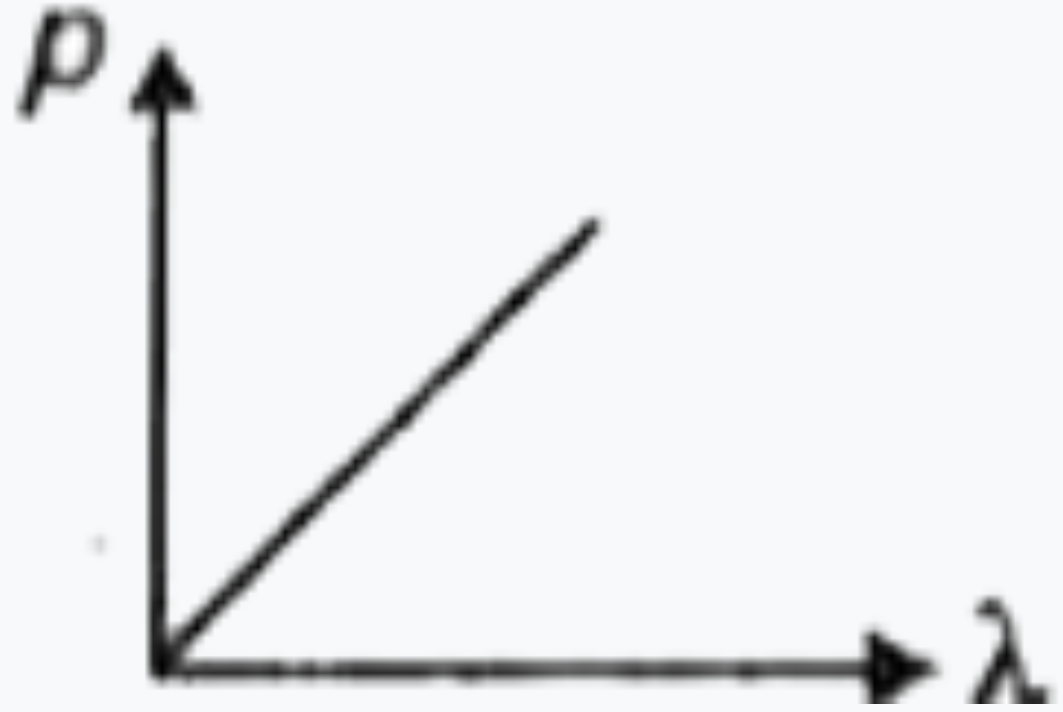 C
C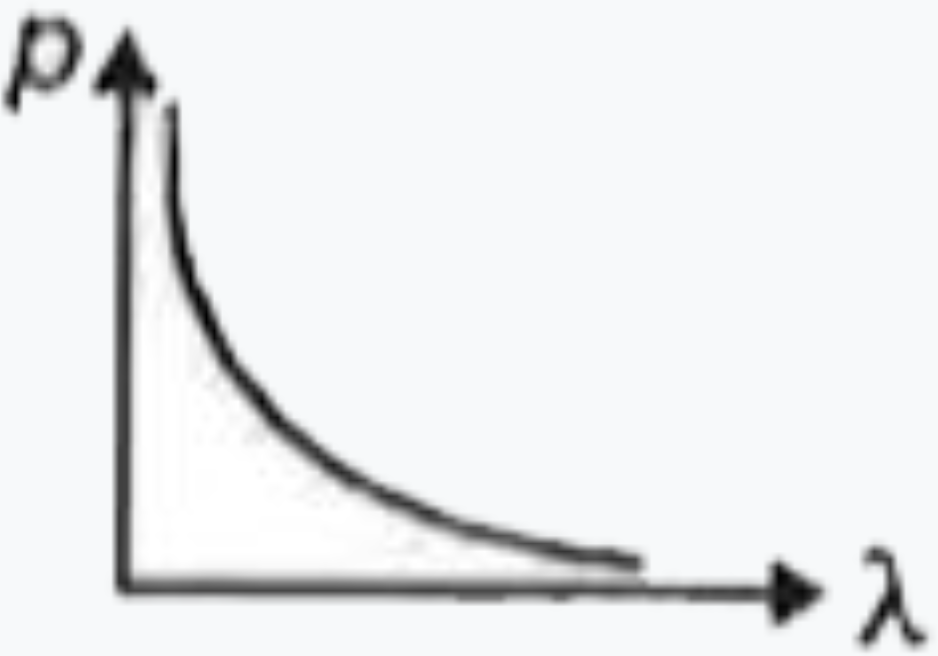 D
D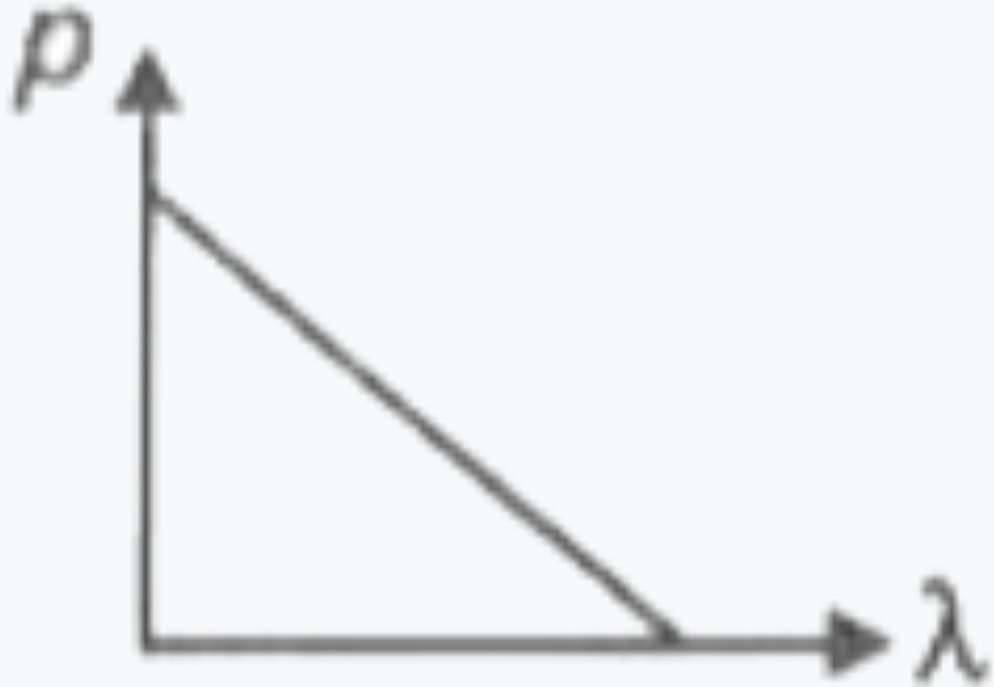
Which of the following figure represents the variation of particle momentum and the associated de - Broglie wavelength ?
View SolutionThe given graph shows the variation of velocity with displacement. Which one of the graphs given below correctly represents the variation of acceleration with displacement ?
View SolutionWhich one of the following correctly represents the variation between linear momentum (P) and kinetic energy (E) ofa body?
View SolutionThe momentum of a particle associated with de-Broglie's wavelength of 6Å is
View SolutionWhich of the following is correct regarding de-Broglie wavelength?
View Solution
