The following Bar Diagram depicts figures for some agricultural imports from January-May, 2008. Answer (as closely as possible) the questions using the date provided here
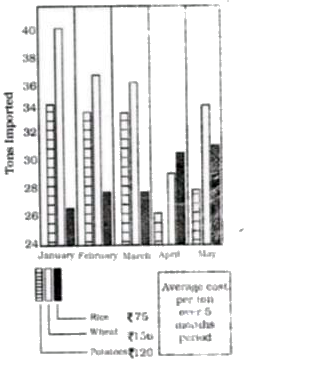
What was the total cost (in ) of wheat import in March?
3212
5616
7042
2224
The correct Answer is:B
Step by step video, text & image solution for The following Bar Diagram depicts figures for some agricultural imports from January-May, 2008. Answer (as closely as possible) the questions using the date provided here What was the total cost (in ) of wheat import in March? by Maths experts to help you in doubts & scoring excellent marks in Class 14 exams.
Similar Questions
The following diagram depicts various views of a cube. Each faces has some number, where as in cube 4, one face is blank. From the answer choices select the number that should come in the blank space.
Question Figures
 View Solution
The following bar-diagram shows total number of males and females in five different organisations. Study it carefully to answer the questions.
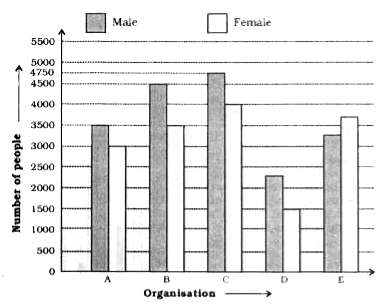
What is the difference between the total number of females and the total number of males from all the organisations together?View Solution
Knowledge Check
- Question 1 - Select One
The following Bar Diagram dpeicts figures for some agricultural imports from January-May, 2008. Answer (as closely as possible) the questions using the date provided here
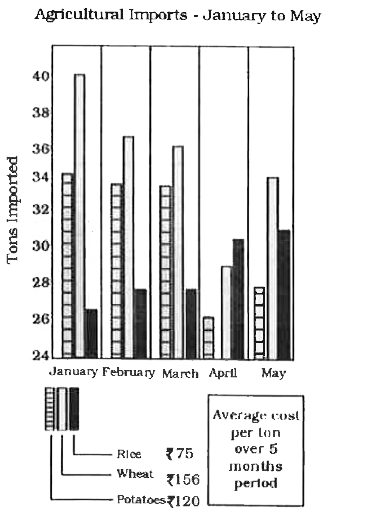
What was the total cost (in Rs) of wheat import in March?ARs 3,212BRs 5,616CRs 7,042DRs 2,224 - Question 2 - Select One
The following Bar Diagram dpeicts figures for some agricultural imports from January-May, 2008. Answer (as closely as possible) the questions using the date provided here
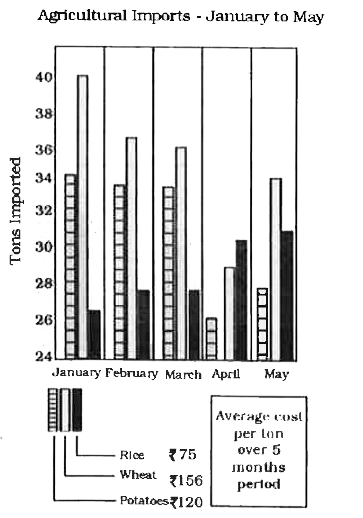
What is the average cost of potato import in February and March?A(a) Rs 3,960B(b) Rs 5,960C(c) Rs 1,280D(d) Rs 4,440 - Question 3 - Select One
The following bar diagram analys the sale of a company from 2000 to 2005, Examine the diagram and answer the questions.
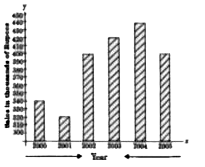
The sales in 2004 are what percentage of those in 2002?A40%B4%C110%D1.1%
The following bar diagram, represents the use of different modes of travel to school by students in a certain locality of the town. Study the graph and answer the questions.
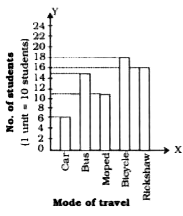
What is the percentage of students using Bus from that locality ?View SolutionThe following bar diagram, represents the use of different modes of travel to school by students in a certain locality of the town. Study the graph and answer the questions.
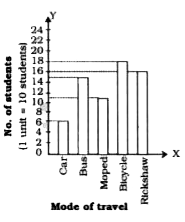
What is the ratio of the students using their means of transport as Car with those using Rickshaw ?View SolutionThe following bar diagram analys the sale of a company from 2000 to 2005, Examine the diagram and answer the questions.
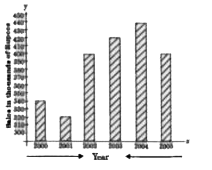
By what amount are the sales in 2003 more than those in 2001 ?View SolutionIn the following questions, the followIng Bar Diagram shows the percentage of 7 coloured balls sold in 5 shops A, B, C, D and E. Study the graph and answer. all the questions.
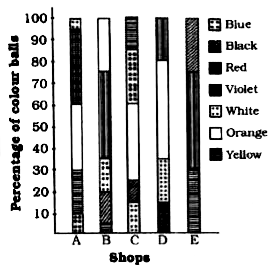
What fraction of the total percentage of colour balls is to the percentage of total yellow balls?View SolutionStudents from different countries (A,B,C,D,E,F) participated in a certain seminar.The pie- chart shows how many students came from each of the six participating countries.Study the diagram and answer the following questions.
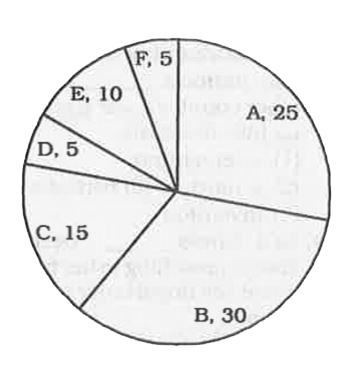
If the cost of total spending on transport for the seminar was Rs. 9 lakhs and the cost of hosting the students was Rs. 15000 per student then what was the ratio of hosting cost of all the students to that of spending on transport?View Solution
