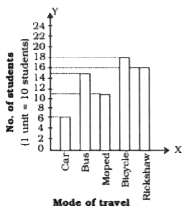
The following bar diagram, represents the use of different modes of travel to school by students in a certain locality of the town. Study the graph and answer the questions.
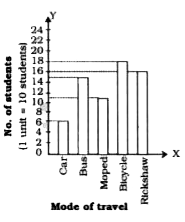
What is the ratio of the students using their means of transport as Car with those using Rickshaw ?
7:2
8:3
2:7
3:8
The correct Answer is:D
Step by step video, text & image solution for The following bar diagram, represents the use of different modes of travel to school by students in a certain locality of the town. Study the graph and answer the questions. What is the ratio of the students using their means of transport as Car with those using Rickshaw ? by Maths experts to help you in doubts & scoring excellent marks in Class 14 exams.
Updated on:21/07/2023Topper's Solved these Questions
- STATISTICS AND DATA INTERPRETATIONBook:KIRAN PUBLICATIONChapter:STATISTICS AND DATA INTERPRETATIONExercise:TYPE-III
Explore 39 Videos
- STATISTICS AND DATA INTERPRETATIONBook:KIRAN PUBLICATIONChapter:STATISTICS AND DATA INTERPRETATIONExercise:TYPE-IV
Explore 182 Videos
- STATISTICS AND DATA INTERPRETATIONBook:KIRAN PUBLICATIONChapter:STATISTICS AND DATA INTERPRETATIONExercise:TYPE-VIII
Explore 8 Videos
- SIMPLIFICATIONBook:KIRAN PUBLICATIONChapter:SIMPLIFICATIONExercise:TEST YOURSELF
Explore 25 Videos
- TIME AND DISTANCEBook:KIRAN PUBLICATIONChapter:TIME AND DISTANCEExercise:Type -XI
Explore 74 Videos
Similar Questions
The following bar graph represents the data for different sizes of shoes worn by the students in a school. Read the graph and answer the following questions.
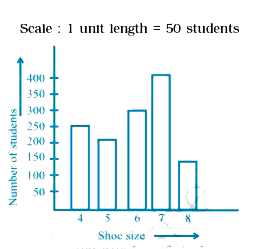
What is the number of students wearing shoe size 6?
View SolutionThe following bar graph represents the data for different sizes of shoes worn by the students in a school. Read the graph and answer the following questions.
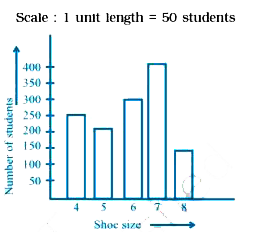
What are the different sizes of the shoes worn by the students?
View Solution
Knowledge Check
The following bar diagram, represents the use of different modes of travel to school by students in a certain locality of the town. Study the graph and answer the questions.
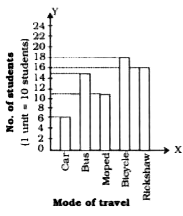
What is the percentage of students using Bus from that locality ?A221433%B1823%C22811%D0.22The following bar diagram, represents the use of different modes of travel to school by students in a certain locality of the town. Study the graph and answer the questions.
How many students are coming from that locality ?A500B600C560D660The following bar diagram, represents the use of different modes of travel to school by students in a certain locality of the town. Study the graph and answer the questions.
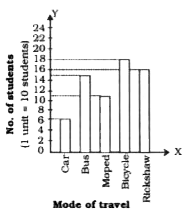
How many students use Bicycle and Rickshaw combined ?A240B340C140D440
The following bar graph represents the data for different sizes of shoes worn by the students in a school. Read the graph and answer the following questions.
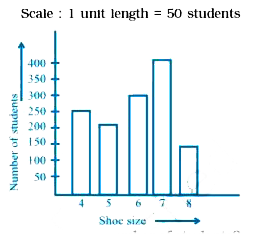
Which shoe size is worn by the maximum number of students?
View SolutionThe following bar graph represents the data for different sizes of shoes worn by the students in a school. Read the graph and answer the following questions.
(a) Find the number of students whose shoe sizes have been collected.
View SolutionThe following bar graph represents the data for different sizes of shoes worn by the students in a school. Read the graph and answer the following questions.
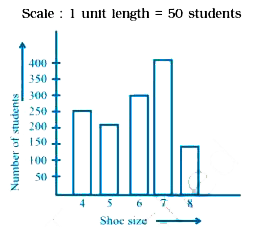
Which shoe size is worn by minimum number of students?
View SolutionStudy the following bar graph and answer the questions given below.
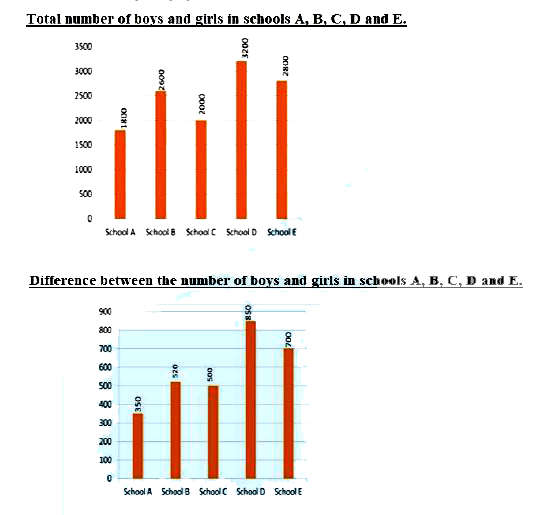
What is the ratio of numbers of boys to the number of girls in school E?
View SolutionThe following graph represents the transport used by children. Study the graph and answer the given questions.
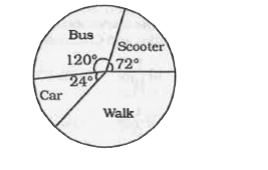
What is the percentage of children using scooter ?
View Solution
