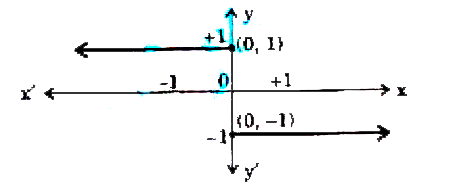
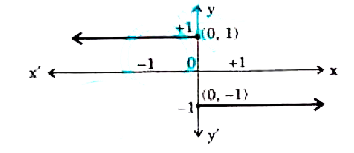
A body is stationary. Which of the graphs shown here is a graph of distance against time for this motion?


The correct Answer is:D
To solve the question about which graph represents a stationary body in a distance vs. time graph, we can follow these steps:
1. Understand the Concept of Stationary Motion:
- A body is said to be stationary when it is at rest. This means that it does not change its position over time.
2. Analyze the Definition of Distance vs. Time:
- In a distance vs. time graph, the y-axis represents distance and the x-axis represents time.
- For a stationary body, the distance does not change as time progresses.
3. Identify the Characteristics of the Graph:
- If the body is stationary, the distance should remain constant regardless of the time elapsed. This means that the graph should be a horizontal line.
4. Examine the Given Graph Options:
- Graph 1: Distance increases with time (not stationary).
- Graph 2: Distance decreases with time (not stationary).
- Graph 3: Distance increases non-uniformly with time (not stationary).
- Graph 4: Distance remains constant as time increases (this represents a stationary body).
5. Select the Correct Graph:
- Based on the analysis, Graph 4 is the correct representation of a stationary body, as it shows that the distance does not change over time.
Final Answer:
The correct graph that represents a stationary body in a distance vs. time graph is Graph 4.
---
- A body is said to be stationary when it is at rest. This means that it does not change its position over time.
- In a distance vs. time graph, the y-axis represents distance and the x-axis represents time.
- For a stationary body, the distance does not change as time progresses.
- If the body is stationary, the distance should remain constant regardless of the time elapsed. This means that the graph should be a horizontal line.
- Graph 1: Distance increases with time (not stationary).
- Graph 2: Distance decreases with time (not stationary).
- Graph 3: Distance increases non-uniformly with time (not stationary).
- Graph 4: Distance remains constant as time increases (this represents a stationary body).
- Based on the analysis, Graph 4 is the correct representation of a stationary body, as it shows that the distance does not change over time.
The correct graph that represents a stationary body in a distance vs. time graph is Graph 4.
Topper's Solved these Questions
Similar Questions
Knowledge Check
A body moves with uniform velocity. Which of the graphs shown here is a graph of velocity against time for this motion?
A B
B C
C D
D
Which of the following represents distance(s)-time(t) graph for a retarded motion?
A B
B C
C D
D
Which of the following velocity-time graphs shows a realistic situation for a body in motion ?
A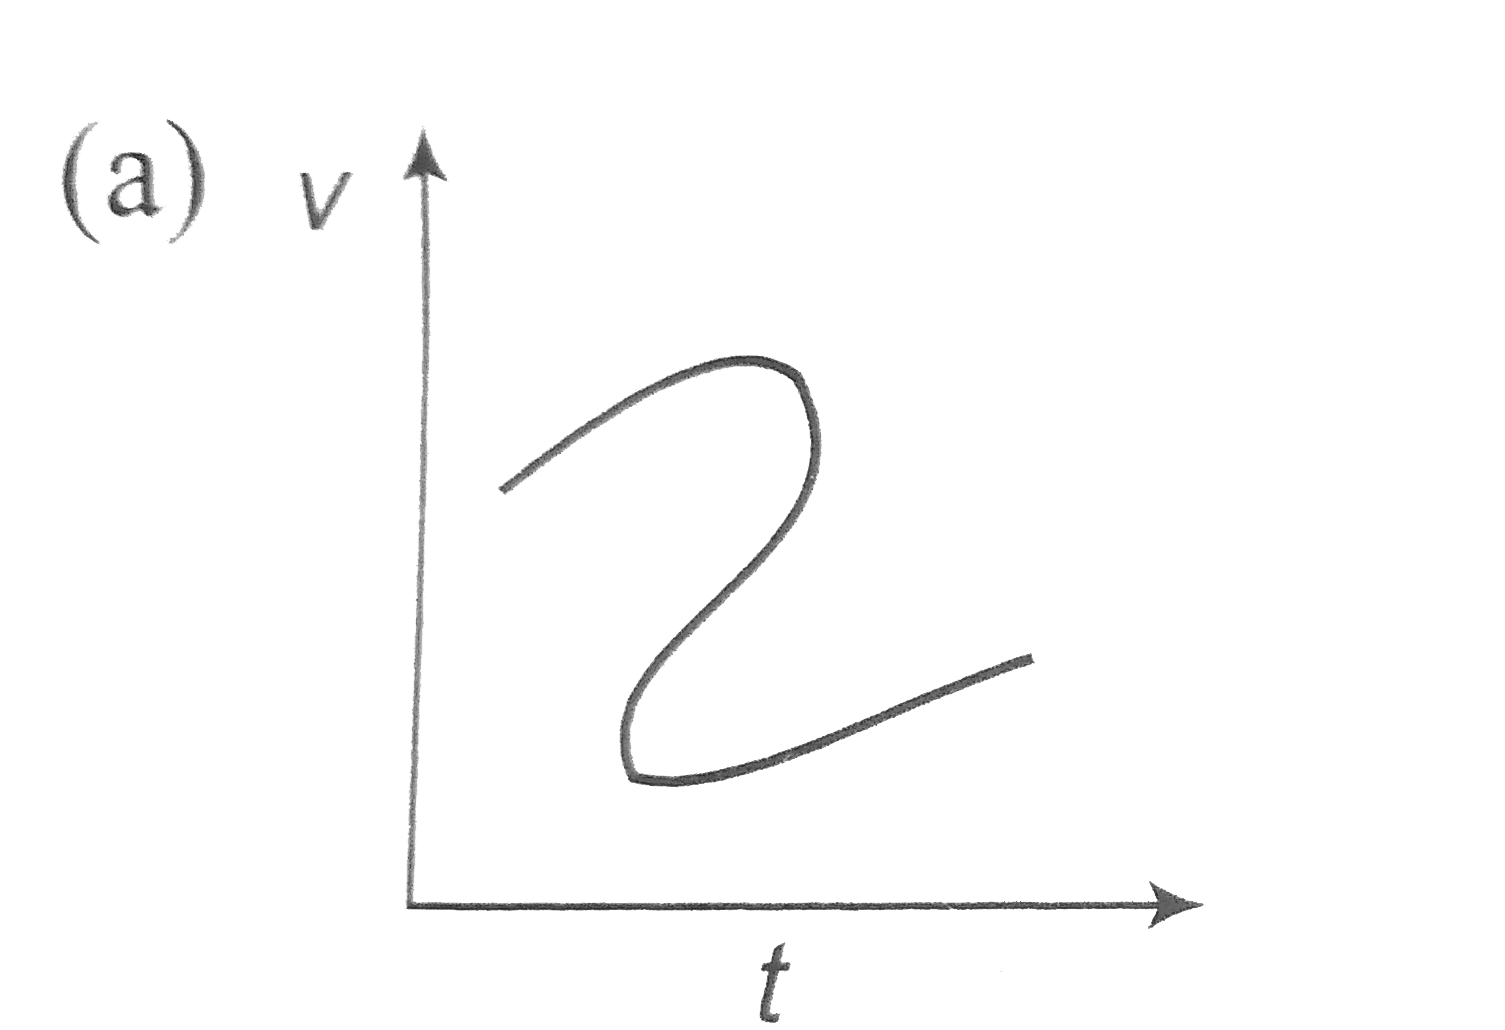 B
B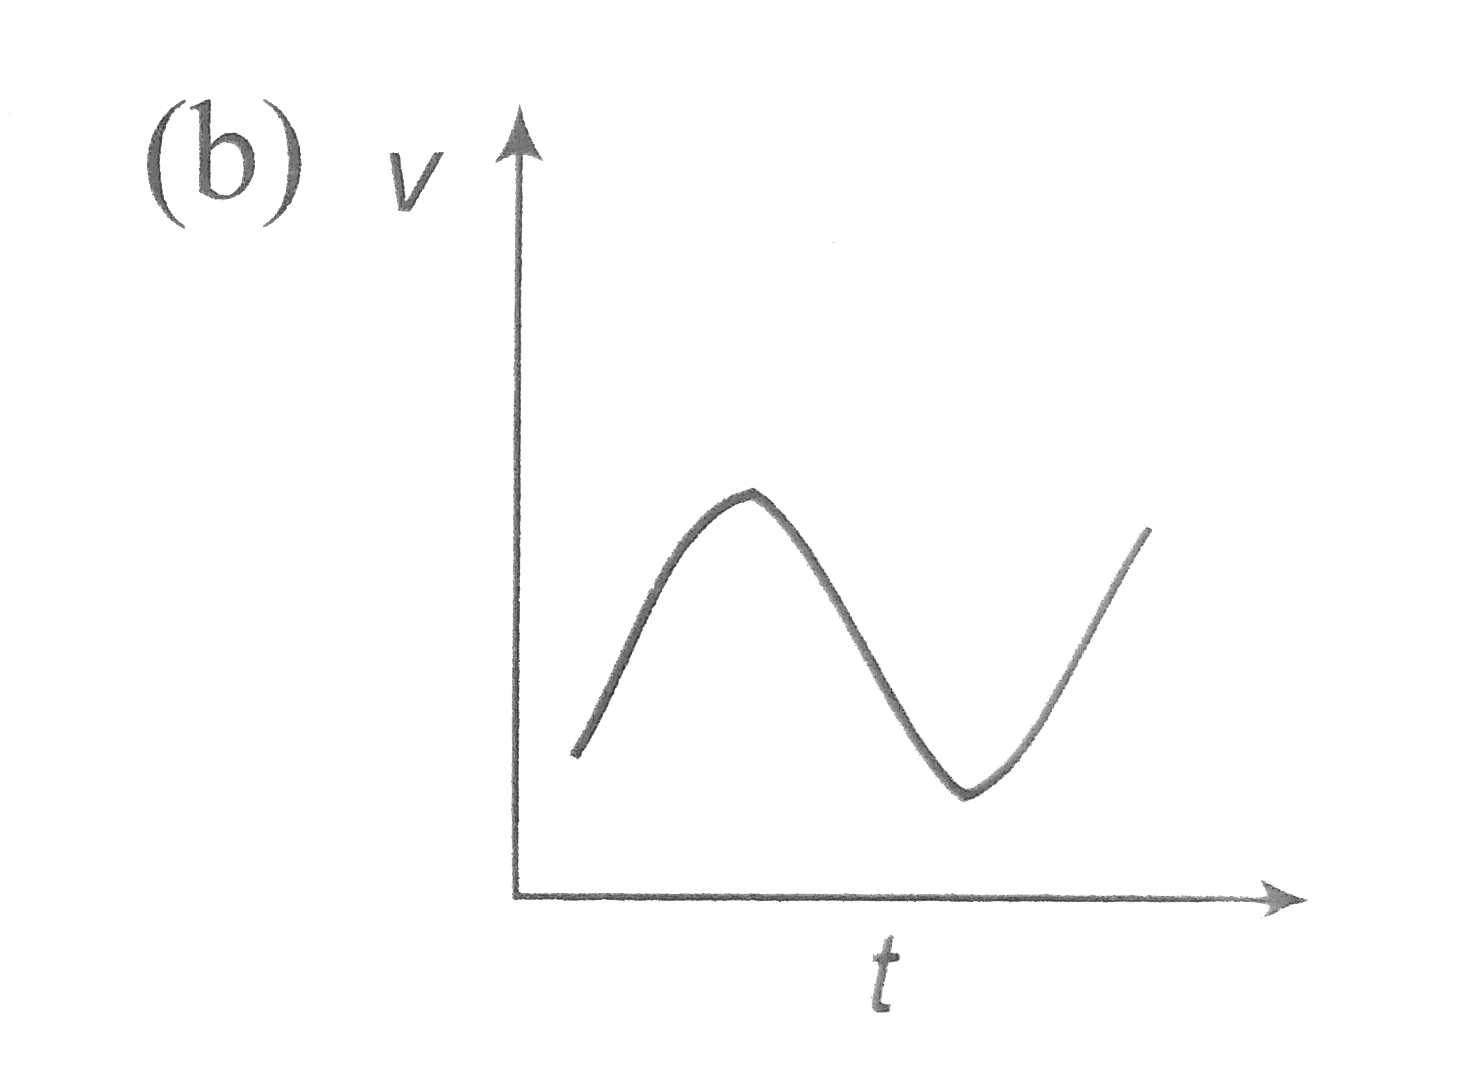 .C
.C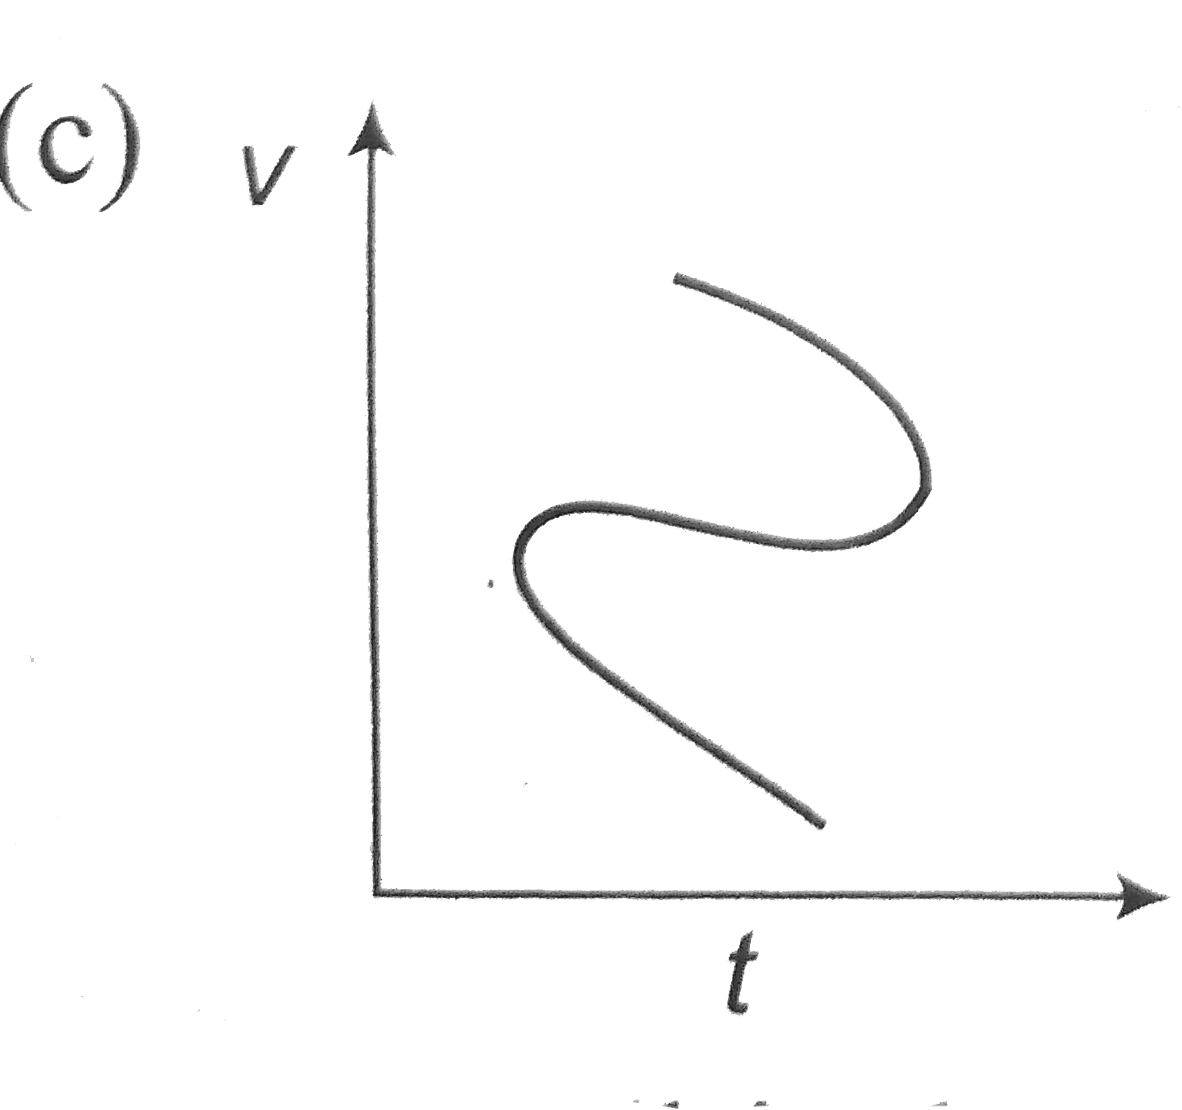 .D
.D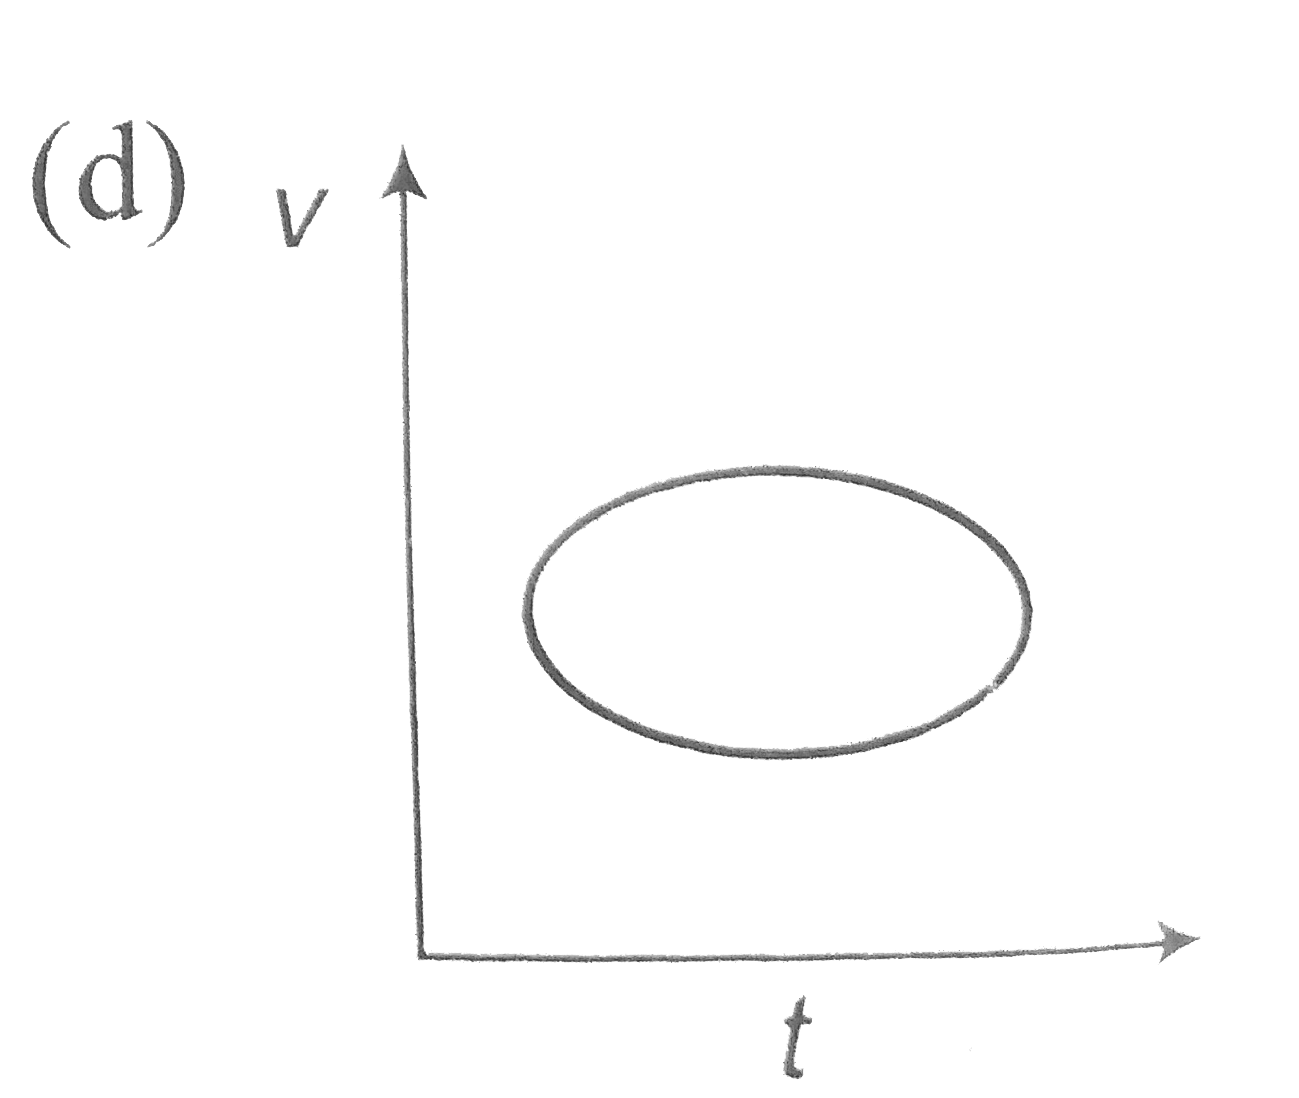 .
.
The graph of (y−x) against (y+x) is shown below.
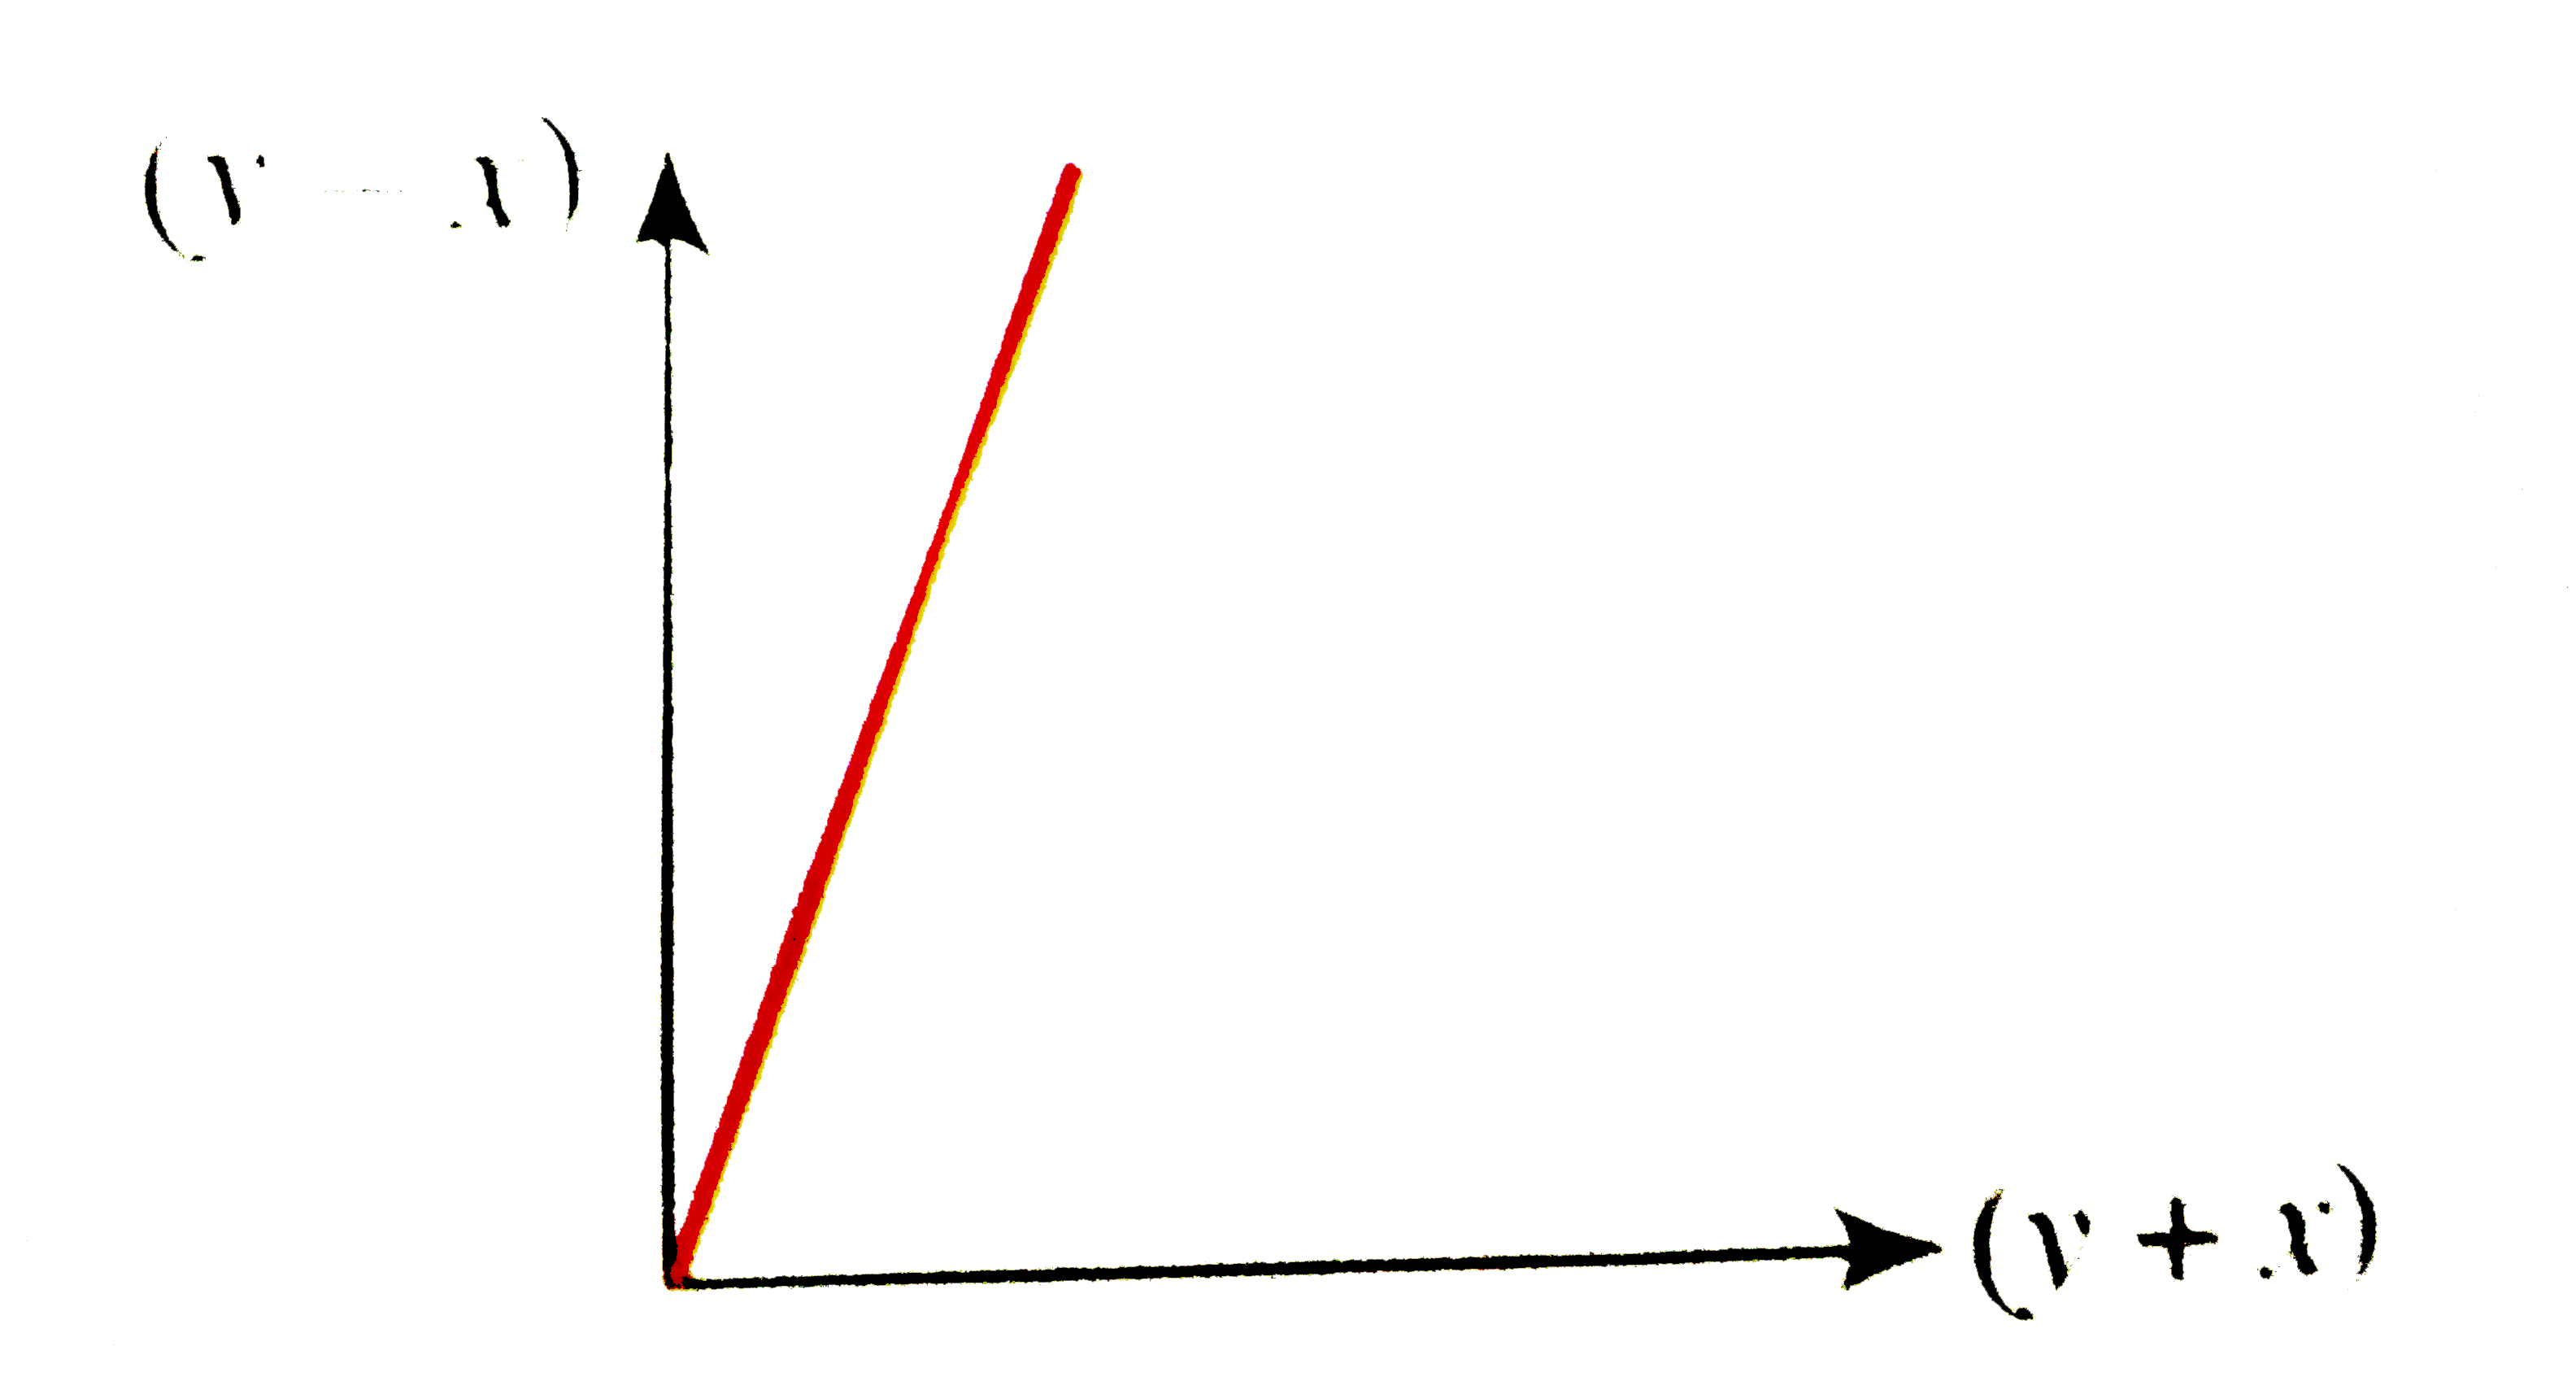
Which one of the following shows the graph of y against x ?
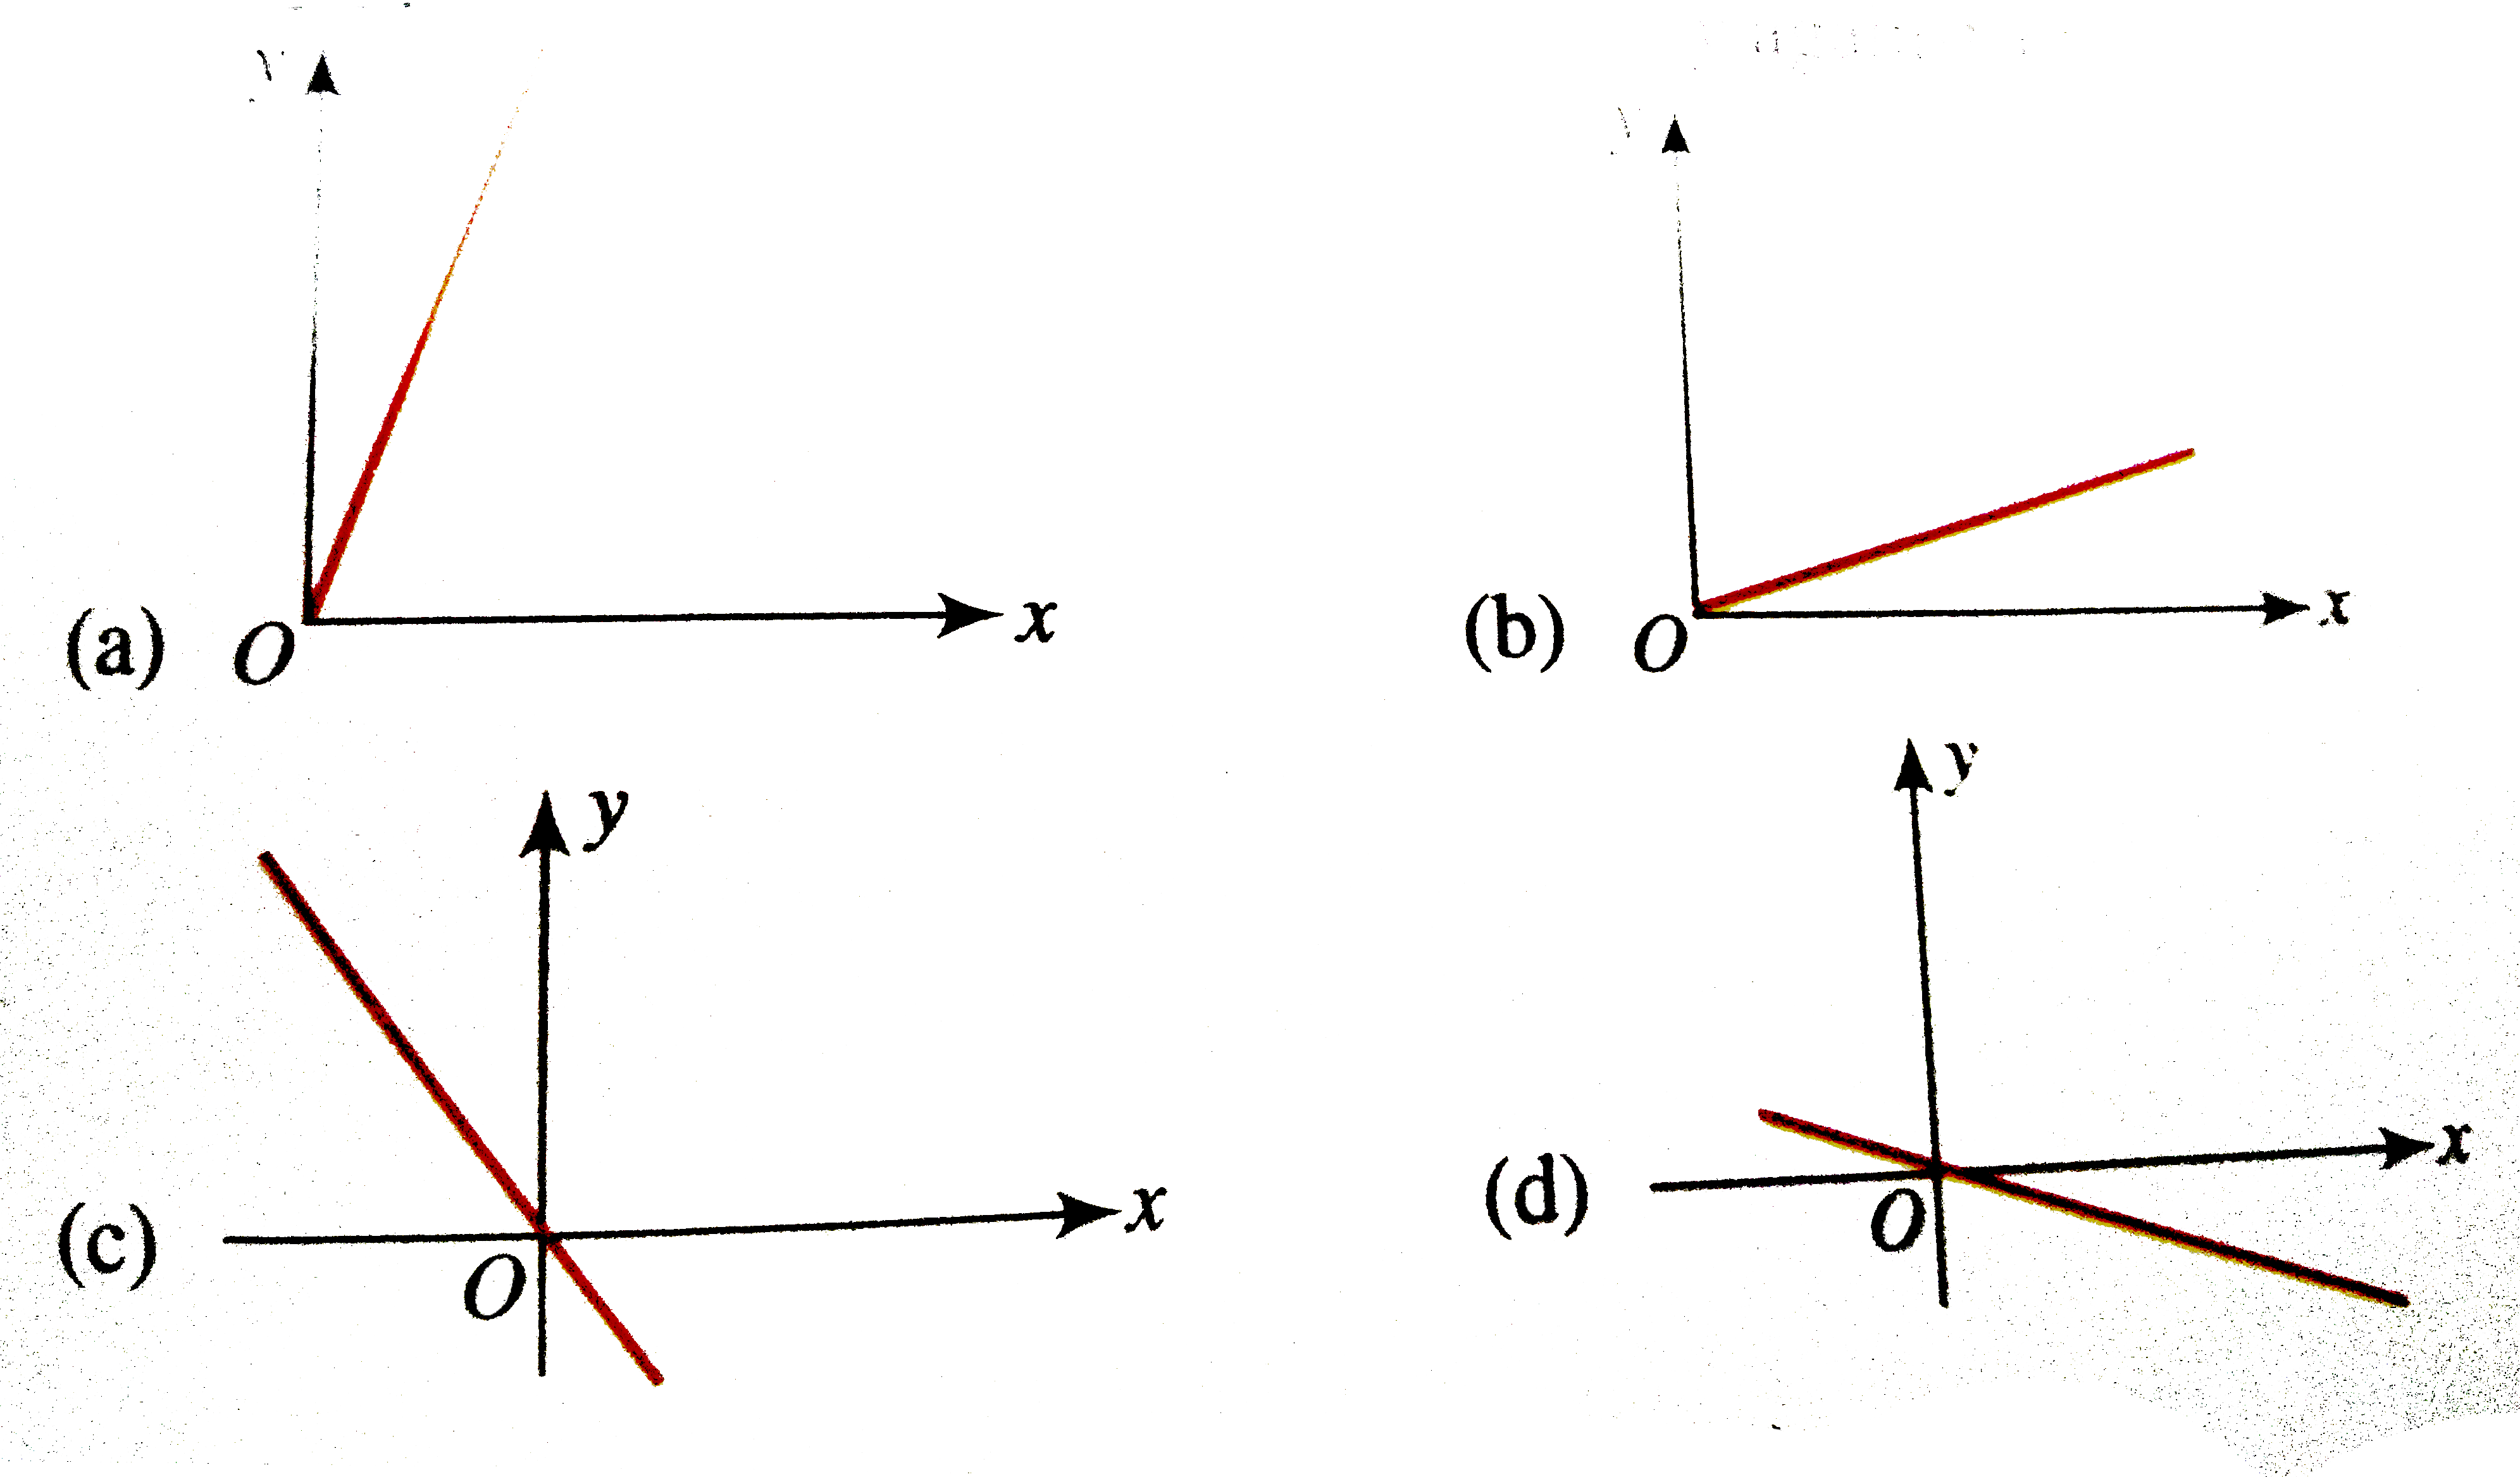
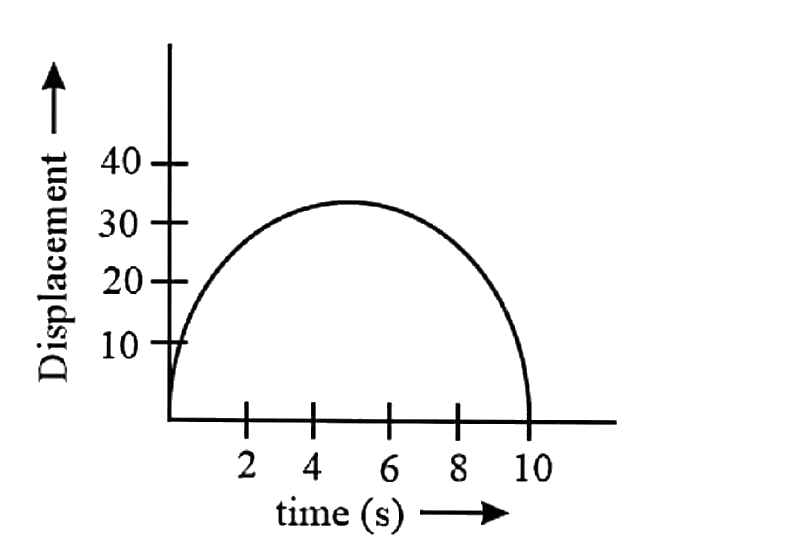
View SolutionThe displacement-time of a moving object is shown in figure. Which of the velocity-time graphs shown in figure could represent the motion of the same body?
View SolutionWhich of the following velocity-time graphs shows a realistic situation for a body in motion ?
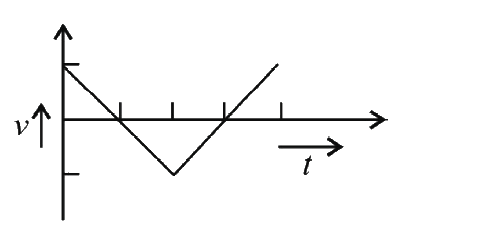
View SolutionThe graph in figure shows the velocity v versus time t for a body. Which of the graphs shown in figure represents the corresponding acceleration versus time graphs ?
View SolutionThe graph of distance -time graph for uniform motion for an object is
View Solution

