The velocity-time graph of a particle moving along the x-axis is as shown in Fig. 4.1.33. Calculate
The distance travelled and the displacement of the particle in 10 s.
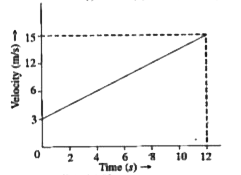
S= Area of trapezium
12×(3+15)/2=108m.
Related Playlists
- BOOK - ICSECHAPTER - DYNAMICSEXERCISE - SHORT ANSWER QUESTIONS WITH ANSWERES43videos
DYNAMICS
- BOOK - ICSECHAPTER - DYNAMICSEXERCISE - SHORT ANSWER QUESTIONS WITH ANSWERS12videos
DYNAMICS
- BOOK - ICSECHAPTER - DYNAMICSEXERCISE - VERY SHORT ANSWER QUESTIONS60videos
DYNAMICS
- BOOK - ICSECHAPTER - DIMENSIONSEXERCISE - SELECTED PROBLEMS (FROM CONVERSIONS OF ONE SYSTEMS OF UNITS INTO ANOTHER)9videos
DIMENSIONS
- BOOK - ICSECHAPTER - FRICTIONEXERCISE - Selected problems30videos
FRICTION
Knowledge Check
- Question 1 - Select One
The figure shows a velocity-time graph of a particle moving along a straight line
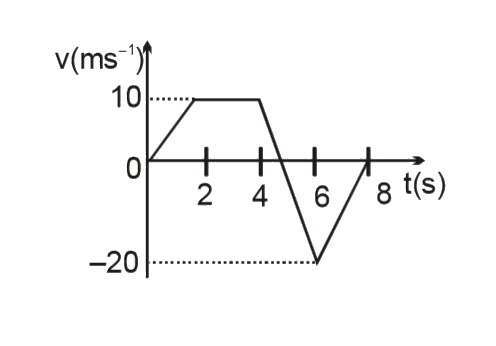
Q. The total distance travelled by the particle isA66.6 mB51.6 mCzeroD36.6m - Question 1 - Select One
The figure shows a velocity-time graph of a particle moving along a straight line
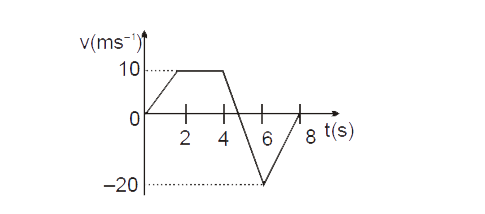
The total distance travelled by the particle isA66.6 mB51.6 mCzeroD36.6m
Similar Questions
The velocity-time graph of a particle moving along a straight line is shown id Fig. 2 (b) . 33. Calculate the distance covered between t=0 to t=10seconds. Also find displacement tn time 0→10seconds.
 .View Solution
The velocity-time graph of a particle moving in a staight line is shown in the . Find the displacement and the distance trav elled by the particle in 6s.
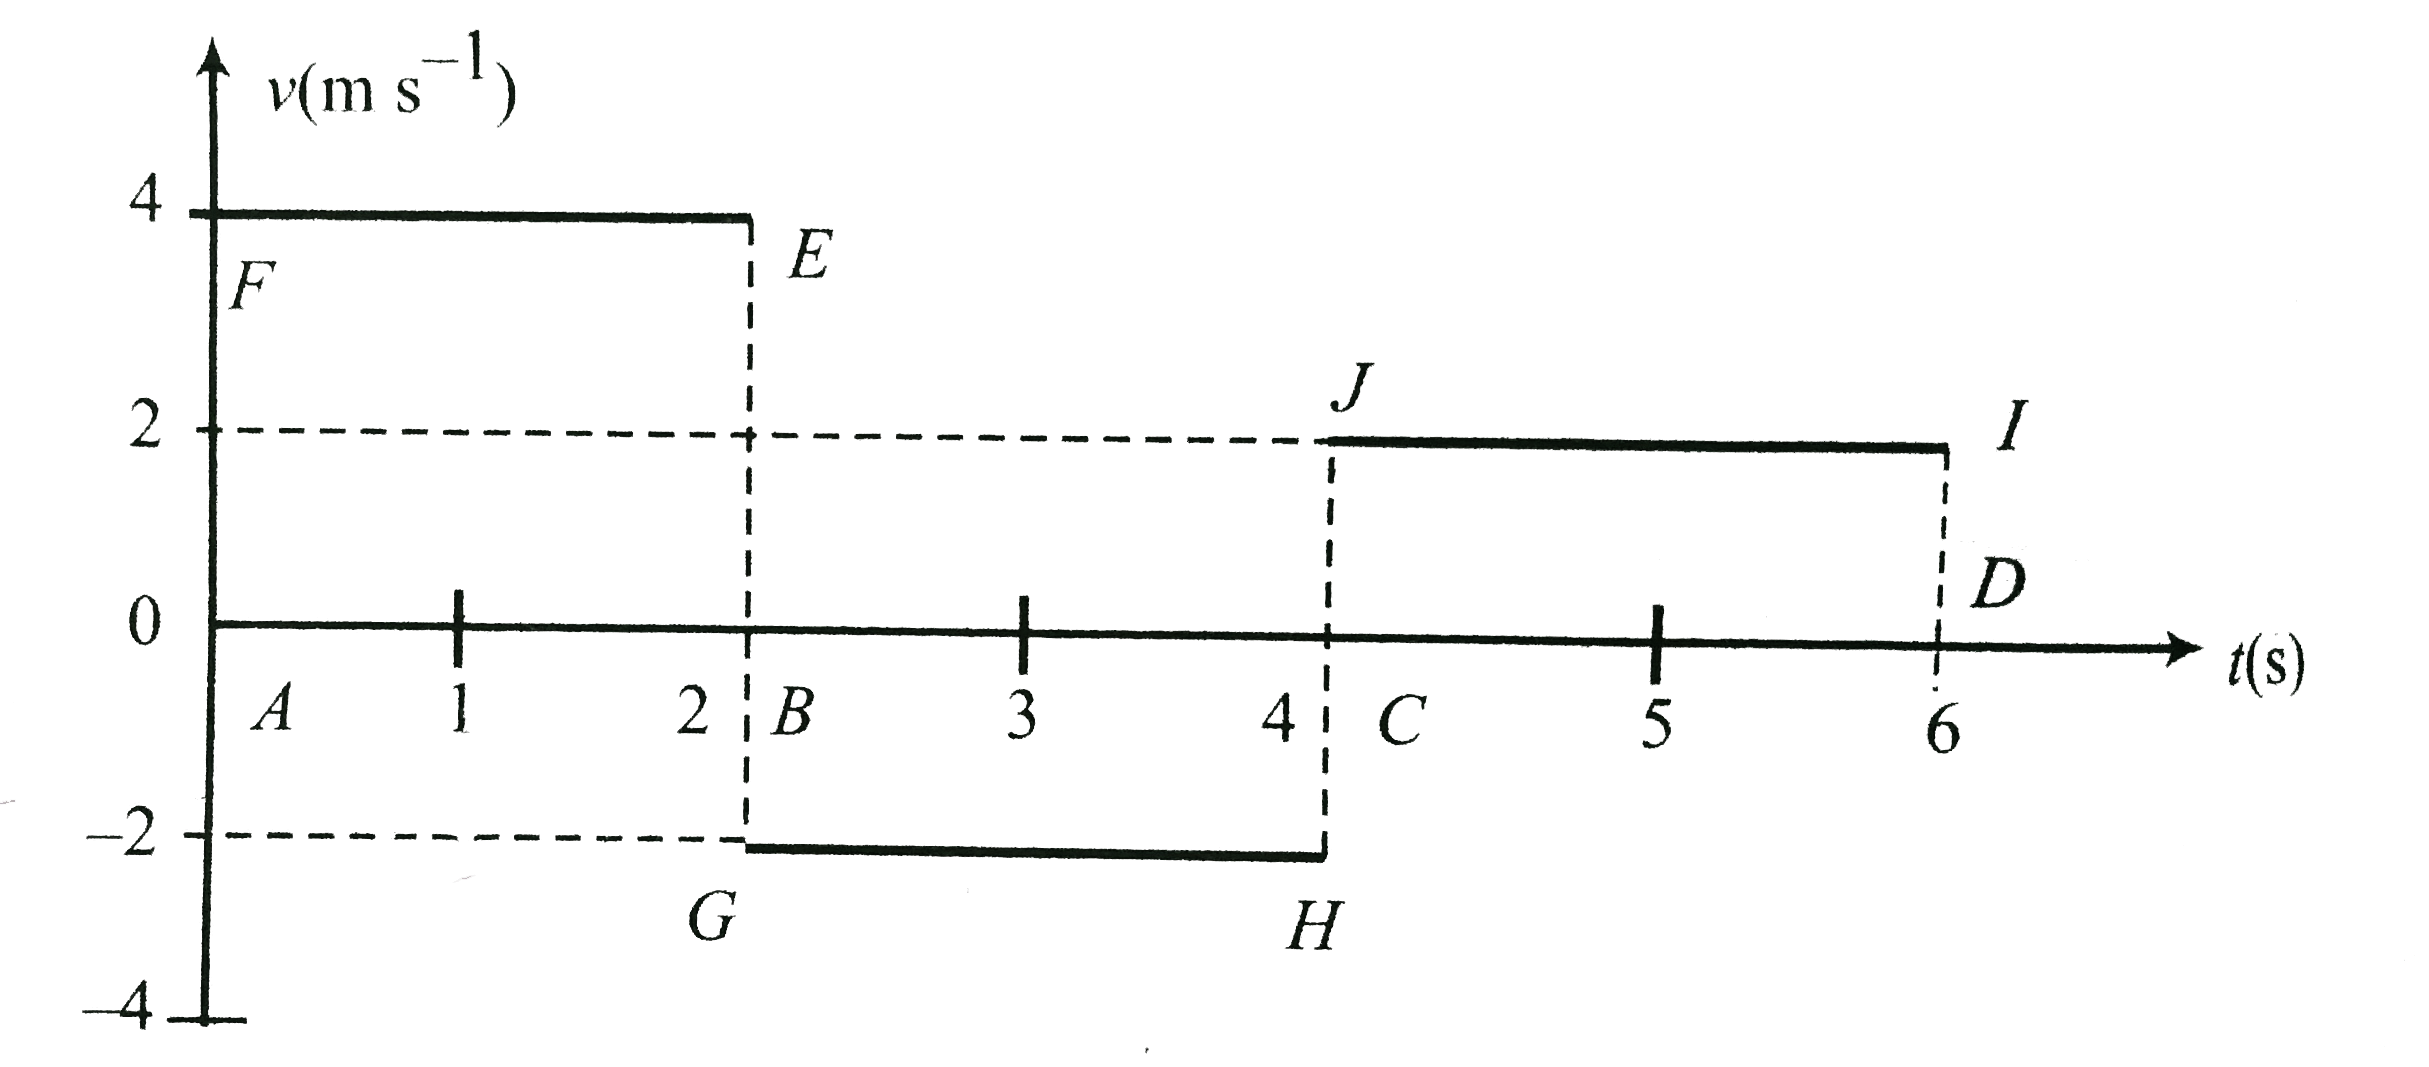 .View Solution
The velocity-time graph of a particle moving in a staight line is shown in the . Find the displacement and the distance trav elled by the particle in 6s.
 .View Solution
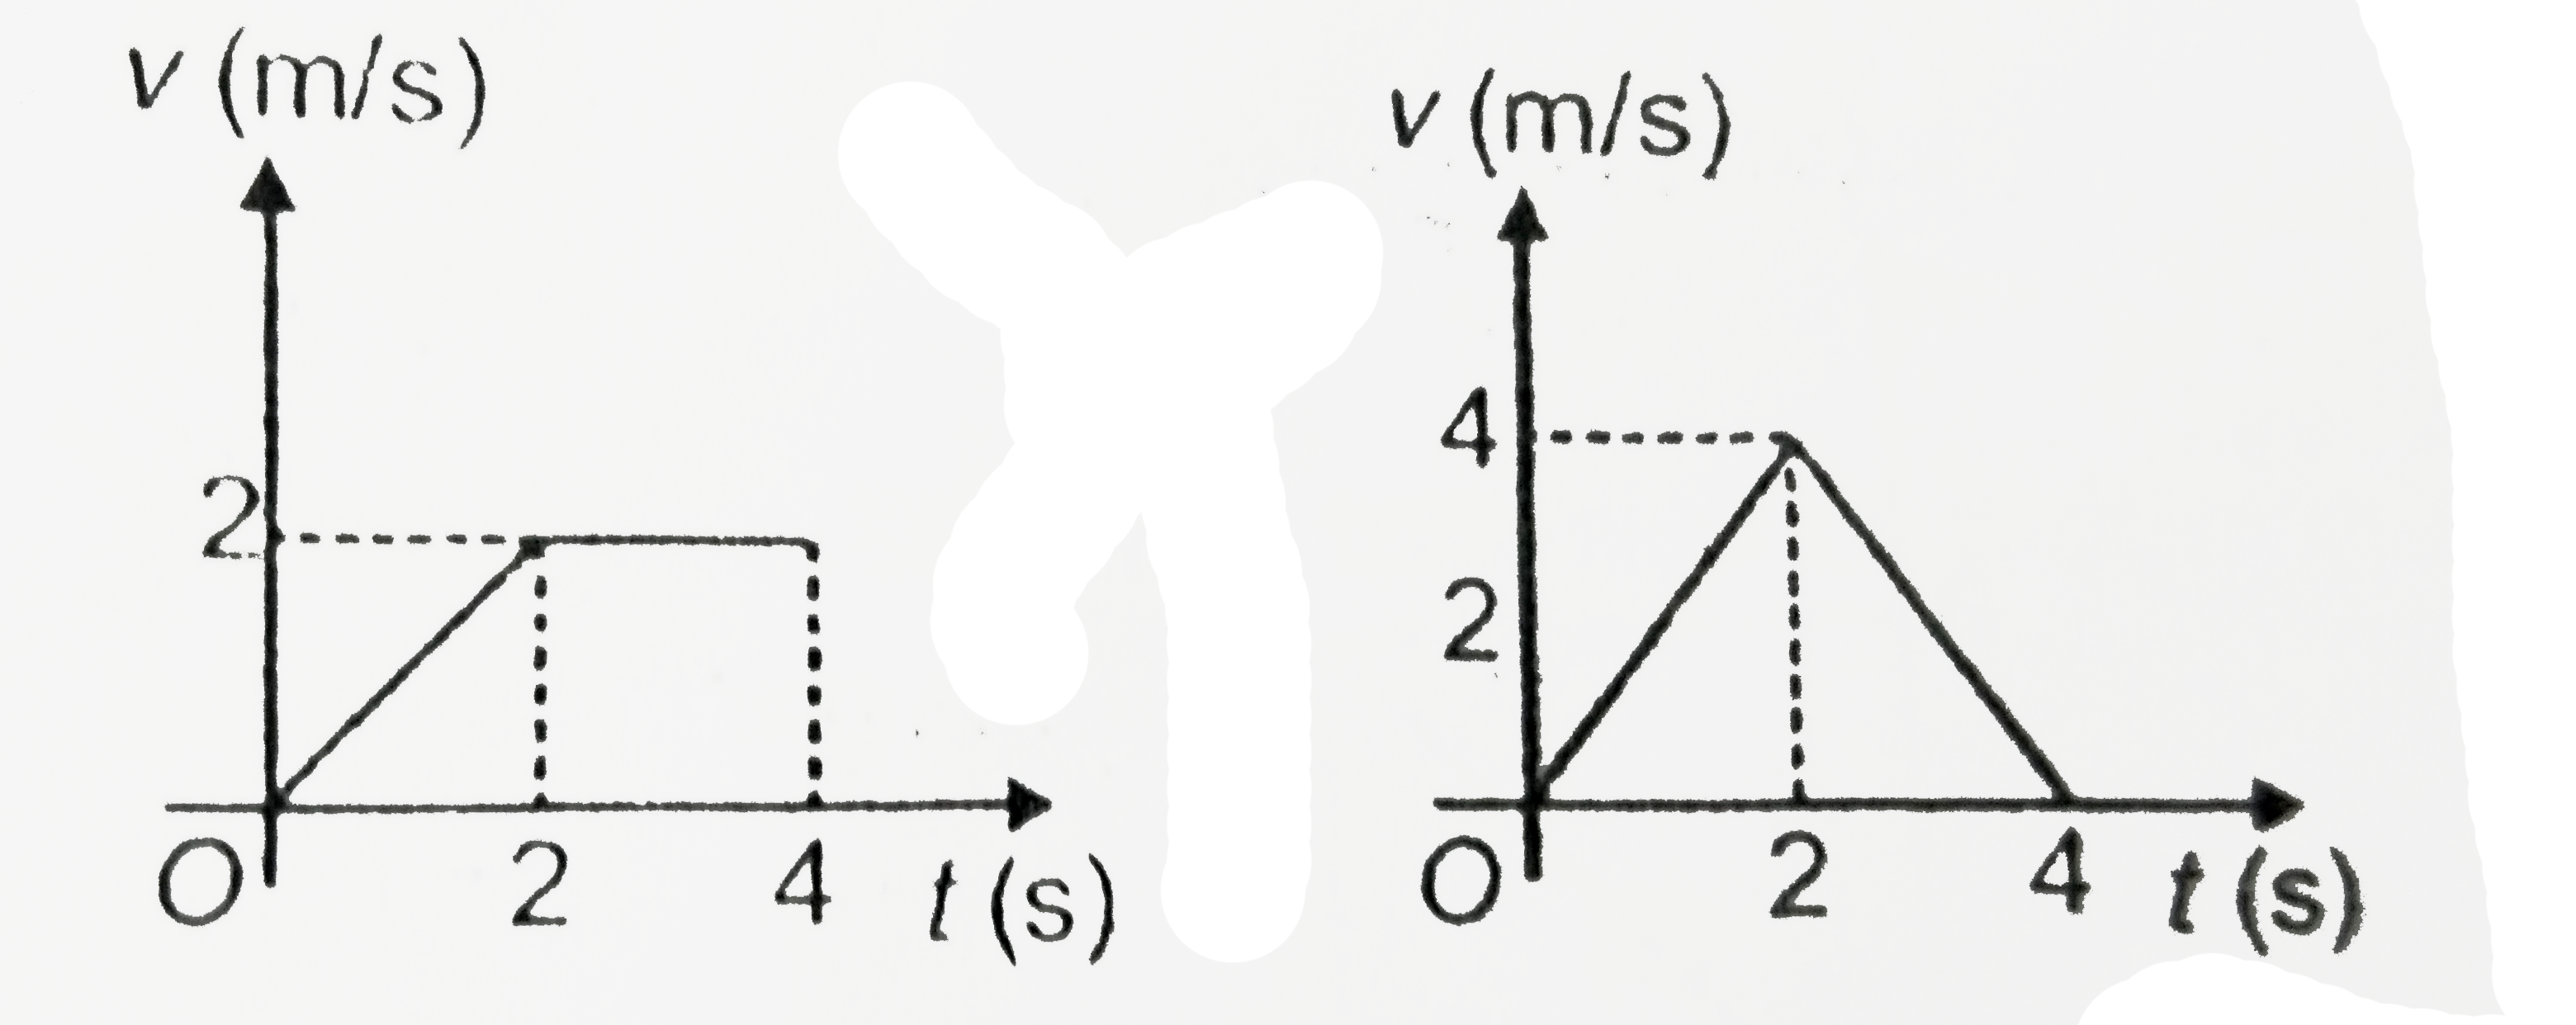
The velocity versus time graph of two particles moving along x-axis varies are shown in the following two plots. Then
 View Solution
The velocity versus time graph of two particles moving along x-axis varies are shown in the following two plots. Then
 View Solution
figure
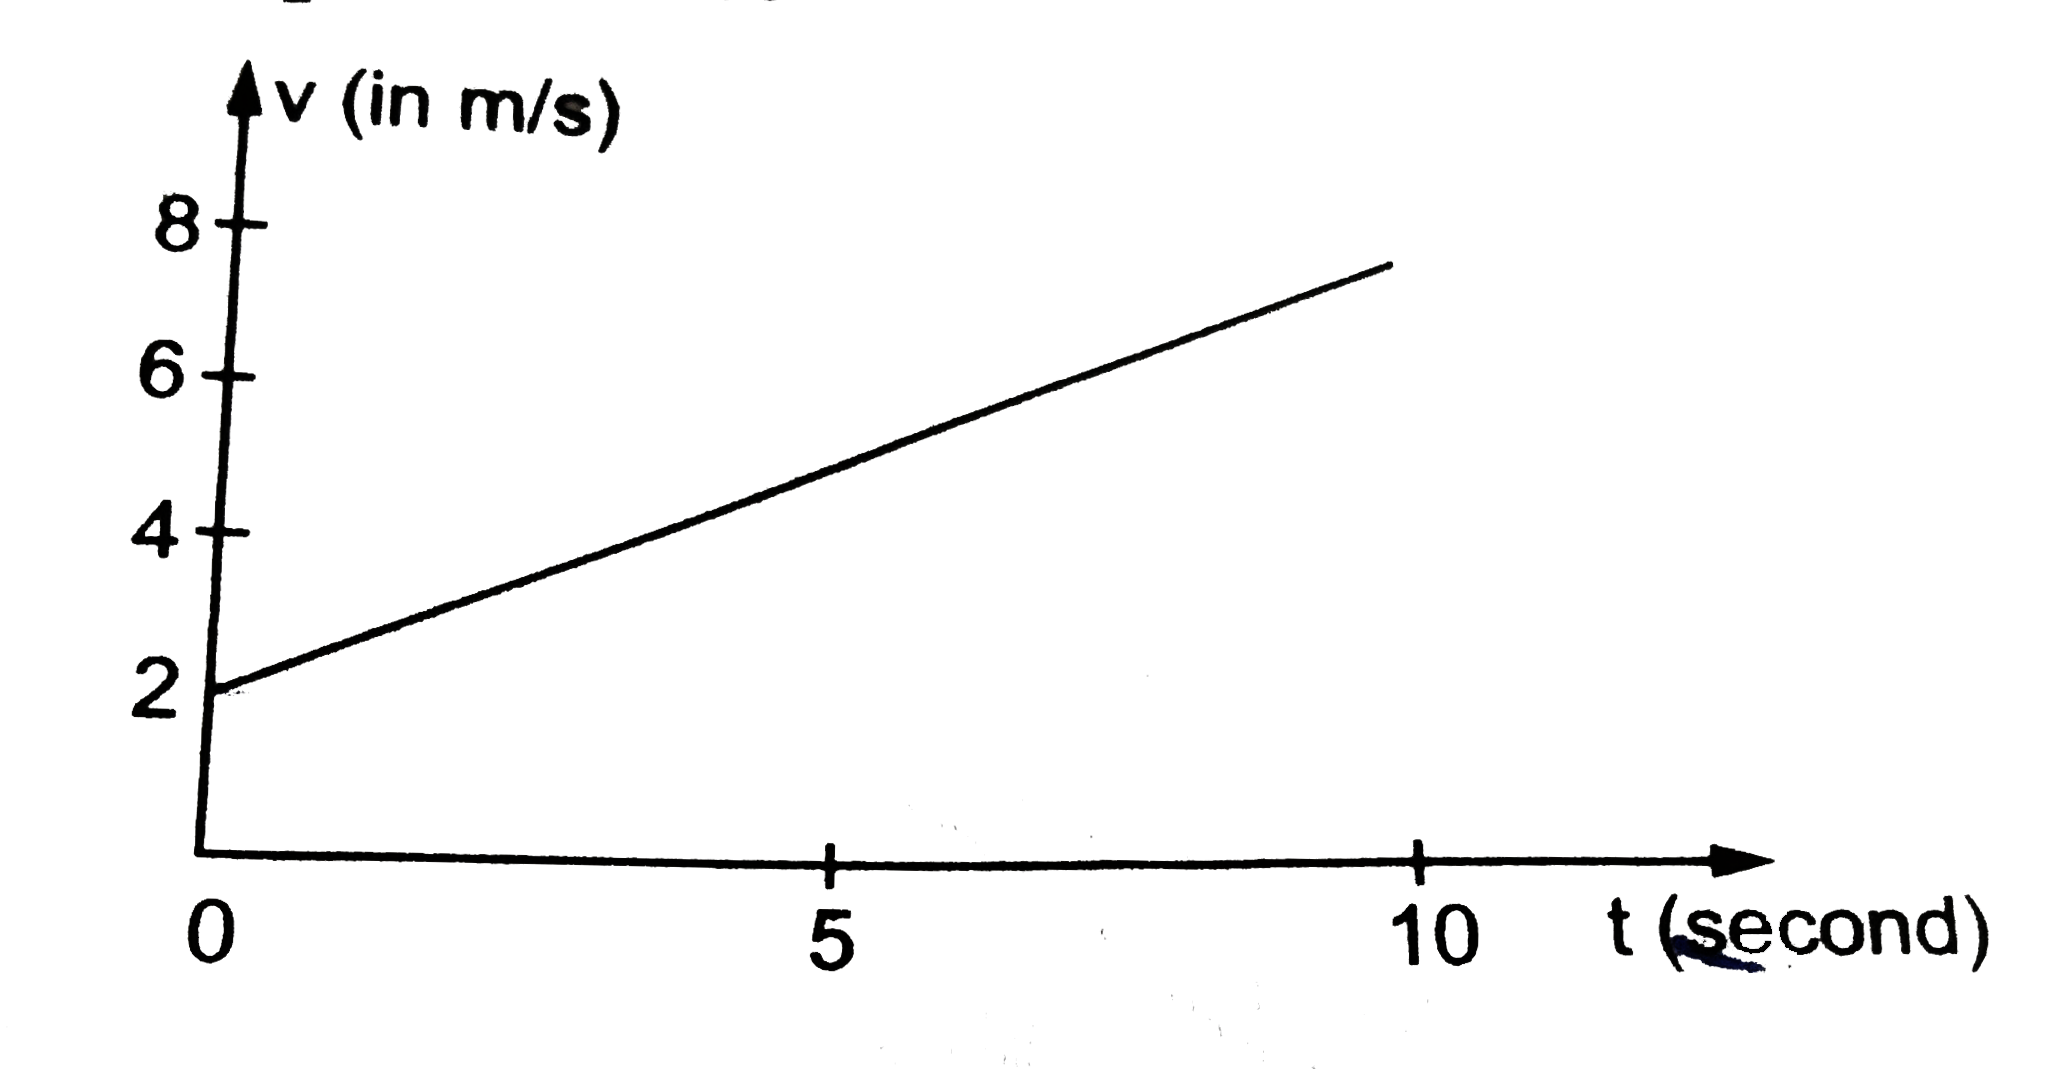 shows the graph of velocity versus tie for a particle going along the X-axis. Find a. the acceleration, b. The distance travelled in 0 to 10 s and c. the displacement in 0 to 10 s.View Solution
figure
 shows the graph of velocity versus tie for a particle going along the X-axis. Find a. the acceleration, b. The distance travelled in 0 to 10 s and c. the displacement in 0 to 10 s.View Solution
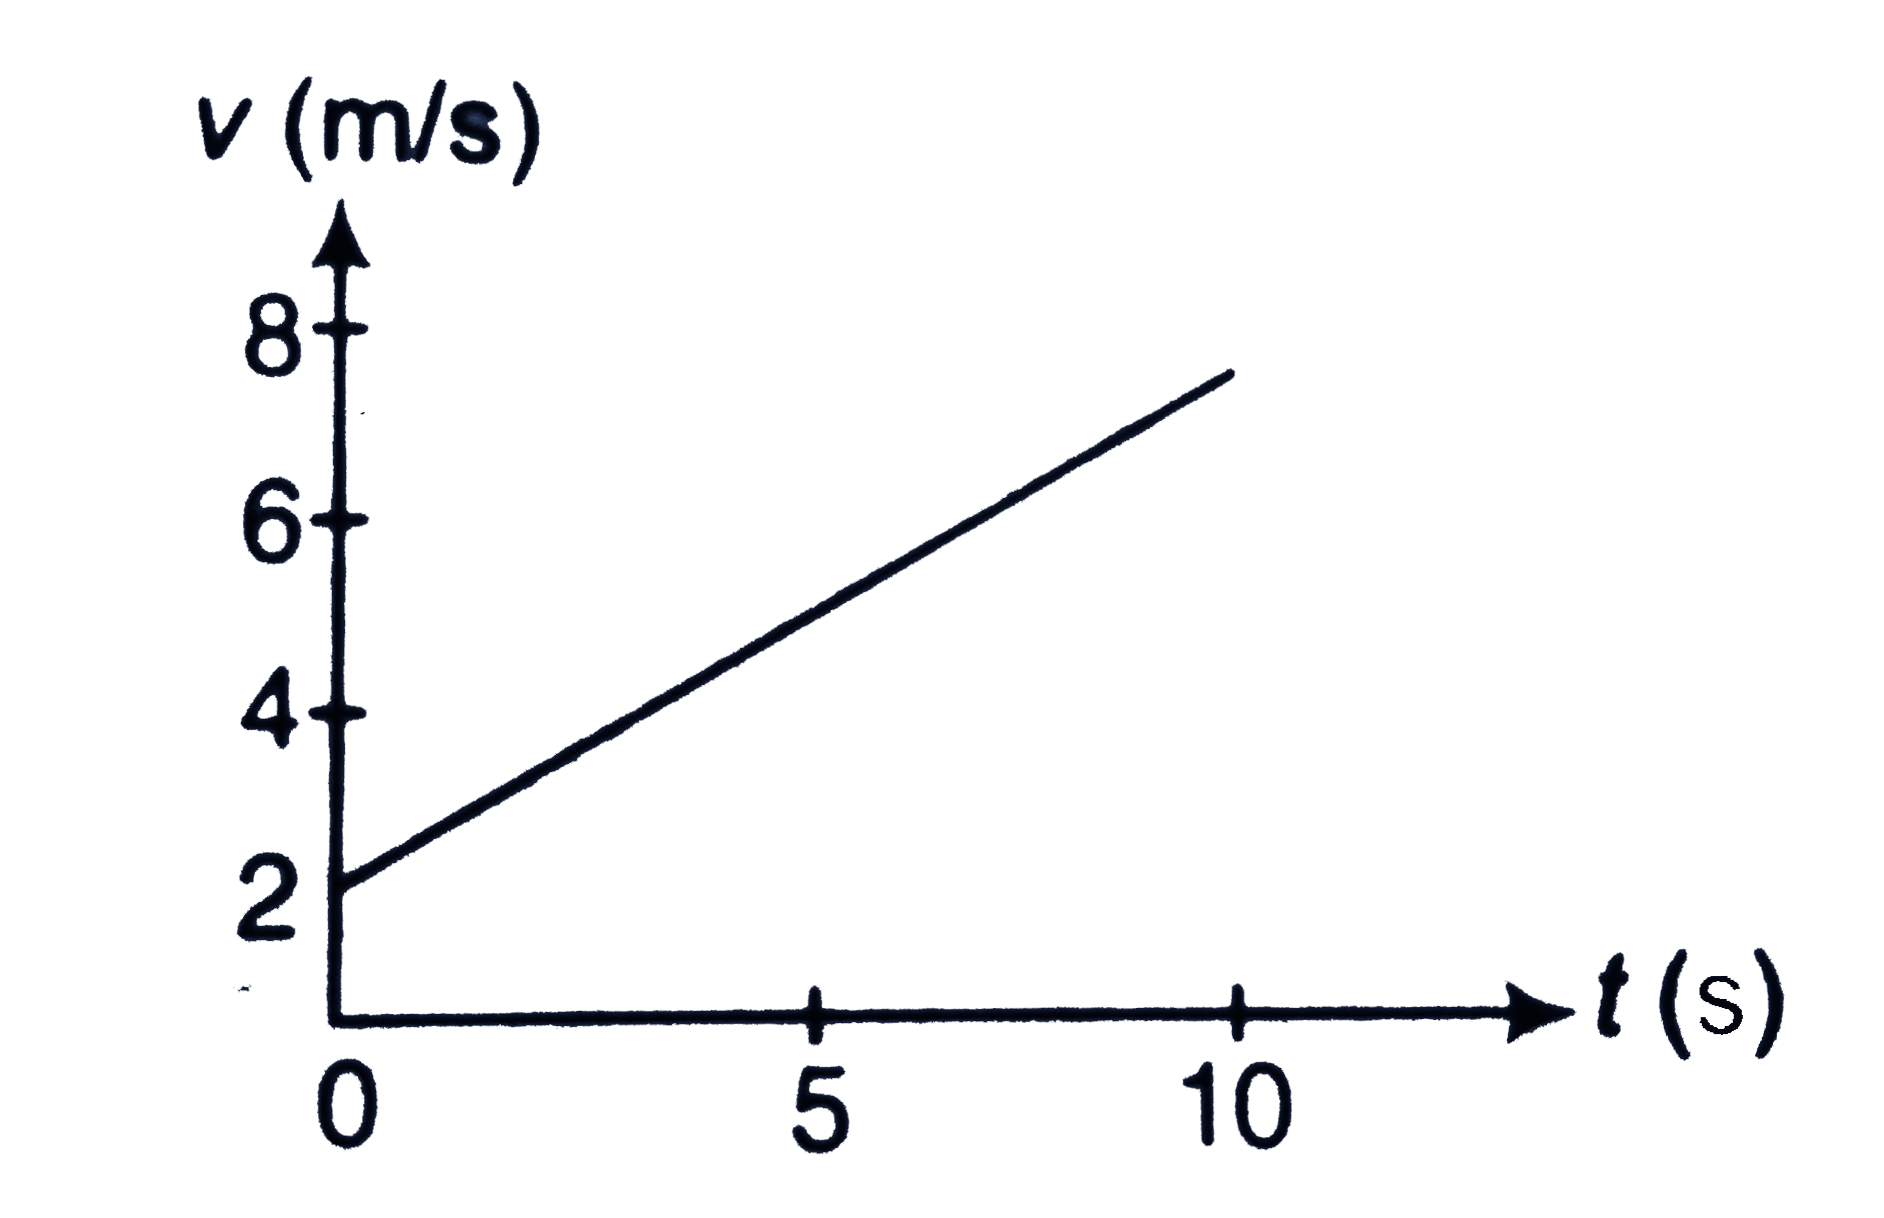
Fig. shows the graph of velocity versus time for a particle going along the x-axis. Find (a) acceleration, (b) the distance traveled in 0→10s and (c) the displacement in 0 to 10s.
 View Solution

