Bar chart given below shows total number of items sold by five companies and table shows the percentage of items which are rejected (due to some defect in them) by customers out of total items sold by respective companies.
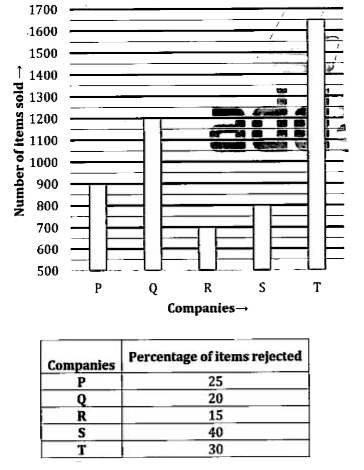
Number of items sold by company P which are not rejected are what percent more or less than total items which are rejected by customers to company Q and R together?
85% less
851123% more
751323% less
951523% more
The correct Answer is:D
Step by step video, text & image solution for Bar chart given below shows total number of items sold by five companies and table shows the percentage of items which are rejected (due to some defect in them) by customers out of total items sold by respective companies. Number of items sold by company P which are not rejected are what percent more or less than total items which are rejected by customers to company Q and R together? by Maths experts to help you in doubts & scoring excellent marks in Class 14 exams.
Updated on:21/07/2023Topper's Solved these Questions
- DATA INTERPRETATIONBOOK - ADDA247CHAPTER - DATA INTERPRETATIONEXERCISE - Mains Questions
33 Videos
- DATA INTERPRETATIONBOOK - ADDA247CHAPTER - DATA INTERPRETATIONEXERCISE - Previous Year Questions
56 Videos
- DATA INTERPRETATIONBOOK - ADDA247CHAPTER - DATA INTERPRETATIONEXERCISE - Prelims Questions (Level-1)
54 Videos
- BOAT AND STREAM BOOK - ADDA247CHAPTER - BOAT AND STREAM EXERCISE - Previous Year Question
22 Videos
- DATA SUFFICIENCY BOOK - ADDA247CHAPTER - DATA SUFFICIENCY EXERCISE - PREVIOUS YEAR QUESTIONS
25 Videos
Similar Questions
Pie chart given below shows total number of workers in three different companies. Table given below shows ratio between officers and workers working in these companies. Study the data carefully and answer the following questions
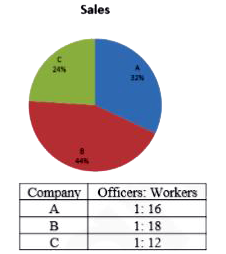
Note: total employees = officers + workers
Total number of officers in company ‘A’ is how much less than total number of officers in company ‘B’?
View SolutionStudy the following table, (which shows the number of units of an item manufactured and sold by 5 companies) and answer the question
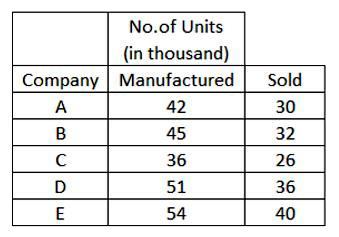
The ratio of the number of units manufactured by companies C and E together and the number of units sold by A and D together is?
View Solution
Knowledge Check
The given table represents the number of engineers recruited by four companies A,B,C and D over the years. Study the table carefully and answer the questions that follows: The total number of engineers recruited by the company B in 2014 and 2017 is what percentage of the total number of engineers recruited by C during 2015 to 2019?
दी गयी तालिका चार कंपनियों A, B, C और D के द्वारा इन वर्षों के दौरान भर्ती किये गए इंजीनियरों की संख्या दर्शाती है | इस तालिका का ध्यानपूर्वक अध्ययन करें तथा इसके बाद पूछे गए प्रश्न का उत्तर दें |
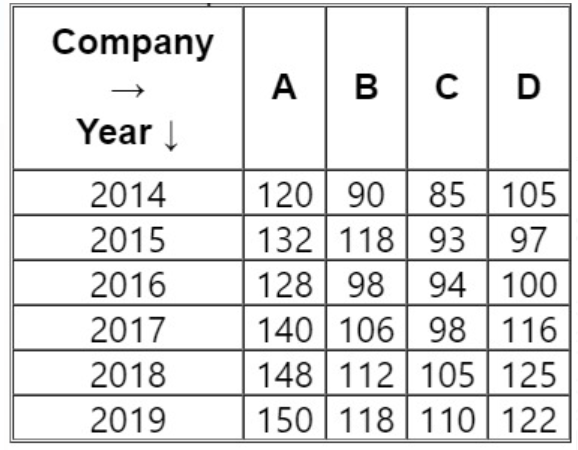
कंपनी B के द्वारा 2014 और 2017 में भर्ती किये गए इंजीनियरों की कुल संख्या C के द्वारा 2015 से 2019 के दौरान भर्ती किये गए इंजीनियरों की कुल संख्या का कितना प्रतिशत है ?A3.5B2.5C3D4The given table represents the sale (in thousands) of cars by four companies A,B,C and D in six years. Study the table and answer the questions that follow. The total number of cars sold by companies A in 2017 and C in 2013 is what percentage of the total number of cars sold by all the four companies in 2013 and 2016?(correct to one decimal place)
दी गयी तालिका चार कंपनियों - A, B, C और D के द्वारा छः वर्षों में की गयी कारों की बिक्री ( हज़ार में ) दर्शाती है | इस तालिका का अध्ययन करें तथा फिर पूछे गए प्रश्नों के उत्तर दें |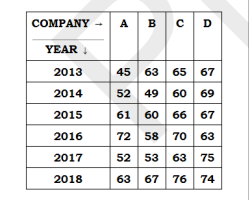
कंपनी A के द्वारा 2017 में तथा कंपनी C के द्वारा 2013 में बेची गयी कारों की कुल संख्या सभी चार कंपनियों के द्वारा 2013 से 2016 तक बेची गयी कारों की कुल संख्या का कितना प्रतिशत है ? ( दशमलव के एक स्थान तक )A40B3313C1623D50The given table represents the sale (in thousands) of cars by four companies A,B,C and D in six years. Study the table and answer the questions that follow:
दी गयी तालिका चार कंपनियों - A, B, C और D के द्वारा छः वर्षों में की गयी कारों की बिक्री ( हज़ार में ) दर्शाती है | इस तालिका का अध्ययन करें तथा फिर पूछे गए प्रश्नों के उत्तर दें |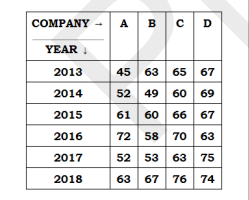 What is the ratio of total number of cars sold by companies A,B and D in 2017 to the total number
of cars sold by all companies in 2018?
कंपनी A, B और D के द्वारा 2017 में बेची गयी कारों की कुल संख्या तथा 2018 में सभी कंपनियों के द्वारा बेची गयी कारों की कुल संख्या के बीच क्या अनुपात है ?A3:4B6:13C9:14D18:23
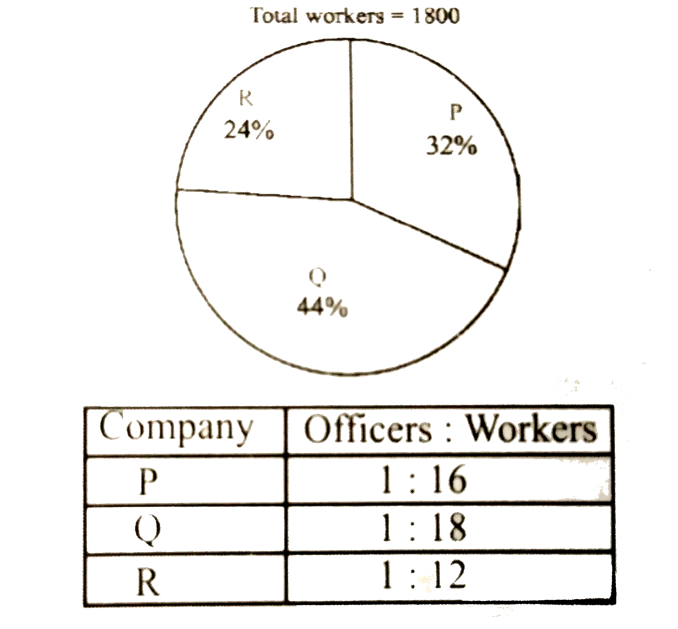
Total number of employees in company 'Q' is how much more than total number of employees in company R,
View SolutionStudy the following table, (which shows the number of units of an item manufactured and sold by 5 companies) and answer the question.
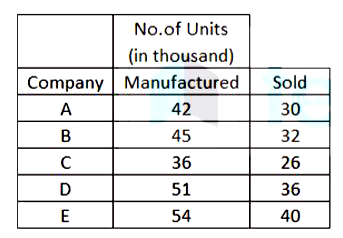
What percent of total number of units sold by companies A, B and D is equal to the number of units manufactured by company C? (correct to one decimal place)
View SolutionThere are two car manufacturing companies (Company X and Company Y). The sale of cars by these two different companies is given in different years.
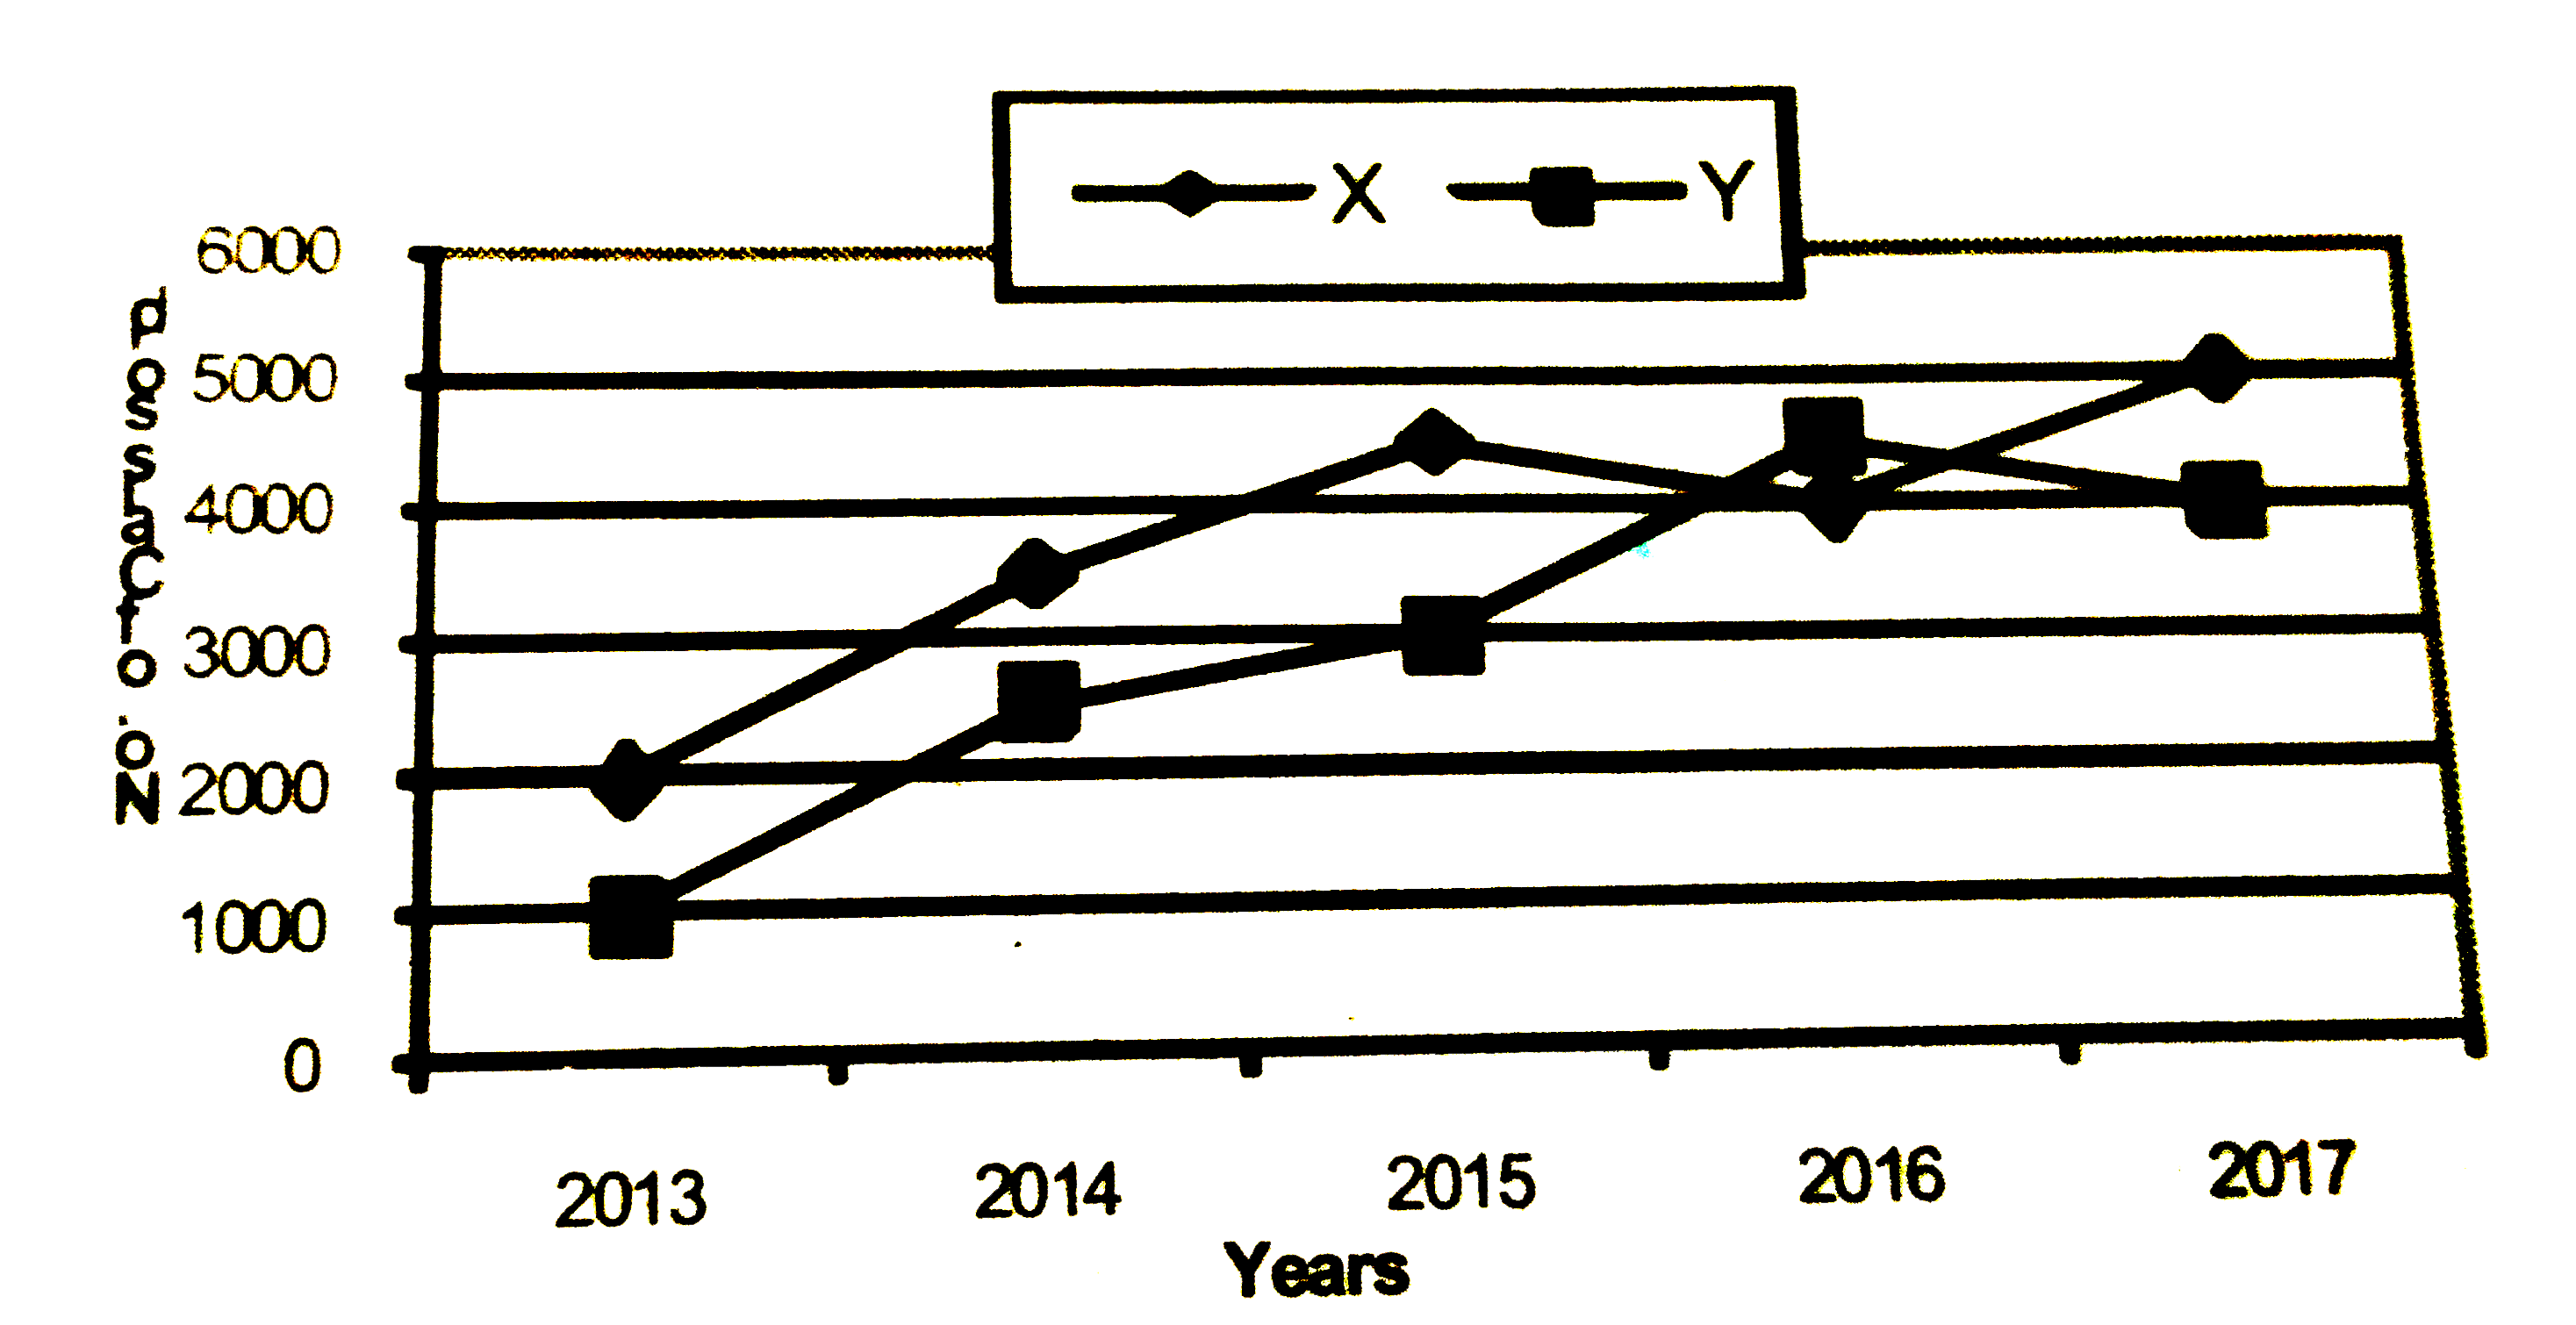
Total cars sold by both companies in year 2014 are what percent more/less the total cars sold by both companies in year 2015 ?
View SolutionItems sold in 2014 is how much percent more than items produced by company in 2017.
View SolutionThe total number of cars sold by companies A in 2017 and C in 2013 is what percentage of the total number of cars sold by all four companies in 2013 and 2016? (correct to one decimal place)
View Solution
