Bar graph given below shows number of mobile phones (in thousand) sold in 2017 and percentage increase in sales of these mobile phones in 2018 as compared to previous year of 5 different companies. Read the data carefully and answer the following question.
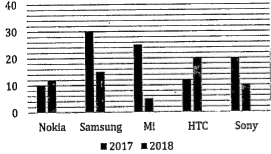
No. of Mi mobile sold in 2017 are what percent more than no. of Sony mobile sold in same year?
20%
12%
14%
25%
The correct Answer is:D
Step by step video, text & image solution for Bar graph given below shows number of mobile phones (in thousand) sold in 2017 and percentage increase in sales of these mobile phones in 2018 as compared to previous year of 5 different companies. Read the data carefully and answer the following question. No. of Mi mobile sold in 2017 are what percent more than no. of Sony mobile sold in same year? by Maths experts to help you in doubts & scoring excellent marks in Class 14 exams.
Updated on:21/07/2023Topper's Solved these Questions
- DATA INTERPRETATIONBOOK - ADDA247CHAPTER - DATA INTERPRETATIONEXERCISE - Prelims Questions (Level-1)
54 Videos
- DATA INTERPRETATIONBOOK - ADDA247CHAPTER - DATA INTERPRETATIONEXERCISE - Prelims Questions (Level-2)
59 Videos
- DATA INTERPRETATIONBOOK - ADDA247CHAPTER - DATA INTERPRETATIONEXERCISE - Previous Year Questions
56 Videos
- BOAT AND STREAM BOOK - ADDA247CHAPTER - BOAT AND STREAM EXERCISE - Previous Year Question
22 Videos
- DATA SUFFICIENCY BOOK - ADDA247CHAPTER - DATA SUFFICIENCY EXERCISE - PREVIOUS YEAR QUESTIONS
25 Videos
Similar Questions
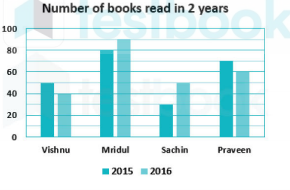
Directions: Read the bar graph carefully and answer the given questions.Books read by Praveen in the year 2015 is what percent more or less than the number of books read by Mridul in the year 2015 ?
View Solution
What is the total number of mobile phones sold of company B during Agust and September together ?
View Solution
Knowledge Check
The bar chart given below shows the sales (in '000 units) of 4 mobile brands for 3 years.
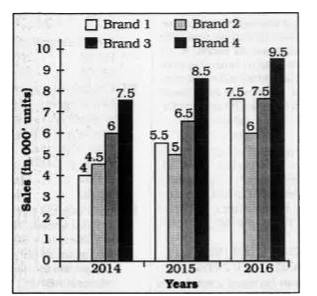
What is the percentage increase in the number of mobile phones of Brand 2 sold from 2014 to 2015?A8.33B33.33C37.5D11.11The bar chart given below shows the sales (in '000 units) of 4 mobile brands for 3 years.
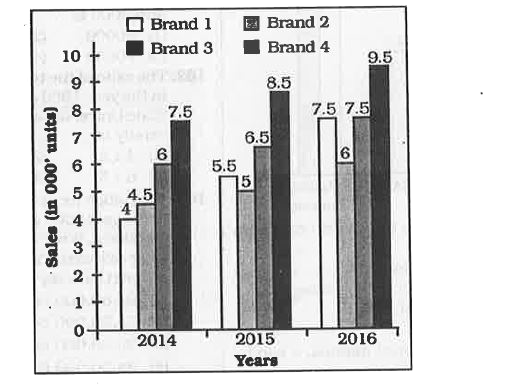
What is the percentage increase in the number of mobile phones of Brand 2 sold from 2014 to 2015?A8.33B33.33C37.5D11.11
Read the following graph carefully and answer the questions given below.
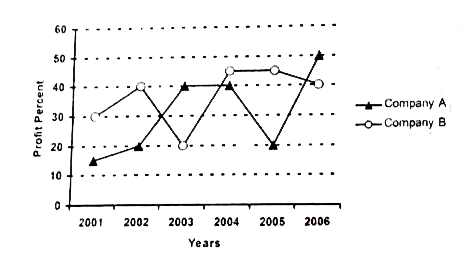
In which year the average of the profit percent of the both companies was the maximum ?
View Solution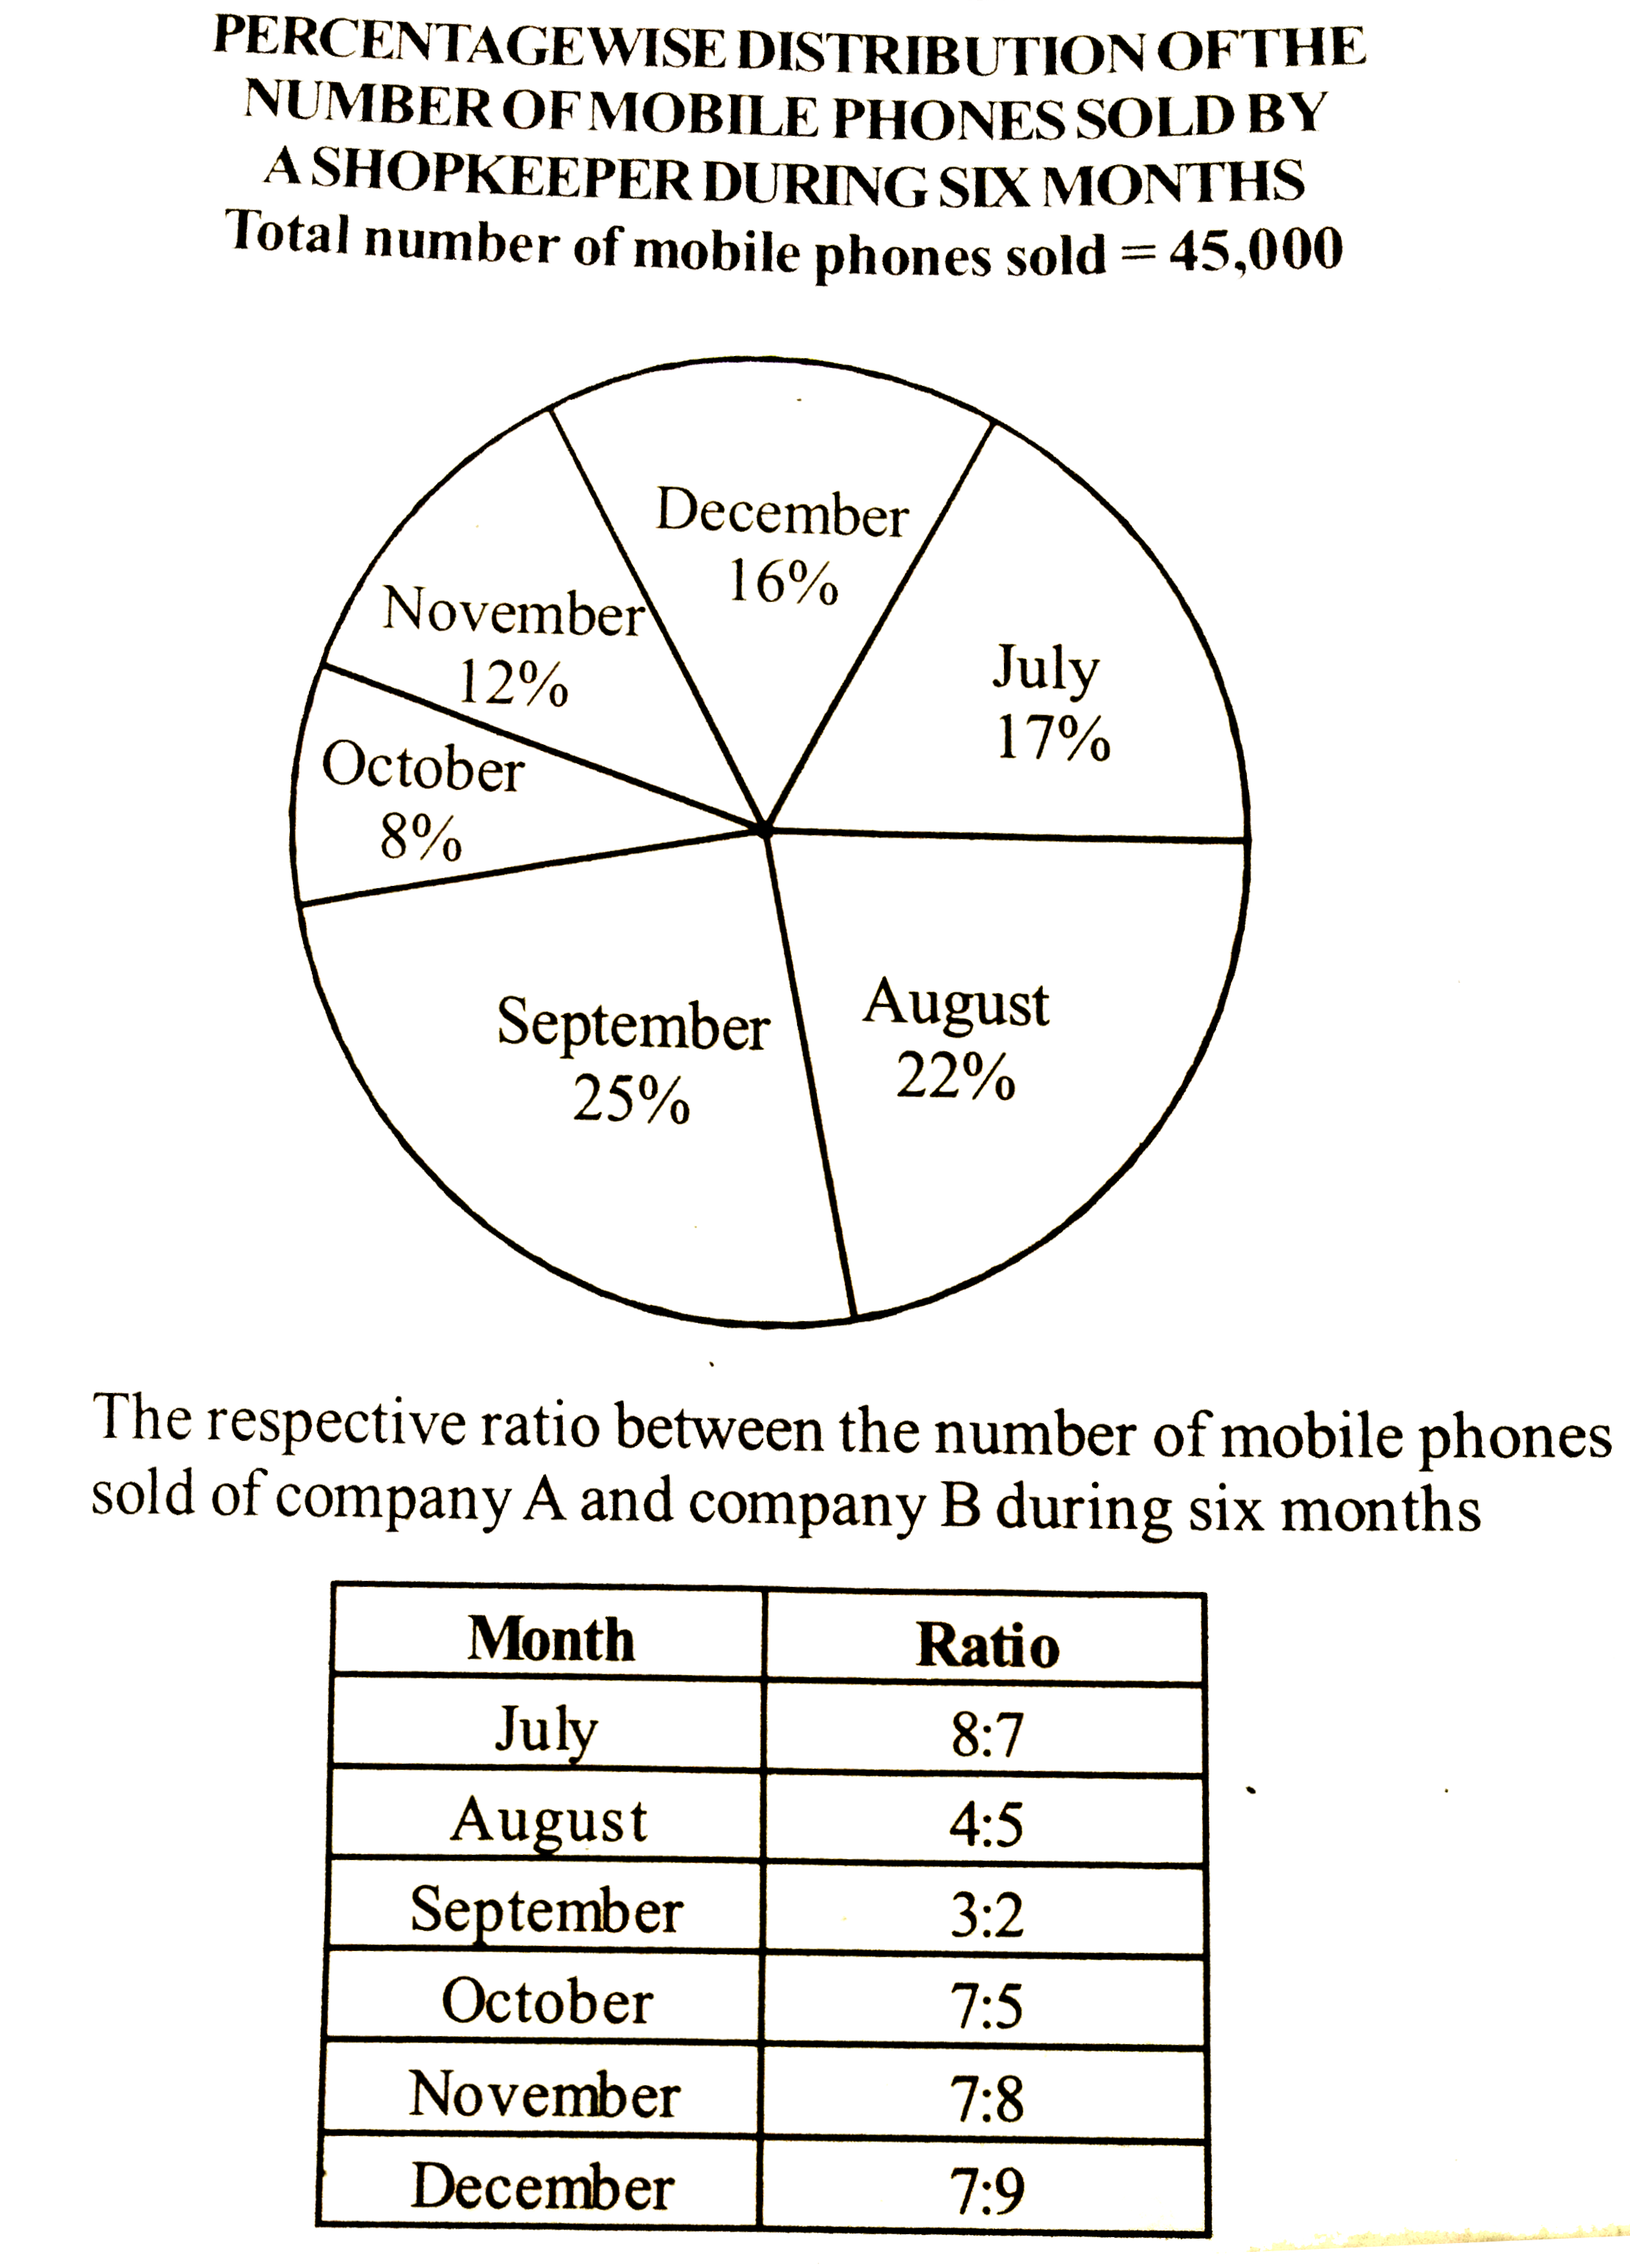
The number of mobile phones sold of company A during July is approximately what percent of number of mobile phones sold of compnay A during December ?
View SolutionBar graph given below shows pens sold by a retailor on five different days. Study the data carefully and answer the following questions.
Pen sold on different days
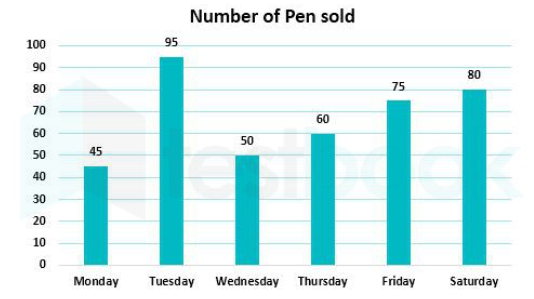
what is the average number of pens sold during a week if total number of pens sold on saturday is 25% more than total number of pens sold on Sunday .
View SolutionRead the bar graph given below and answer the following questions:

In which year is the increase in number of students maximum as compared to the previous year?
View SolutionThe bar chart given below shows the percentage distribution of the production of various models of a ,mobile manufacturing company in 2007 and 2008. The total production in 2007 was 35 lakh mobile phones and in 2008 the production was 44 lakh. Study the chart and answer the following questions.
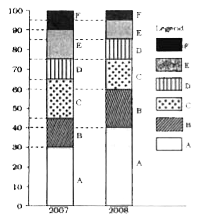
If 85% of the D type mobiles prodeced in each year were sold by the company, how many D type mobiles remained unsold ?
View SolutionThe bar graph shows 1 month's sales figures of different brands of mobile phones of a certain electronics store in Rs 1000s. Study the diagram and answer the following questions.
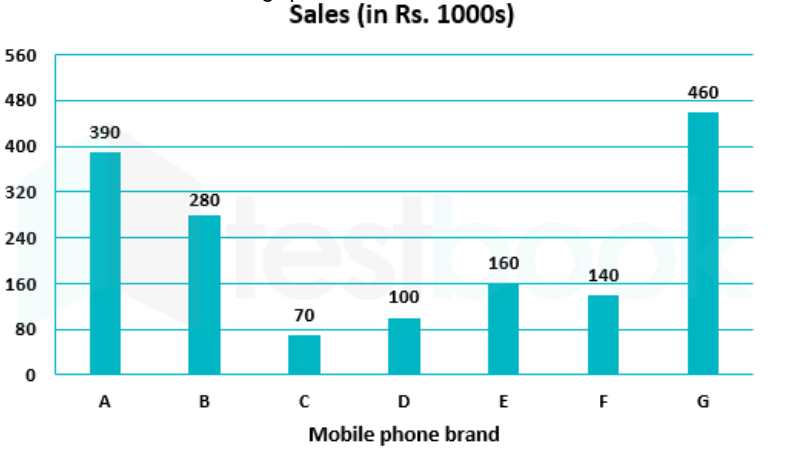
Sales of which mobile phone brand were the second highest?
View Solution
