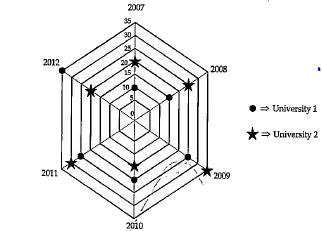
Radar Graph: The radar chart is a chart that consists of a sequence of equi-angular spokes, called radii, with each spoke representing one of the variables. The radar chart also known as a spider chart because of its appearance, has its zero starting point in the middle from the middle of each axis of the chart can protrude out like the spokes on a wheel. There can be one axis for each subject. And there is no limit on the no. of subject that can be used it can also be described as a radial grid with zero starting point being the middle.
Radar Graph
Number of students (in thousands) in two different universities in six different years.

In which year was the difference between the number of students in university-1 and the number of students in university-2 highest?
2008
2009
2010
2012
The correct Answer is:D
Step by step video, text & image solution for Radar Graph: The radar chart is a chart that consists of a sequence of equi-angular spokes, called radii, with each spoke representing one of the variables. The radar chart also known as a spider chart because of its appearance, has its zero starting point in the middle from the middle of each axis of the chart can protrude out like the spokes on a wheel. There can be one axis for each subject. And there is no limit on the no. of subject that can be used it can also be described as a radial grid with zero starting point being the middle. Radar Graph Number of students (in thousands) in two different universities in six different years. In which year was the difference between the number of students in university-1 and the number of students in university-2 highest? by Maths experts to help you in doubts & scoring excellent marks in Class 14 exams.
Updated on:21/07/2023Topper's Solved these Questions
- DATA INTERPRETATIONBOOK - ADDA247CHAPTER - DATA INTERPRETATIONEXERCISE - Basic Questions
30 Videos
- DATA INTERPRETATIONBOOK - ADDA247CHAPTER - DATA INTERPRETATIONEXERCISE - Prelims Questions (Level-1)
54 Videos
- BOAT AND STREAM BOOK - ADDA247CHAPTER - BOAT AND STREAM EXERCISE - Previous Year Question
22 Videos
- DATA SUFFICIENCY BOOK - ADDA247CHAPTER - DATA SUFFICIENCY EXERCISE - PREVIOUS YEAR QUESTIONS
25 Videos
Similar Questions
Knowledge Check
A Triple Bar Chart is:-
AOne dimensionalBTwo dimensionalCThree dimensionalDAll the above.A component part chart can be presented in the form of :
ACircleBBarsCBoth circles and barsDTriangles.Pie chart is drawn with the help of
Aradius of the circleBchords of the circleCsectors of the circleDdiameter of the circle
Weather charts are shown:
View SolutionComplete the chart :
Complete the chart as per the objectives of the first aid :
View SolutionIn a pie chart, the sum of the angles of all its com-ponents is ________ .
View SolutionPie chart is drawn with the help of
View Solutionto put a spoke in one's wheel
View Solution