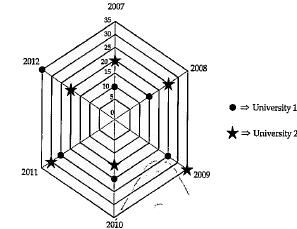
Radar Graph: The radar chart is a chart that consists of a sequence of equi-angular spokes, called radii, with each spoke representing one of the variables. The radar chart also known as a spider chart because of its appearance, has its zero starting point in the middle from the middle of each axis of the chart can protrude out like the spokes on a wheel. There can be one axis for each subject. And there is no limit on the no. of subject that can be used it can also be described as a radial grid with zero starting point being the middle.
Radar Graph
Number of students (in thousands) in two different universities in six different years.

If 25% of the students in university 2 in year-2010 were female, what was the number of male students in the university - 2 in the same year?
11250
12350
12500
11500
The correct Answer is:A
Step by step video, text & image solution for Radar Graph: The radar chart is a chart that consists of a sequence of equi-angular spokes, called radii, with each spoke representing one of the variables. The radar chart also known as a spider chart because of its appearance, has its zero starting point in the middle from the middle of each axis of the chart can protrude out like the spokes on a wheel. There can be one axis for each subject. And there is no limit on the no. of subject that can be used it can also be described as a radial grid with zero starting point being the middle. Radar Graph Number of students (in thousands) in two different universities in six different years. If 25% of the students in university 2 in year-2010 were female, what was the number of male students in the university - 2 in the same year? by Maths experts to help you in doubts & scoring excellent marks in Class 14 exams.
Updated on:21/07/2023Topper's Solved these Questions
- DATA INTERPRETATIONBOOK - ADDA247CHAPTER - DATA INTERPRETATIONEXERCISE - Basic Questions
30 Videos
- DATA INTERPRETATIONBOOK - ADDA247CHAPTER - DATA INTERPRETATIONEXERCISE - Prelims Questions (Level-1)
54 Videos
- BOAT AND STREAM BOOK - ADDA247CHAPTER - BOAT AND STREAM EXERCISE - Previous Year Question
22 Videos
- DATA SUFFICIENCY BOOK - ADDA247CHAPTER - DATA SUFFICIENCY EXERCISE - PREVIOUS YEAR QUESTIONS
25 Videos
Similar Questions
Knowledge Check
A Triple Bar Chart is:-
AOne dimensionalBTwo dimensionalCThree dimensionalDAll the above.A component part chart can be presented in the form of :
ACircleBBarsCBoth circles and barsDTriangles.Pie chart is drawn with the help of
Aradius of the circleBchords of the circleCsectors of the circleDdiameter of the circle
Weather charts are shown:
View SolutionComplete the chart :
Complete the chart as per the objectives of the first aid :
View SolutionIn a pie chart, the sum of the angles of all its com-ponents is ________ .
View SolutionPie chart is drawn with the help of
View Solutionto put a spoke in one's wheel
View Solution
