Mixed Graph: Pie Chart breakup shows that number of employees in different department of an organization. Table shows the percentage of men in each department (Rest one woman)
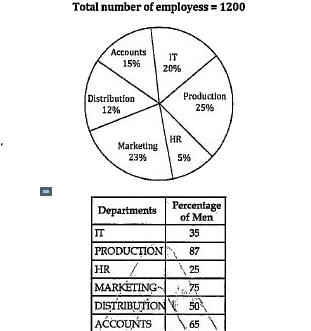
The number of women from the department IT, what percent of the number of men from the same department (Rounded off to two deigits after decimal )
159.38%
190.07%
185.71%
168.23%
The correct Answer is:C
Step by step video, text & image solution for Mixed Graph: Pie Chart breakup shows that number of employees in different department of an organization. Table shows the percentage of men in each department (Rest one woman) The number of women from the department IT, what percent of the number of men from the same department (Rounded off to two deigits after decimal ) by Maths experts to help you in doubts & scoring excellent marks in Class 14 exams.
Updated on:21/07/2023Topper's Solved these Questions
- DATA INTERPRETATIONBOOK - ADDA247CHAPTER - DATA INTERPRETATIONEXERCISE - Basic Questions
30 Videos
- DATA INTERPRETATIONBOOK - ADDA247CHAPTER - DATA INTERPRETATIONEXERCISE - Prelims Questions (Level-1)
54 Videos
- BOAT AND STREAM BOOK - ADDA247CHAPTER - BOAT AND STREAM EXERCISE - Previous Year Question
22 Videos
- DATA SUFFICIENCY BOOK - ADDA247CHAPTER - DATA SUFFICIENCY EXERCISE - PREVIOUS YEAR QUESTIONS
25 Videos
Similar Questions
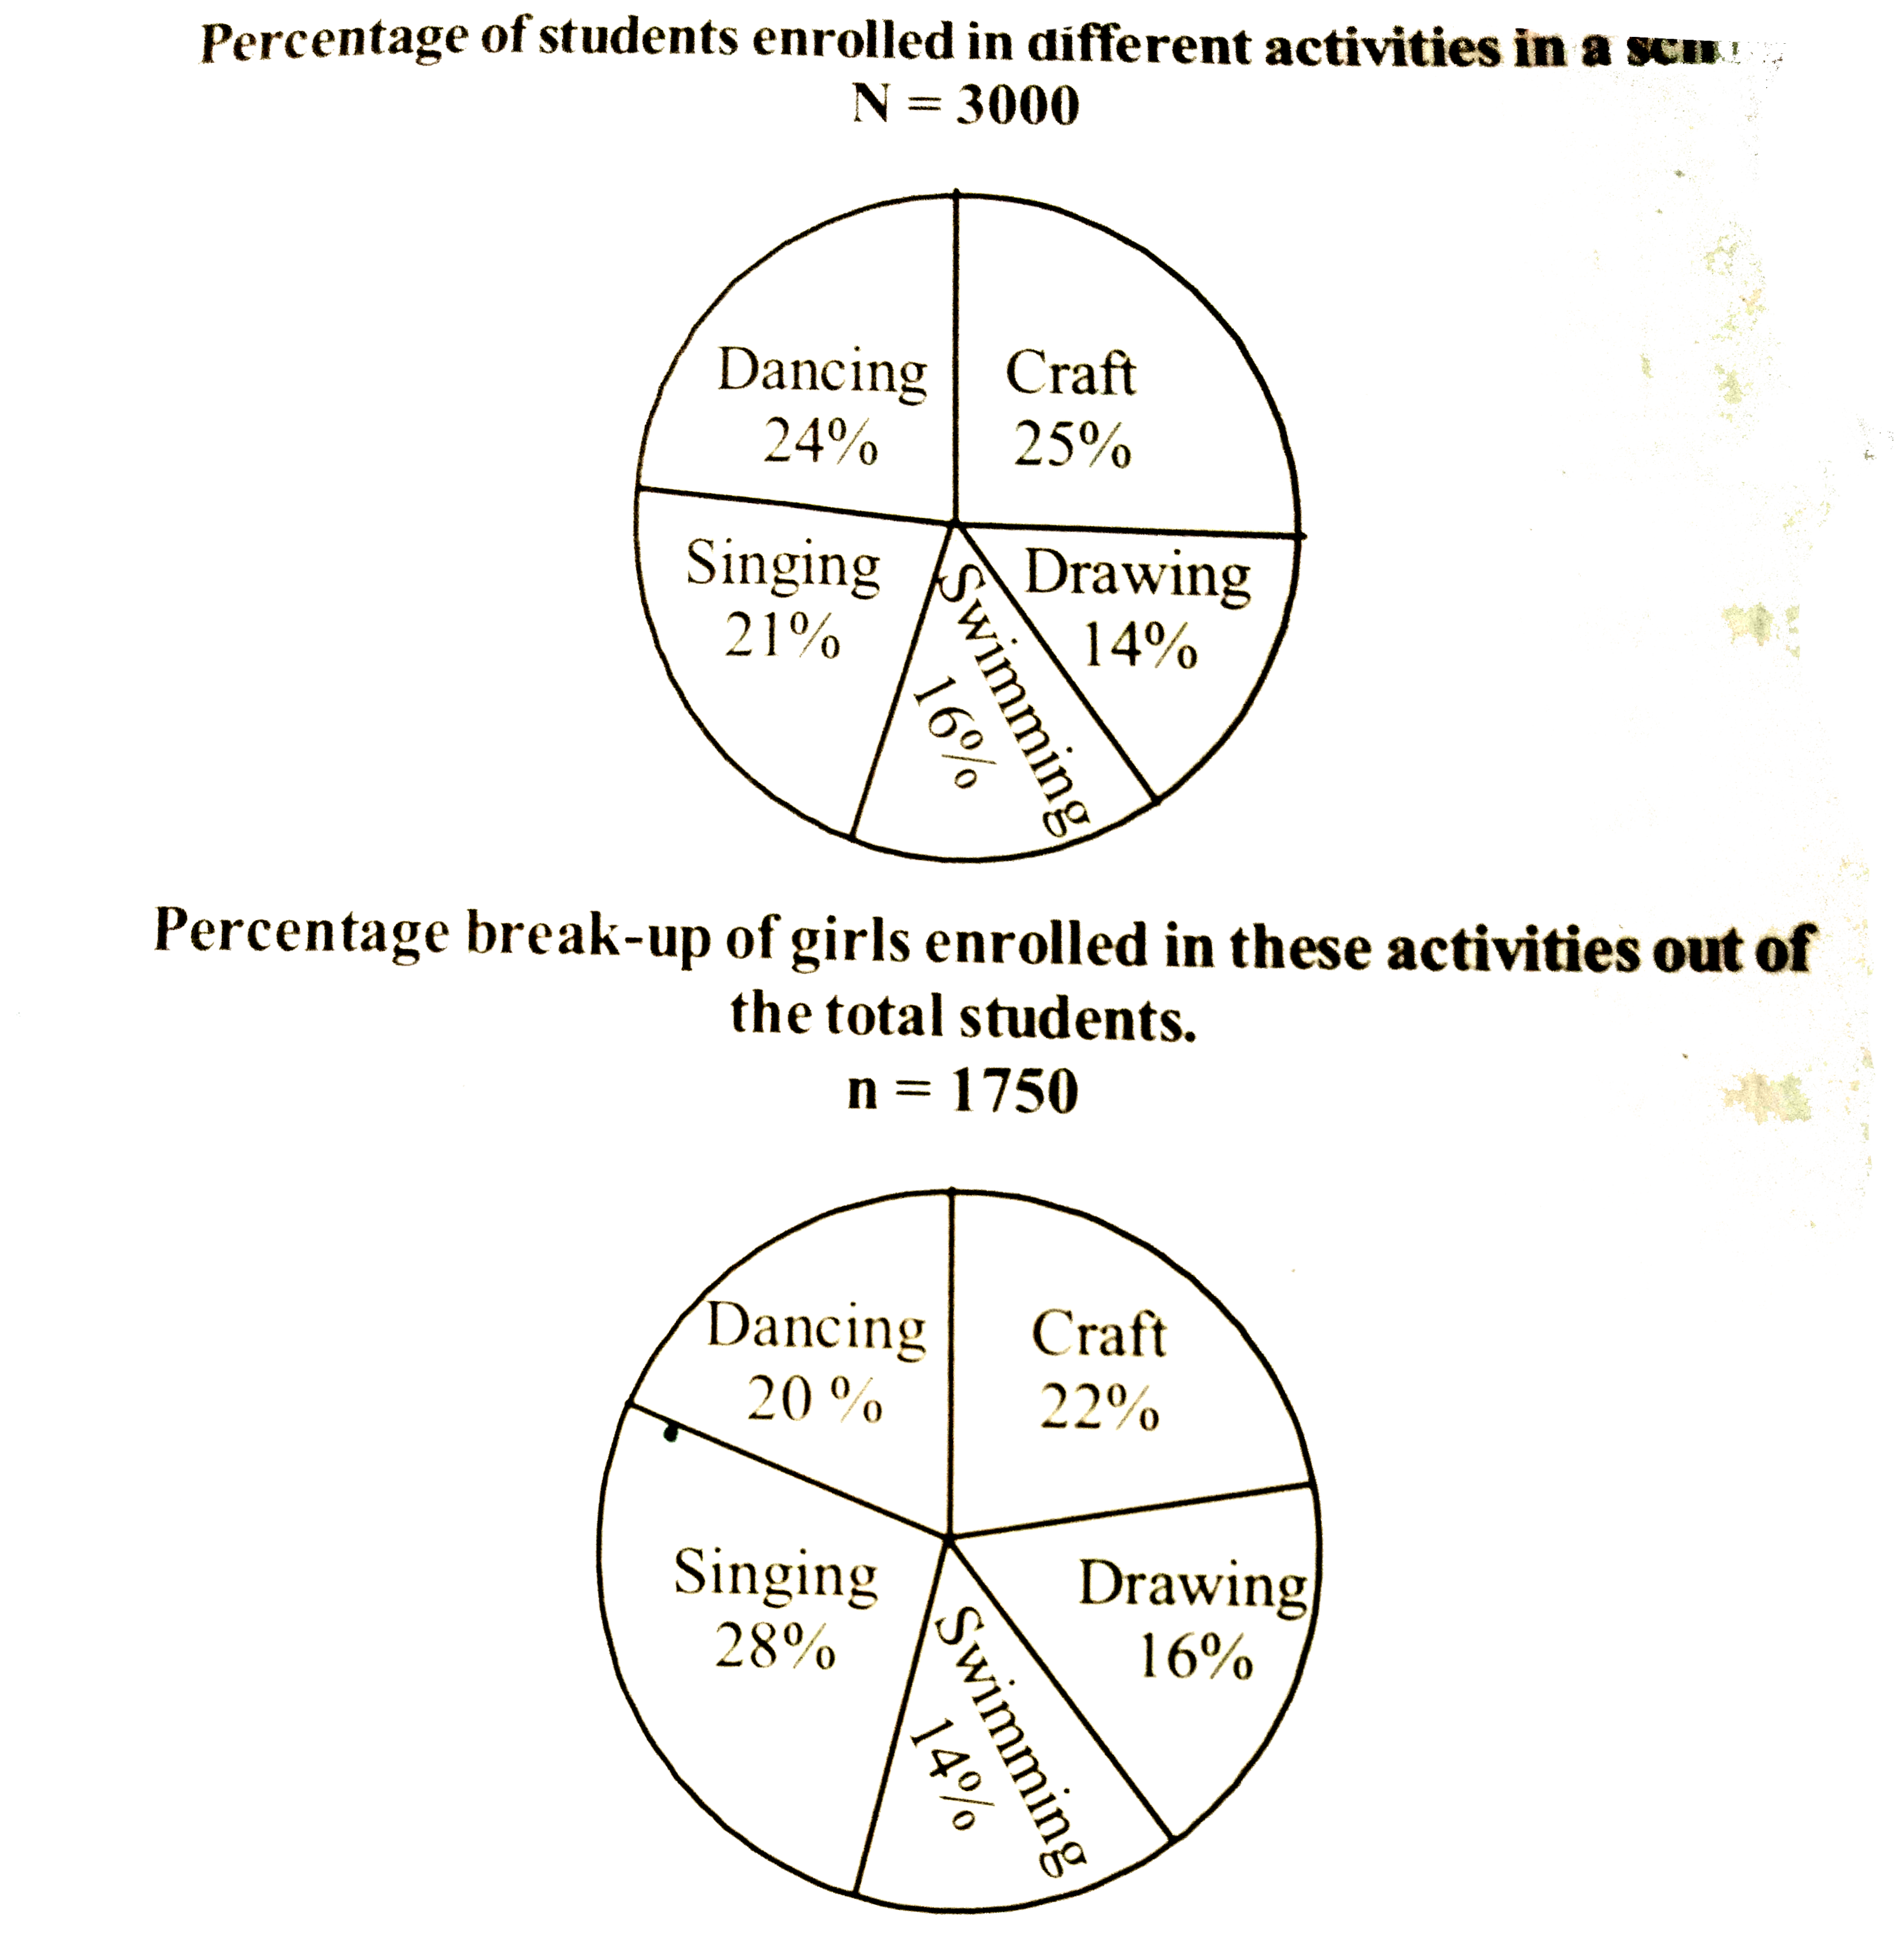
Number of girls enrolled in Dancing from what per cent of total number of students in the school ? (rounded off to two digits after decimal)
View Solution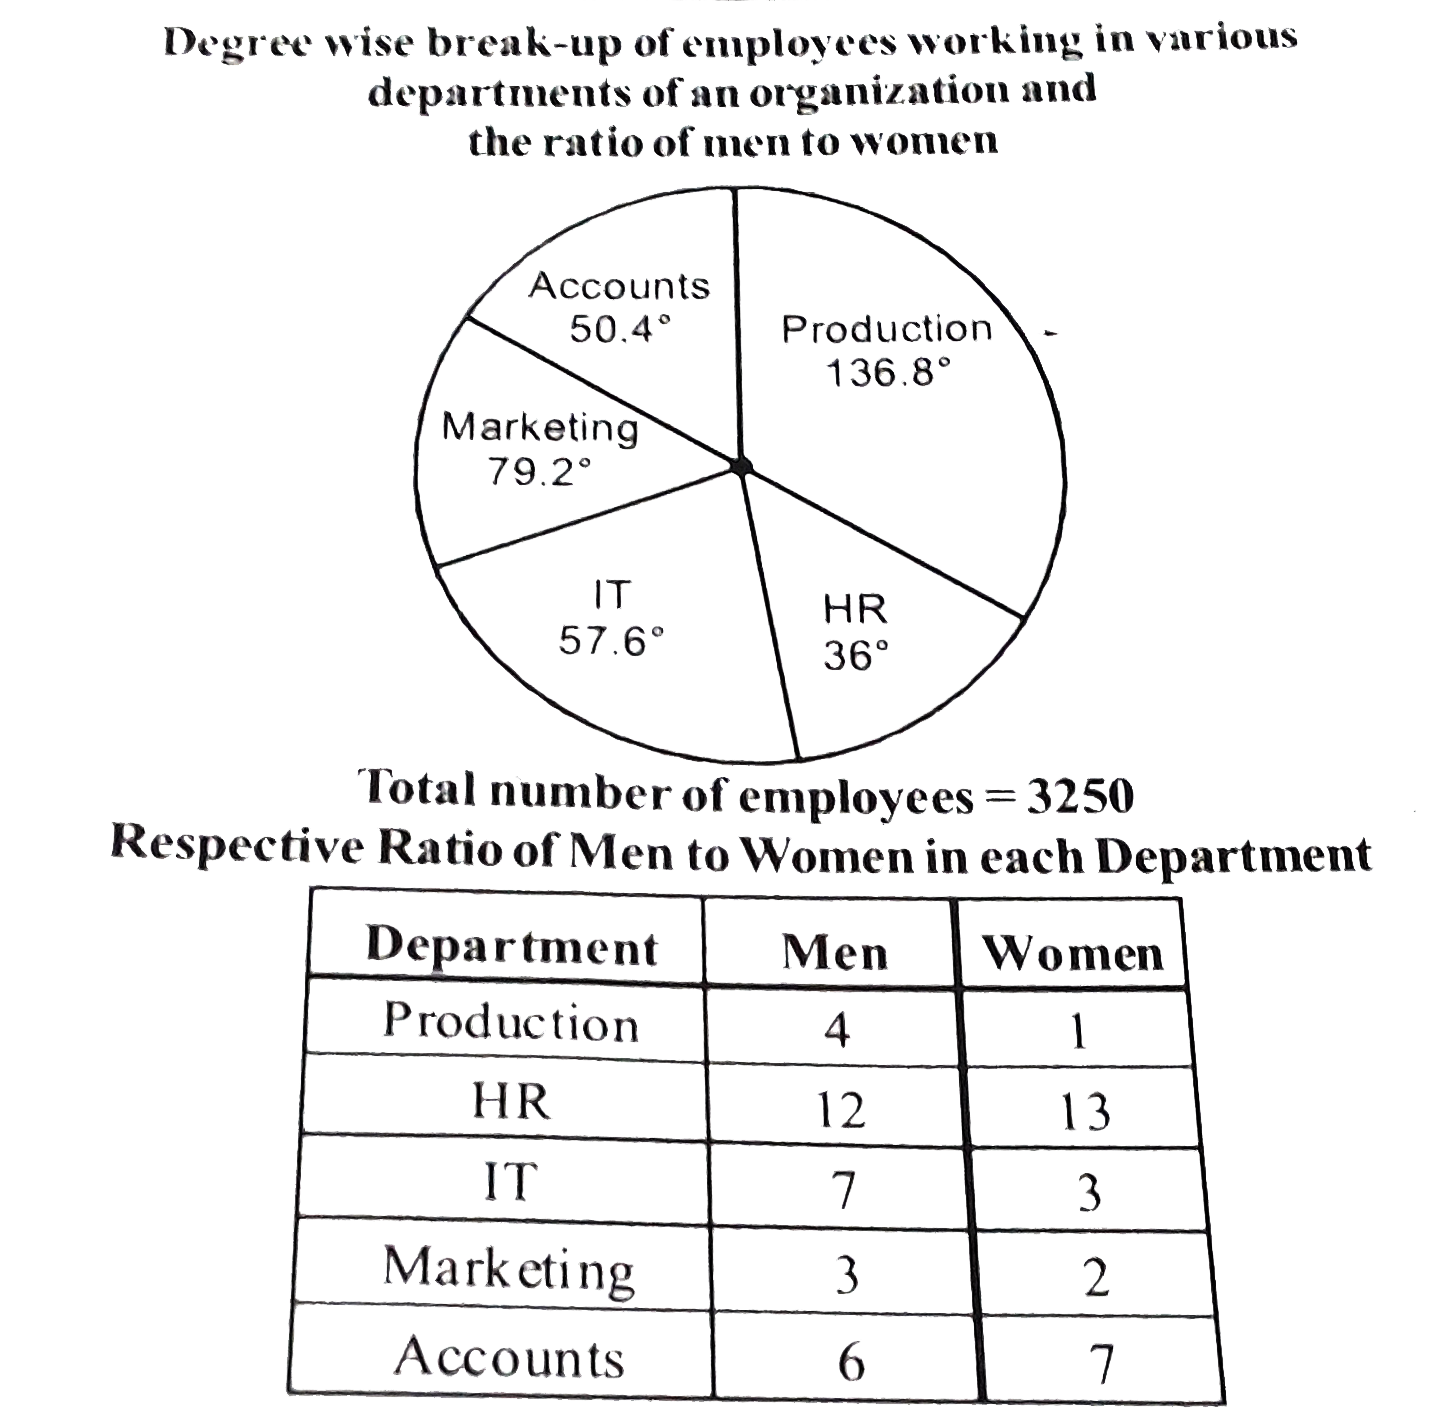
What is the respective ratio of the number of women working in the HR deparments of the number of men working in the IT department ?
View Solution
Knowledge Check
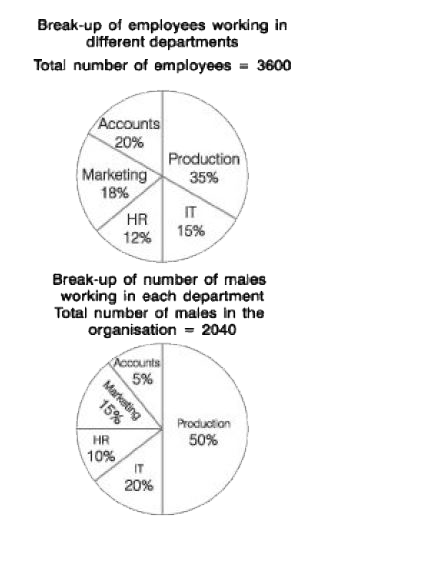
The number of employees who got promoted from the HR department was what percent of the total num- ber of employees working in that department? (Rounded off to two digits after decimal.
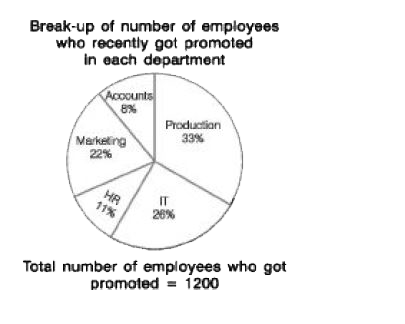 A0.3618B0.3056C0.4722D0.2816
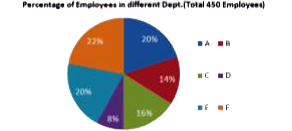
In the given pie-chart. what is the number of employees working in department A?A80B85C90D960The bar graph shows the number of employees working in the different departments of a company. Study the diagram and answer the following questions
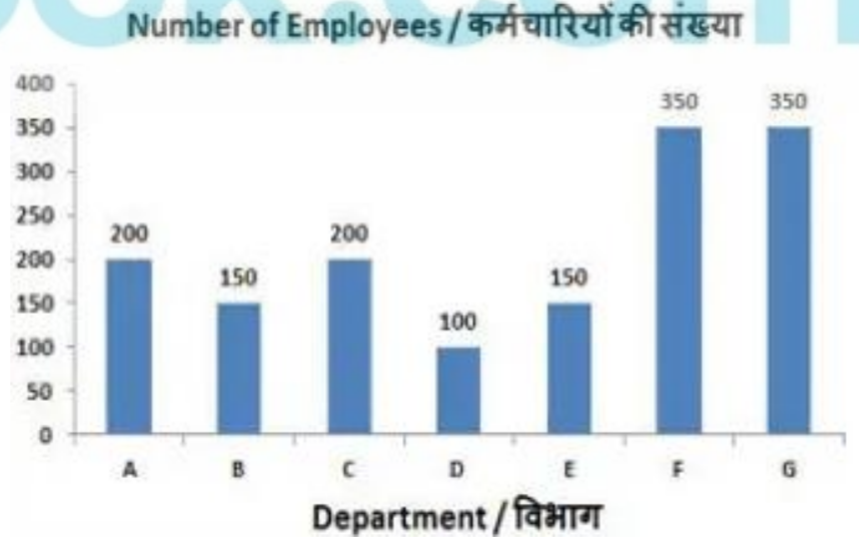
Which department has the lowest number of employees?ACBDCADB

What is the respective ratio of the number of women working in the HR deparments of the number of men working in the IT department ?
View SolutionBreakup of number of employes working in different departments of an organisation, the number of males and the number of employees who recently got promoted.
Total number of employees =3,600
Employees working in different departments
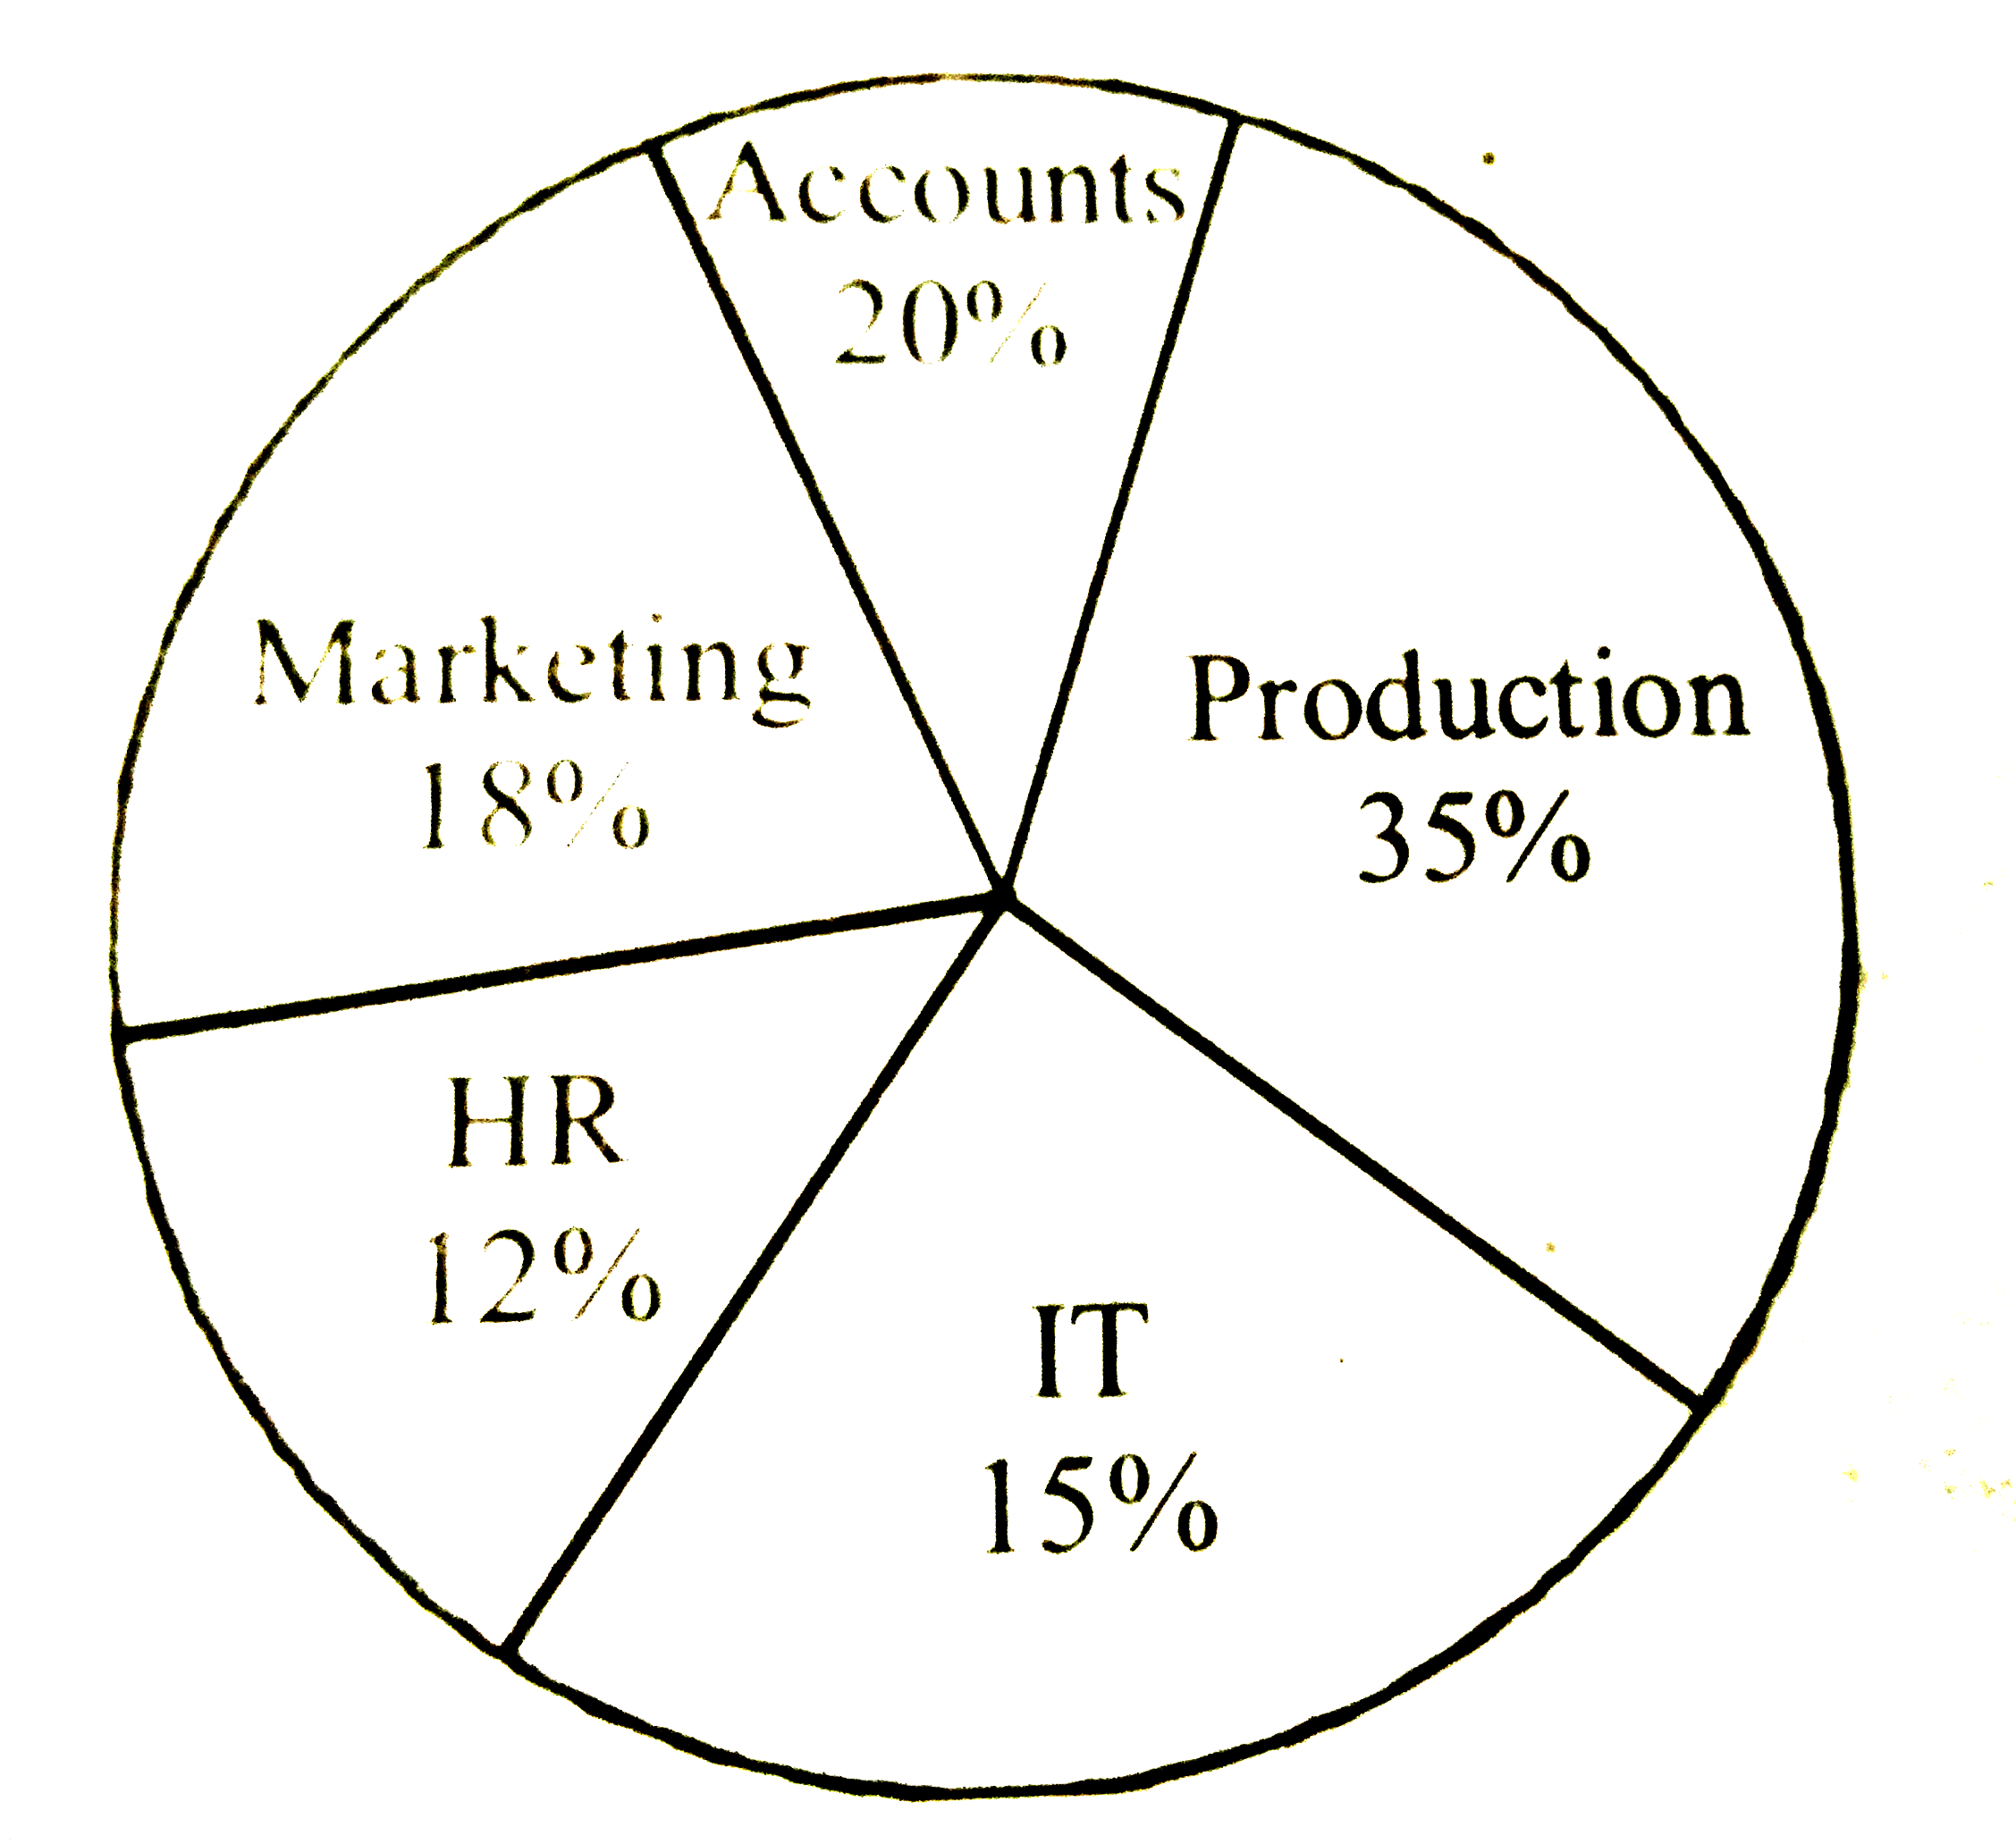
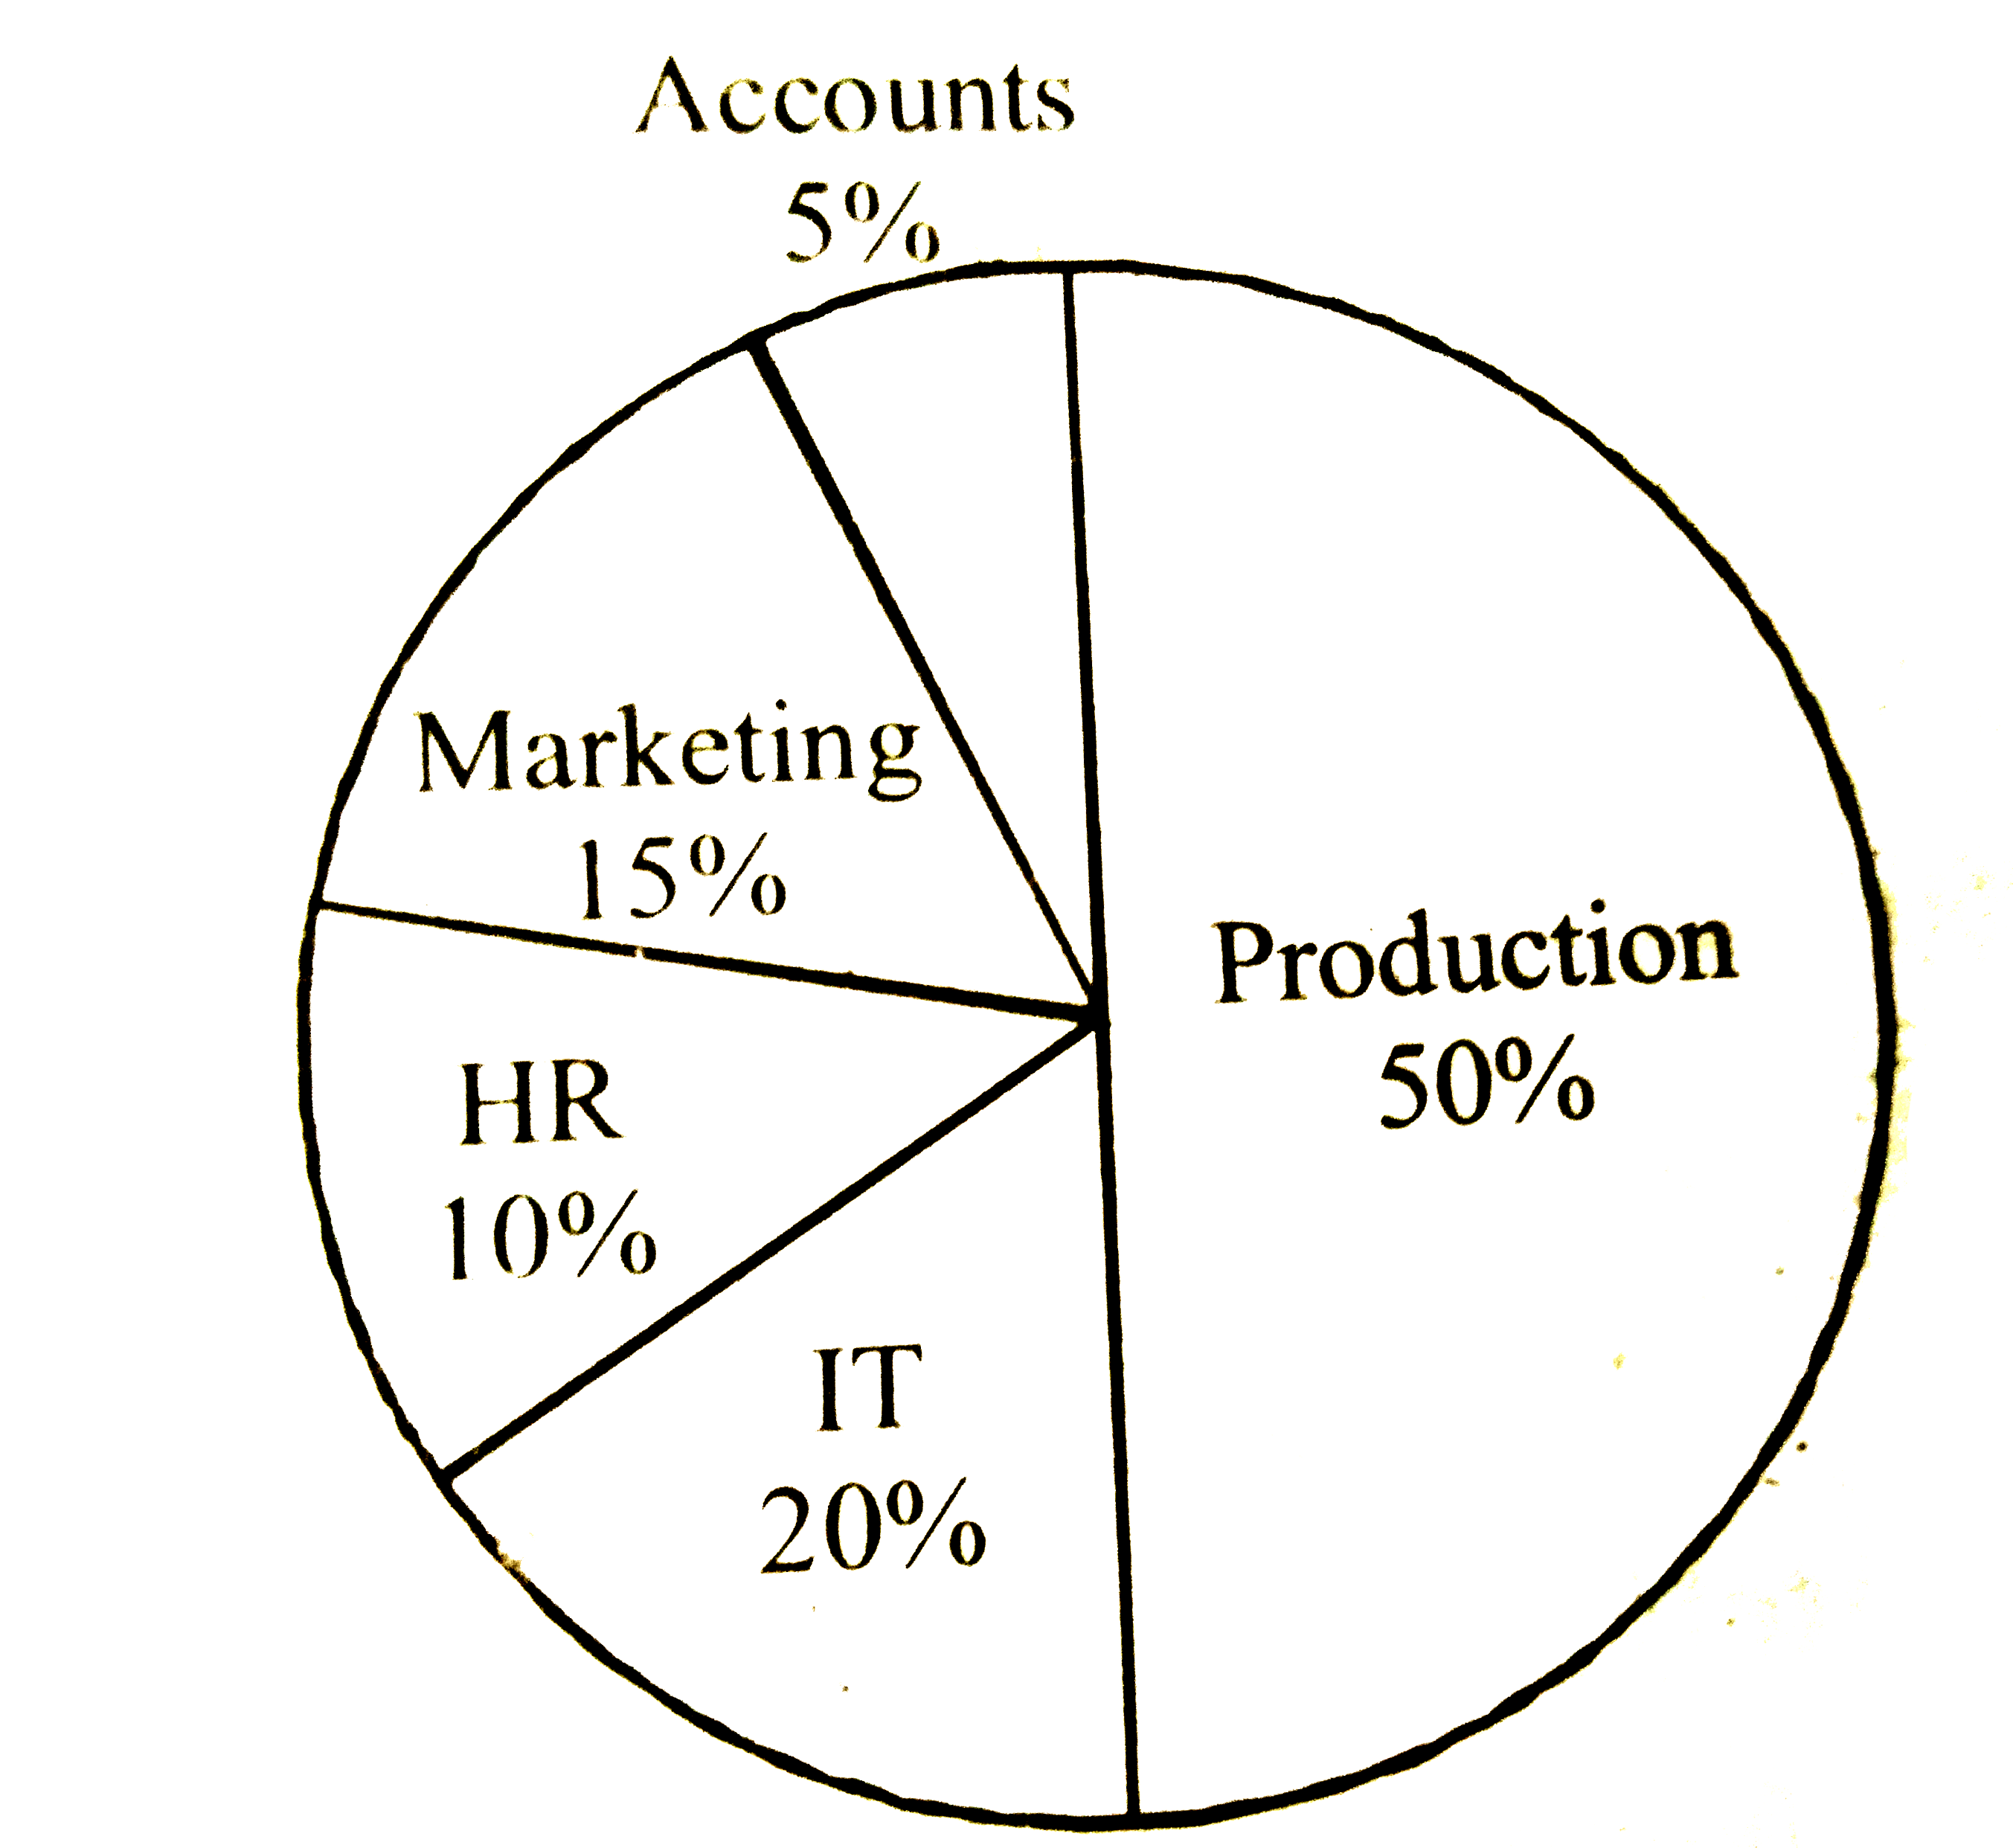
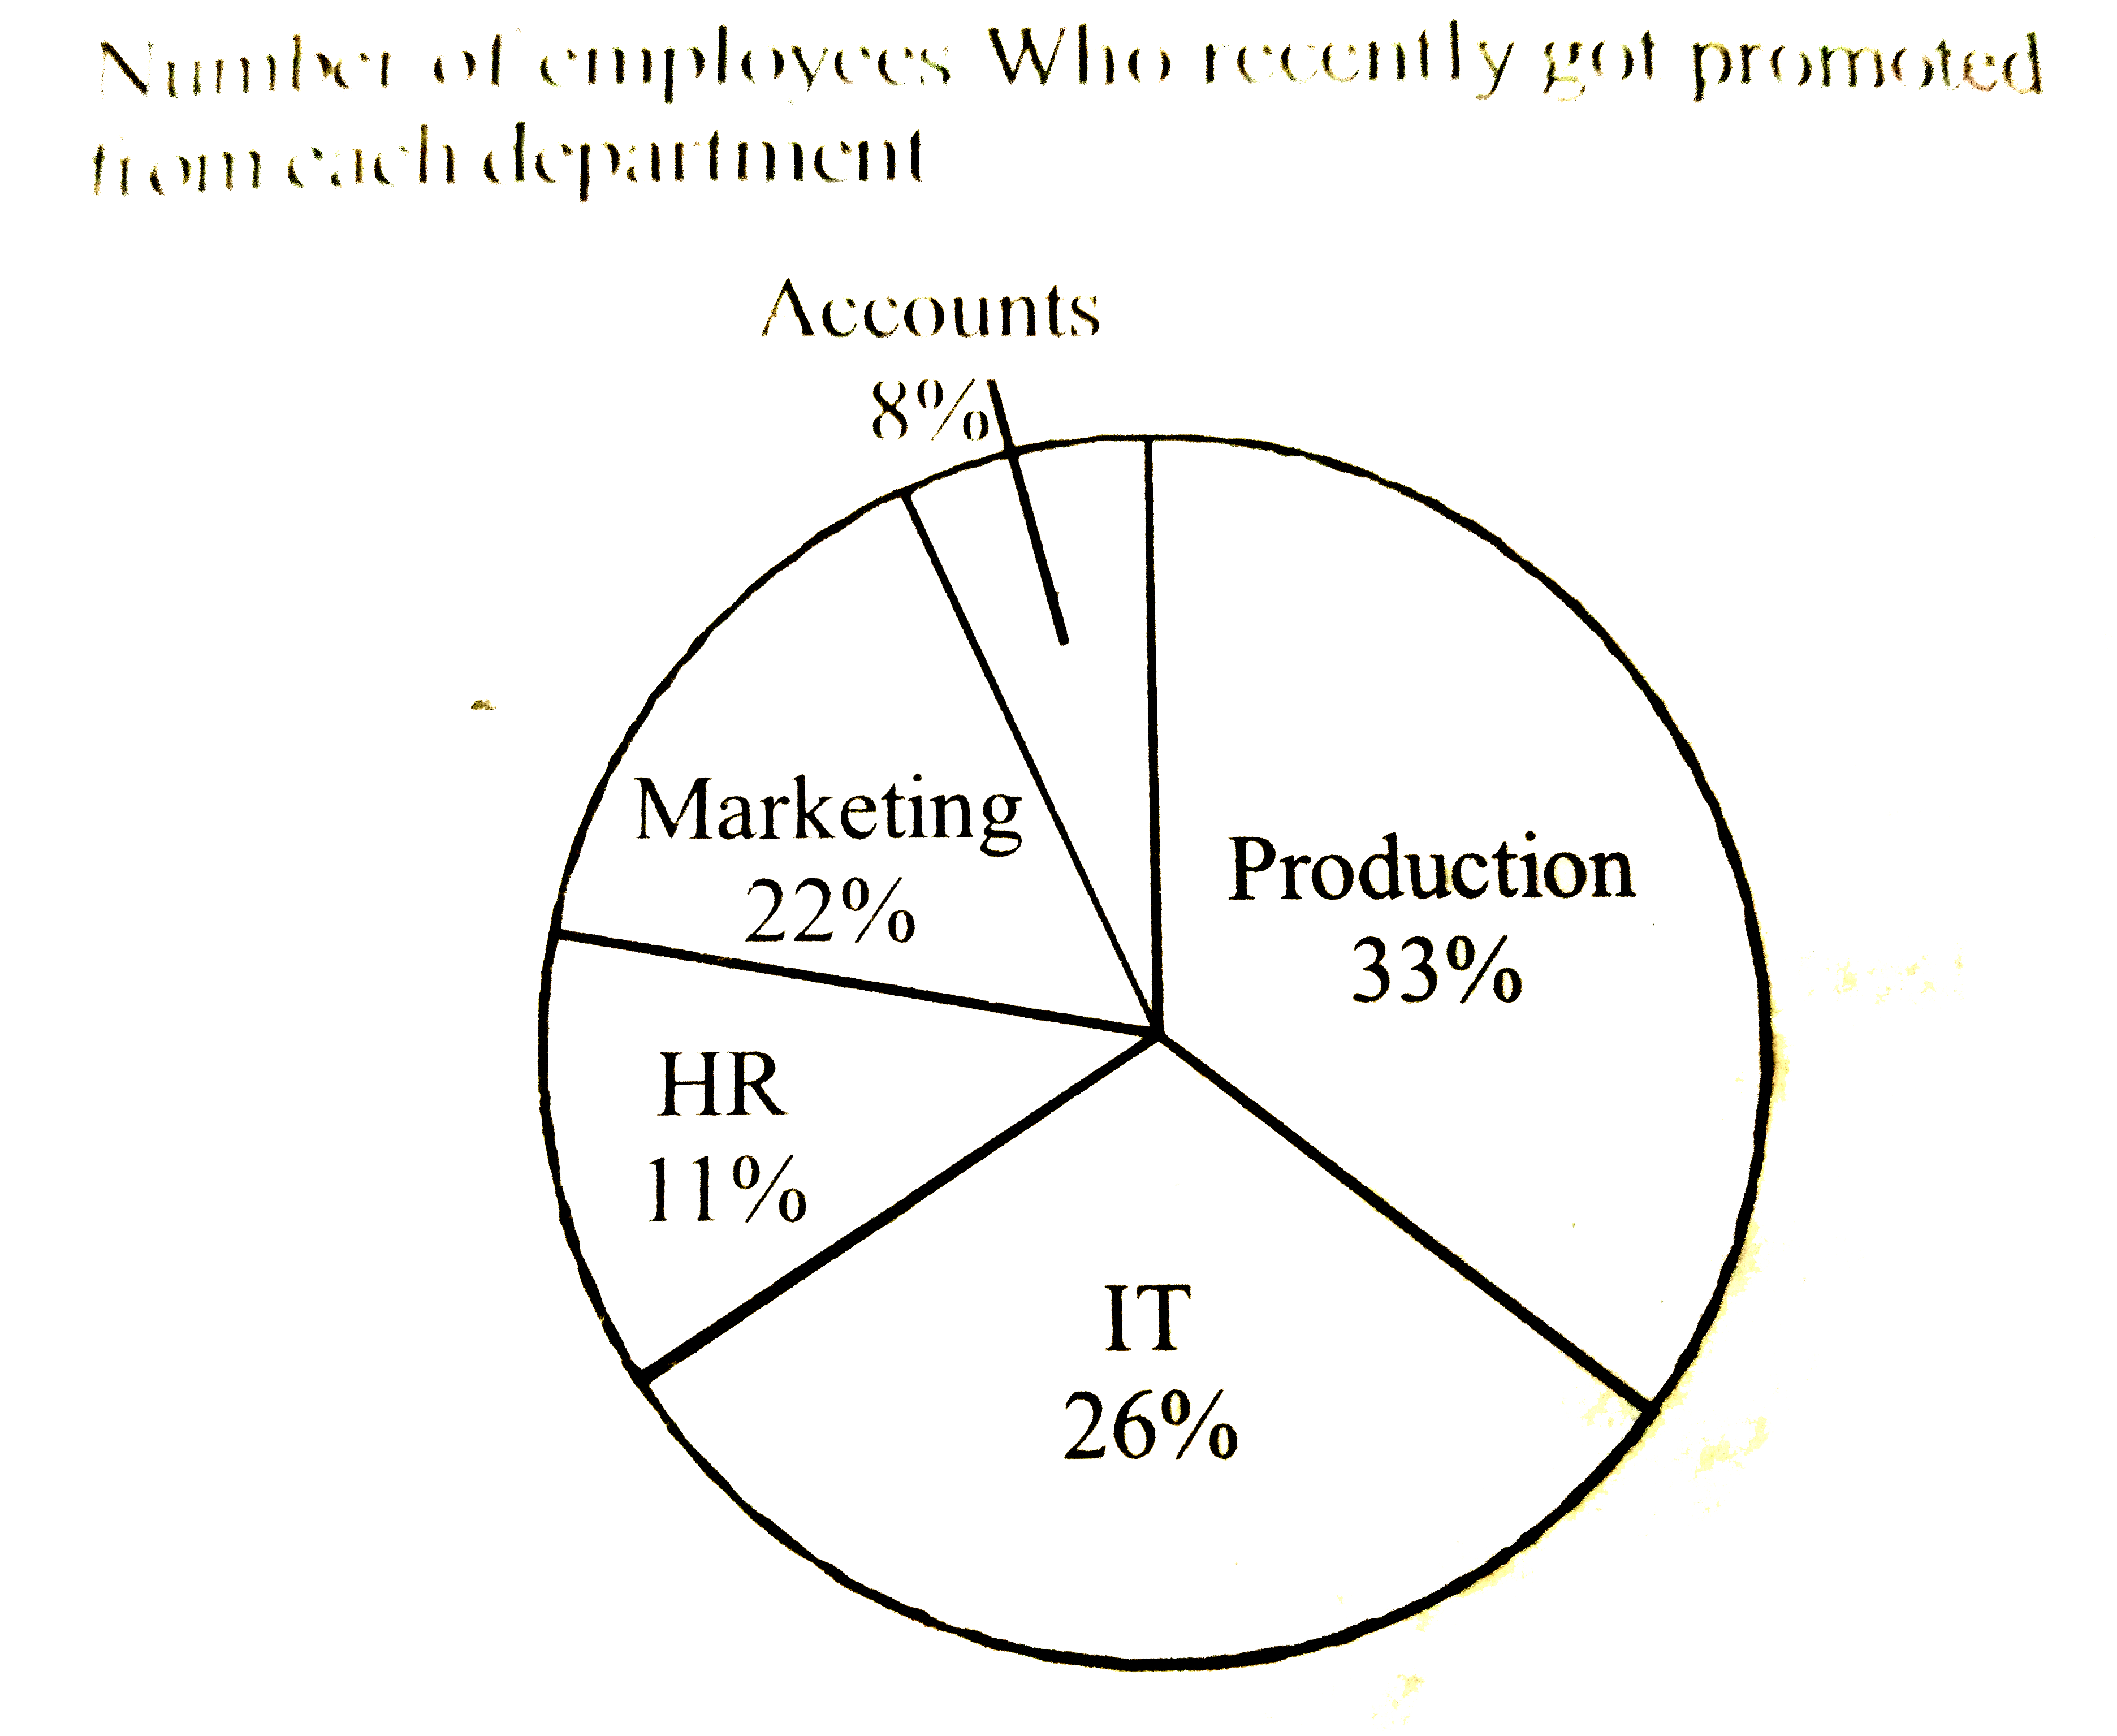
The number of eompolyees who got promoted from the HR department was two what percent of the total number of employees working in that department ? (rounded off to two digits after decimal )
View Solution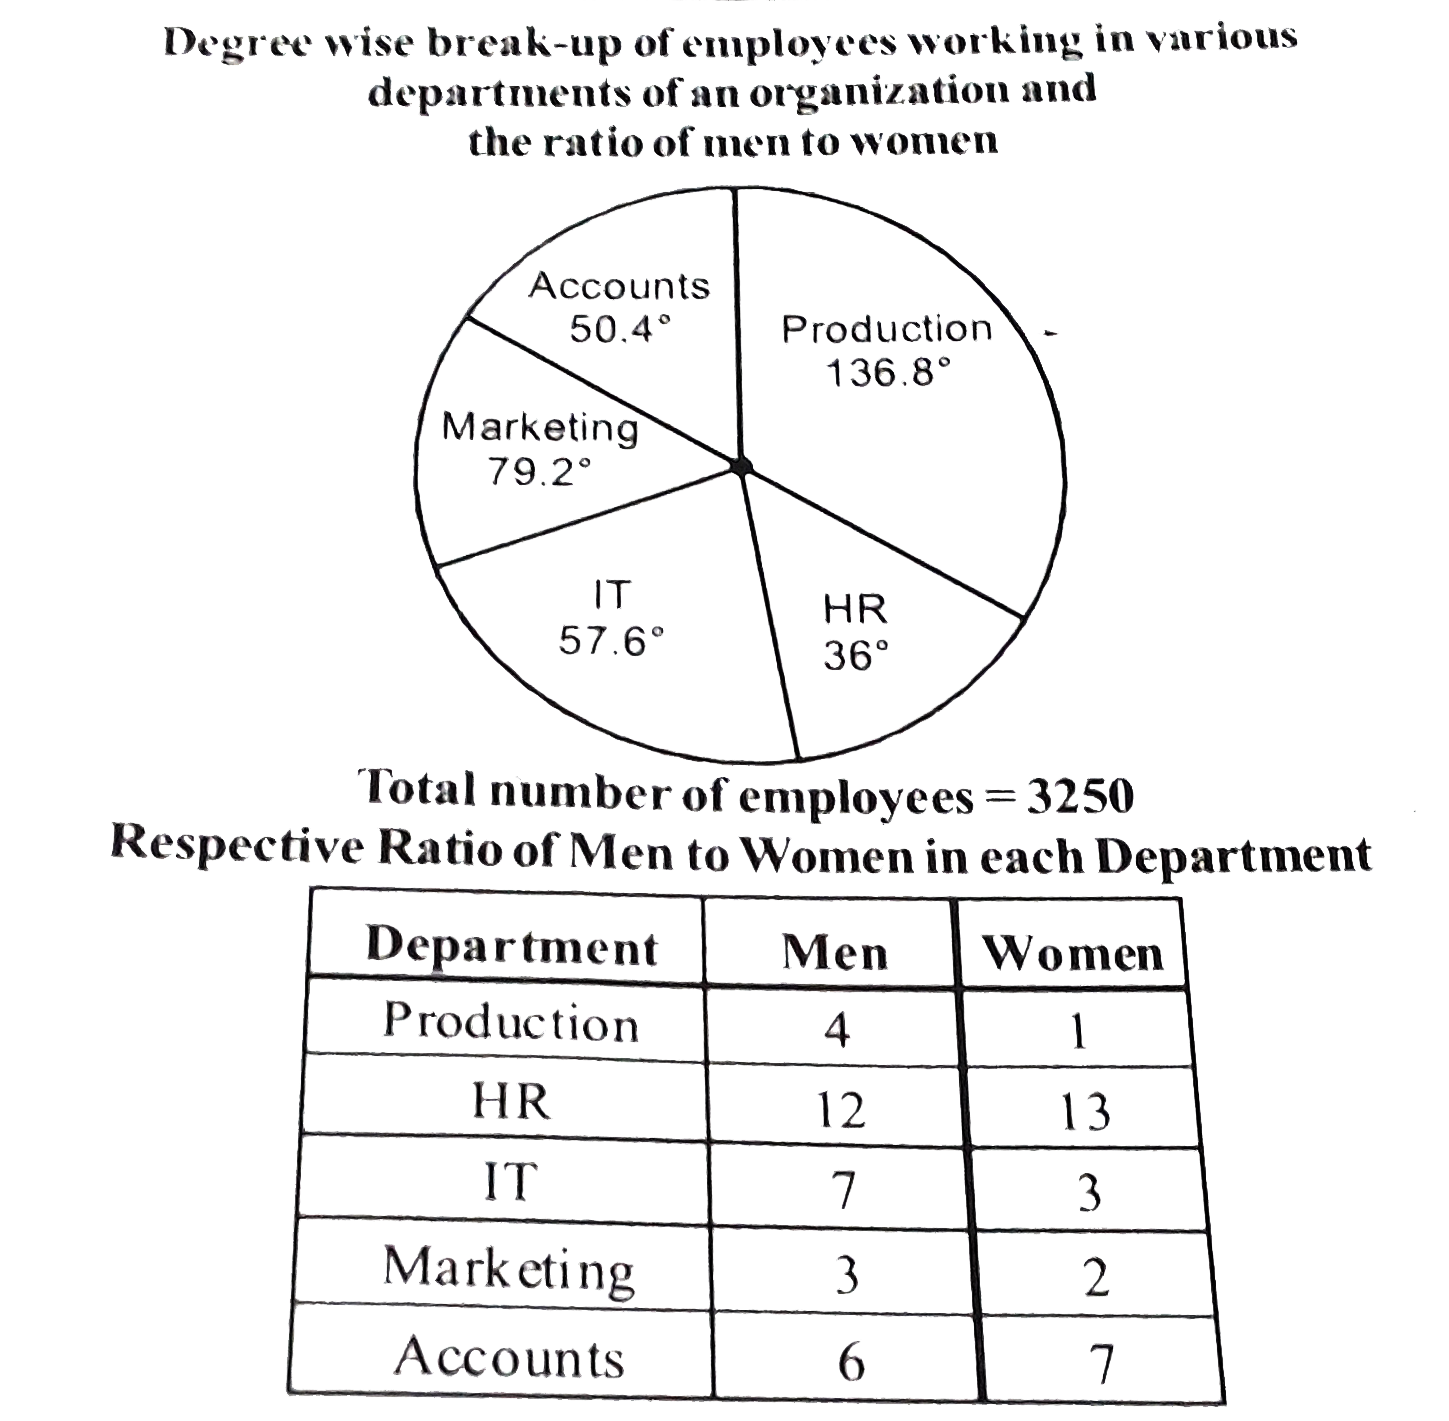
The number of men working in the production department of the organisation forms what per cent of the total number of employees working in that department ?
View SolutionThe bar graph shows the number of employees working in the different departments of a company. Study the diagram and answer the following questions.
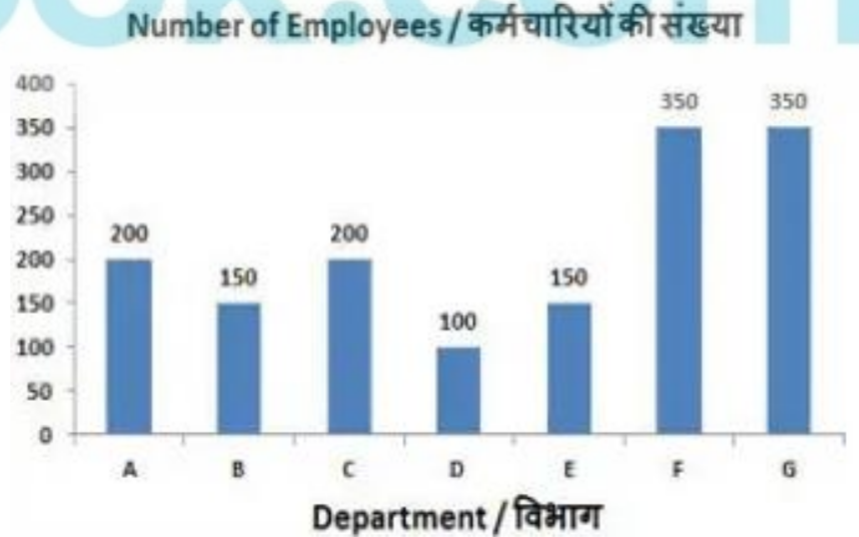
What is the ratio of number of employees of department A to that of department F?
View SolutionThe bar graph shows the number of employees working in the different departments of a company. Study the diagram and answer the following questions.
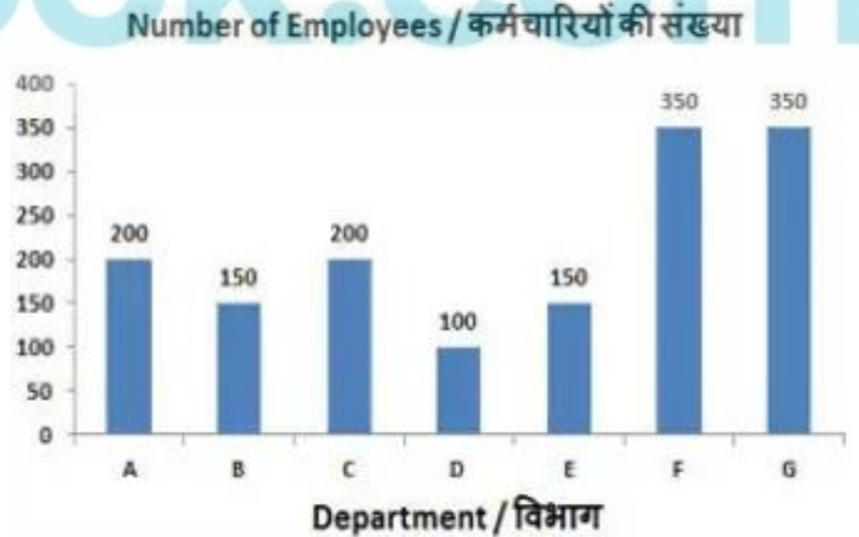
The number of employees of department G are greater than those of department C by ________.
View Solution
