The given bar graph shows the number of cars sold by two showrooms in five months. Study the graph carefully and answer the following questions
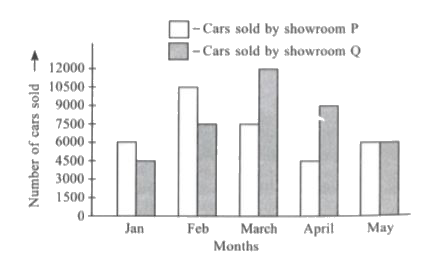
(a) How many less cars were sold by Showroom P than Showroom Q in January, March and April altogether?
(b) Find the ratio of total cars sold in February to the total number of cars sold in 5 months.
(a)(b)800012:49
(a)(b)800017:50
(a)(b)750017:50
(a)(b)750012:49
The correct Answer is:D
(a) Number of cars sold by Showroom P in January, March and April together = 6000 + 7500 + 4500 = 18000 Number of cars sold by Showroom Q in January, March and April together = 4500 + 12000 + 9000 = 25500 .
∴ Required difference = 25500 - 18000 = 7500
(b) Total cars sold in February = 10500 + 7500 = 18000
Total number of cars sold in 5 months = 6000 + 4500 + 10500 + 7500 + 7500 + 12000 + 4500 + 9000 + 6000 + 6000 = 73500
∴ Required ratio =1800073500=1249 i.e., 12:49
Topper's Solved these Questions
- IMO QUESTION PAPER 2020-21 SET ABOOK - SCIENCE OLYMPIAD FOUNDATION CHAPTER - IMO QUESTION PAPER 2020-21 SET AEXERCISE - Everyday mathematics
10 Videos
- IMO QUESTION PAPER 2020BOOK - SCIENCE OLYMPIAD FOUNDATION CHAPTER - IMO QUESTION PAPER 2020EXERCISE - Achievers section (HOTS)
5 Videos
- INTEGERSBOOK - SCIENCE OLYMPIAD FOUNDATION CHAPTER - INTEGERSEXERCISE - ACHIEVERS SECTION (HOTS)
5 Videos
Similar Questions
Look at the bar graph and answer the following questions.
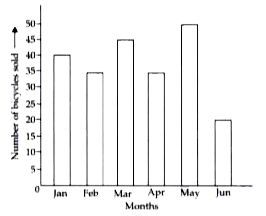
How many less bicycles sold in June than in March?
View SolutionThe bar graph shows the number of cars of different brands sold by a dealer in a month. Study the diagram and answer the following question.
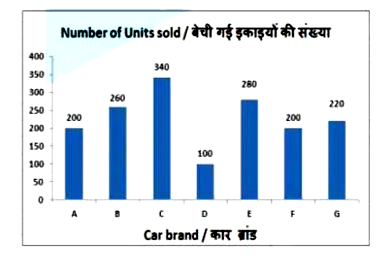
Units sold of which car brand were the second highest?
View Solution
Knowledge Check
Study the graph carefully and answer the following questions.
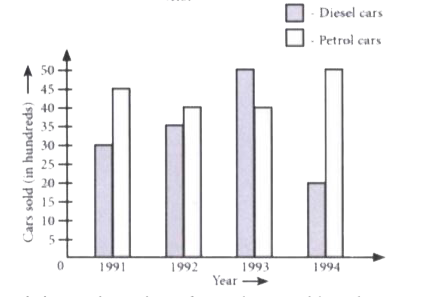
How many cars were sold during the year 1991?A9000B6500C7500D7000Study the graph carefully and answer the following questions.
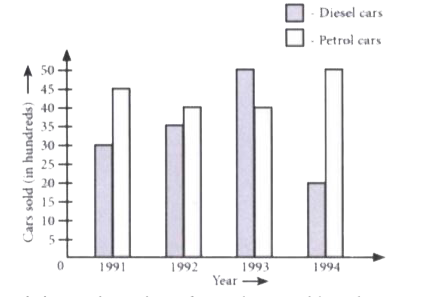
How many more Diesel cars were sold in 1991 than in 1994?A500B1500C1000D2000The table shows the number of cars sold by three showrooms over a period of six years.
यह तालिका तीन शोरूम द्वारा छः वर्षों की अवधि में बेची गयी कारों की संख्या दर्शाती है |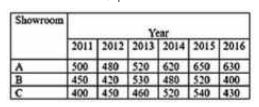 What is the average number of cars sold by showroom A over the given six years (nearest to one decimal place)?
दिए गए छः वर्षों में शोरूम A द्वारा बेची गयी कारों की औसत संख्या कितनी है ? (एक दशमलव स्थान के निकटतम )A586.7B566.7C594.7D592.7
The bar graph shows the number of cars of different brands sold by a dealer in a month. Study the diagram and answer the following question.
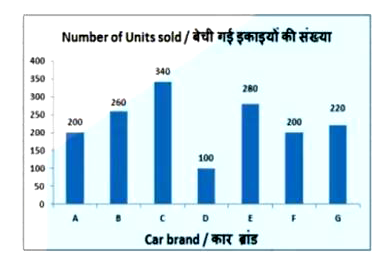
What is the ratio of units sold of brand G to that of brand E?
View SolutionRead the bar graph which shows the number of books sold by a bookstore during five consecutive years and answer the following questions
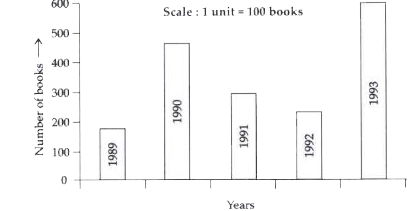
In which year lowest books were sold ?
View SolutionRead the bar graph which shows the number of books sold by a bookstore during five consecutive years and answer the following questions
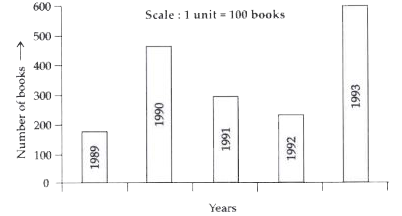
In which years were fewer than 200 books sold ?
View SolutionThe bar graph shows the number of cars of different brands sold by a dealer in a month. Study the diagram and answer the following questions.
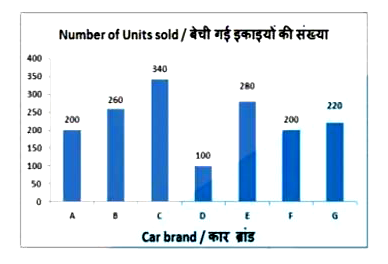
Units sold of brand D was lesser than that of brand F by _______.
View SolutionStudy the graph carefully and answer the following questions.
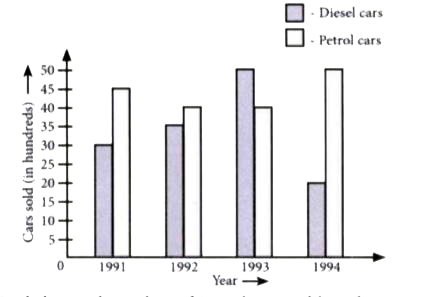
Find the total number of Diesel cars sold in the year 1992 and 1994 together.
View Solution
