The record of the enrollment of boys and girls in a school over 6 years has been presented in the following bar graph.
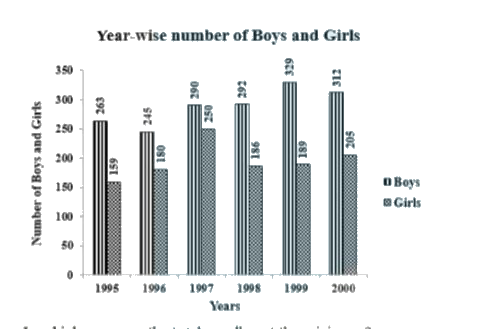
In which year was the total enrollment the minimum?
2000
1996
1995
1998
The correct Answer is:C
Step by step video, text & image solution for The record of the enrollment of boys and girls in a school over 6 years has been presented in the following bar graph. In which year was the total enrollment the minimum? by Maths experts to help you in doubts & scoring excellent marks in Class 14 exams.
Updated on:21/07/2023Similar Questions
The graph given below shows the number of enrolments of nursery children over a period of 6 years.
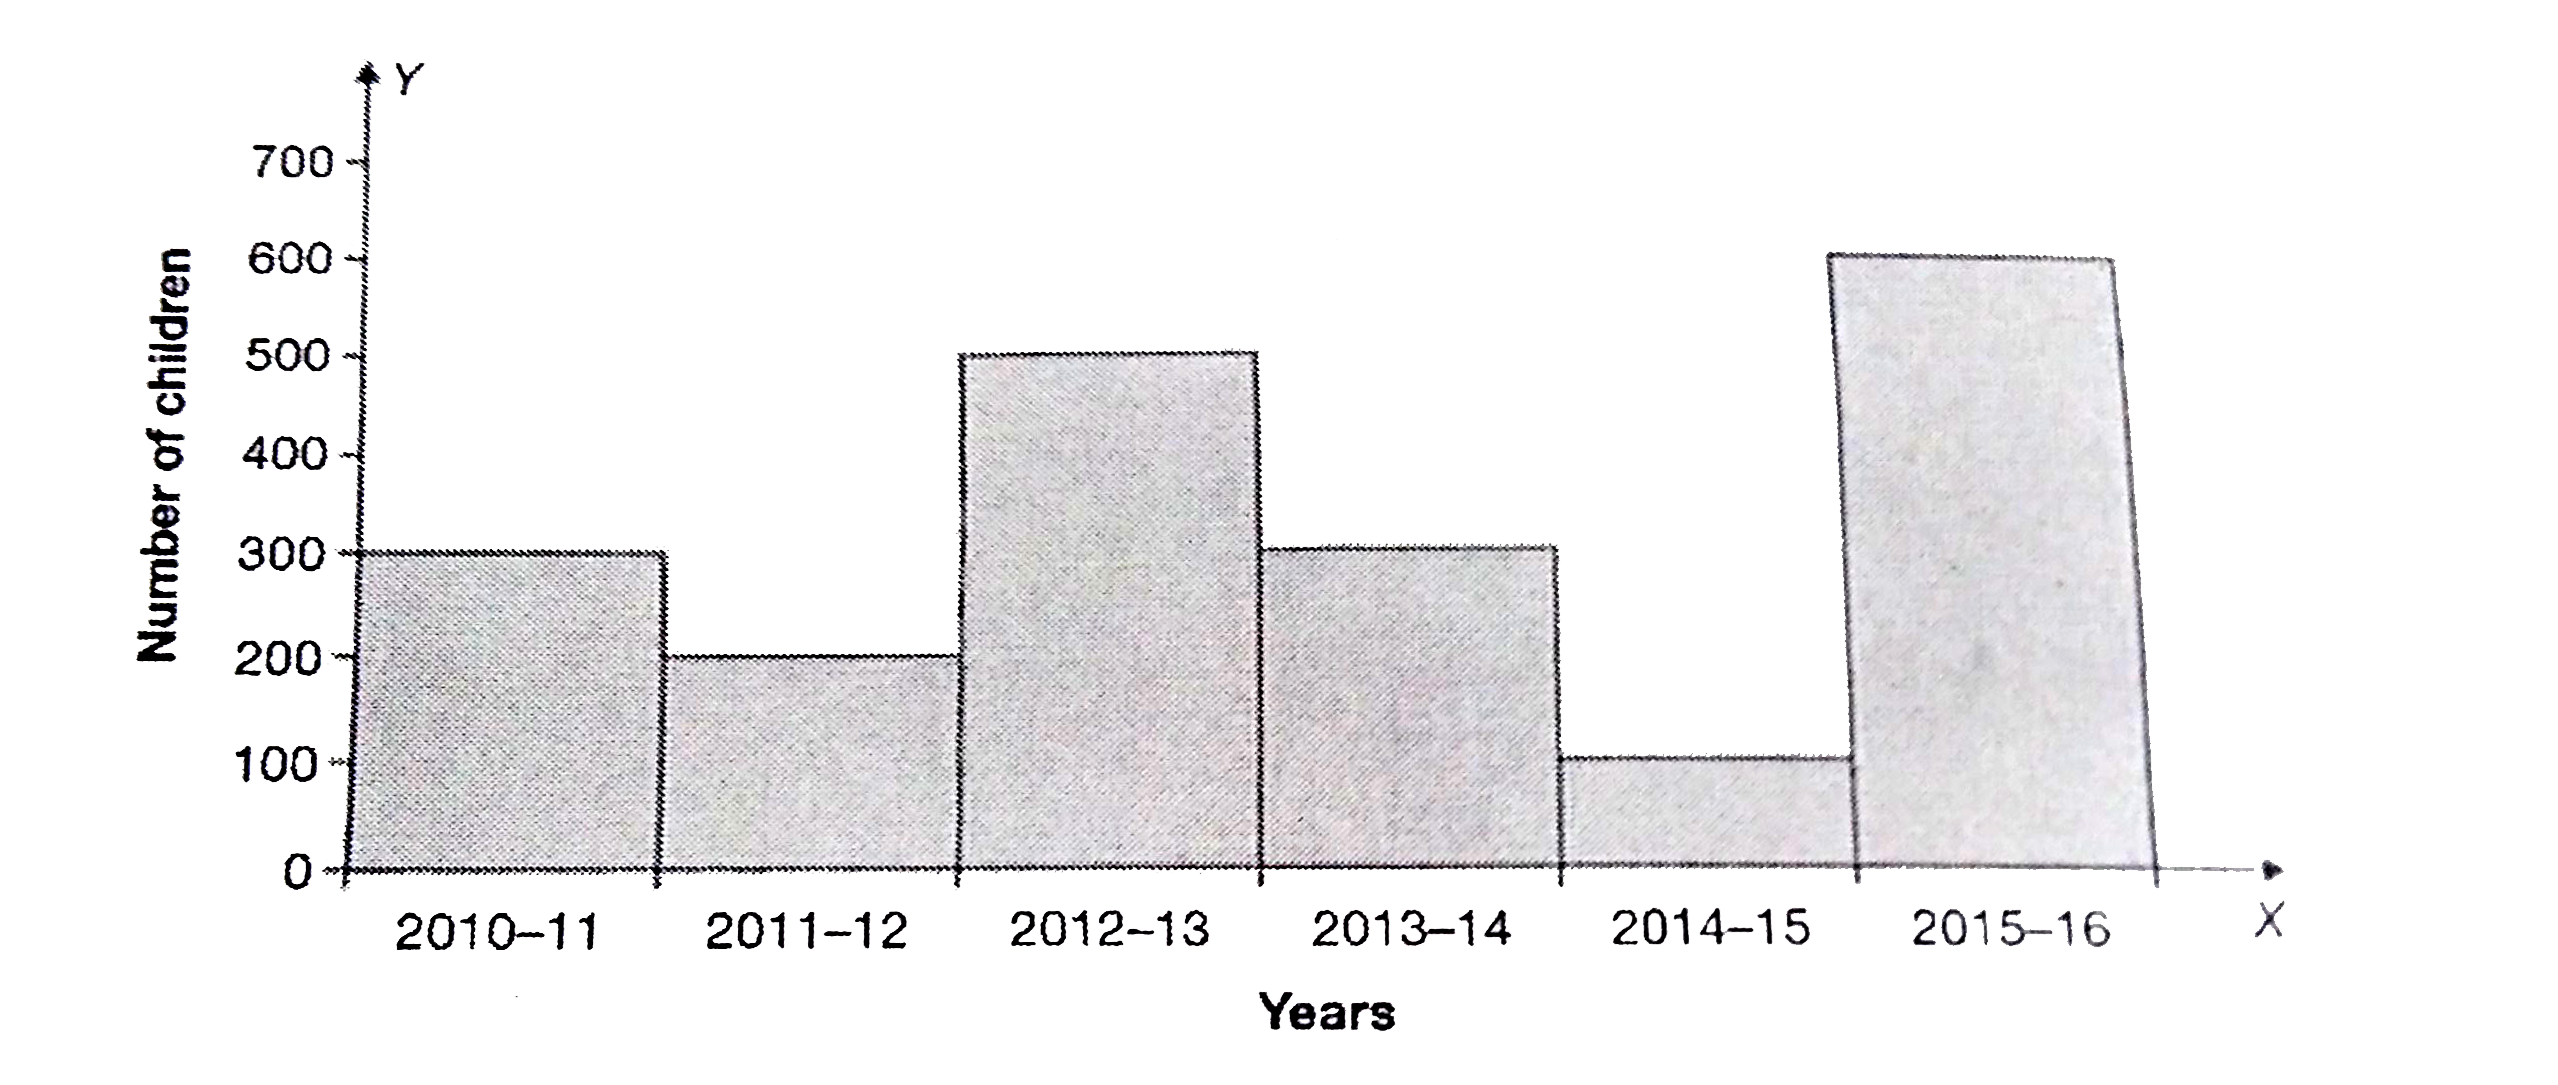
Study the graph carefully answer the following questions.
(i) In which year was the enrolment of children highest ?
(ii) In which two years was enrolment of children equal ?
(iii) What was the increase in the number of children between 2013-14 and 2015-16
View SolutionThe given bar graph shows the number of students of two schools over a period of six years.
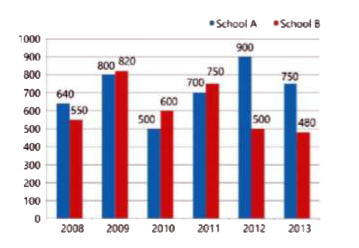
In the bar graph, in which year is the absolme difference of the students from schools A to B taken together, the maximum?
View Solution
Knowledge Check
The given bar graph represents the number of boys and girls in five different schools. Study the graph and answer the question that follows
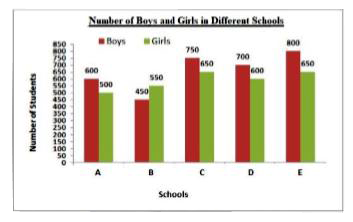
In which school is the percentage of girls the lowest ?AABBCEDCThe given bar graph represents the number of boys and girls in five different schools. Read the graph and answer the question that follows.
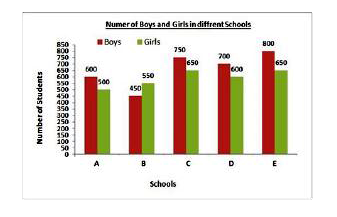
In which school is the percentage of boys more than 55%?ACBBCEDAThe number of students enrolled in different streams in a college is shown in the following table.

The ratio of the total number of boys to that of girls in the college is:A1:1B23:27C13:12D27:23
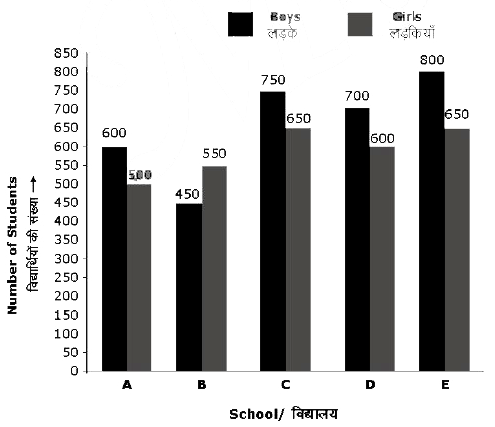
In the given bar graph what is the ratio of the total boys and girls in all schools
View SolutionThe given bar graph shows the amount of wheat purchased by government during the year 1998-2002.
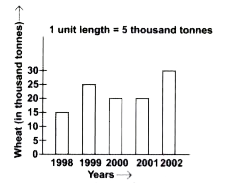
Read the bar graph and write down your observations. In which year was
the wheat production minimum ?
View SolutionThe given bar graph shows the number of students of two schools over a period of six years.
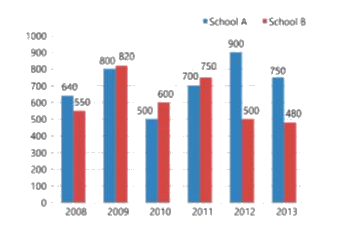
In the bar graph, what is the ratio of the average of the total students from school A to the average of the total students from school B ?
View SolutionThe given bar graph represents the number of boys and girls in five different schools. Read the graph and answer the question that follows.
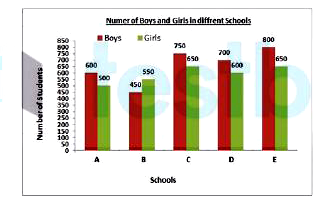
What is the average number of students (girls and boys) in schools A, B, C, D and E ?
View SolutionStudy the following graph carefully and answer the given questions :-
The following graph shows the % profit of two companies over the years :-
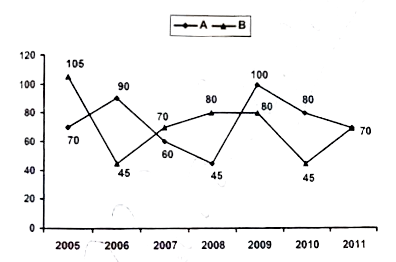
In which of the following years was the total income more than double the total expenditure in that year for company A ?
View Solution
