Study the following graph carefully and answer the given questions :-
The following graph shows the % profit of two companies over the years :-
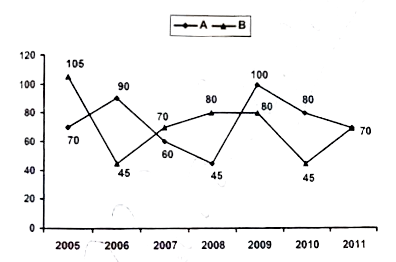
In which of the following years was the total income more than double the total expenditure in that year for company A ?
2010
2009
2006
none of these
The correct Answer is:D
Step by step video, text & image solution for Study the following graph carefully and answer the given questions :- The following graph shows the % profit of two companies over the years :- In which of the following years was the total income more than double the total expenditure in that year for company A ? by Maths experts to help you in doubts & scoring excellent marks in Class 14 exams.
Updated on:21/07/2023Topper's Solved these Questions
Similar Questions
Study the following graph carefully and answer the given questions :-
The following graph shows the % profit of two companies over the years :-
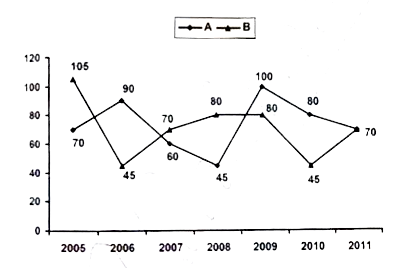
If income of company A in the year 2006 and 2009 are same then what is the respective ratio of expenditure of company A in both the same years ?
View SolutionStudy the following graph carefully and answer the questions that follow
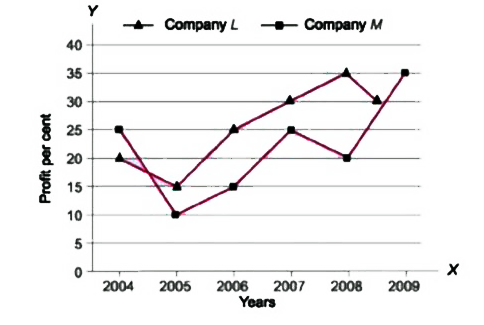
What was the average per cent rise in profit of company L over all the years together ?
View Solution
Knowledge Check
Study the following graph carefully and answer the given questions :-
The following graph shows the % profit of two companies over the years :-
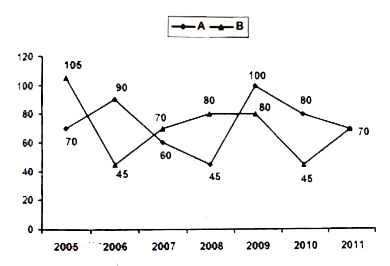
In which of the following years the ratio of expenditure to income was the least for company B?A2006B2009C2008D2005Study the following graph carefully and answer the given questions :-
The following graph shows the % profit of two companies over the years :-
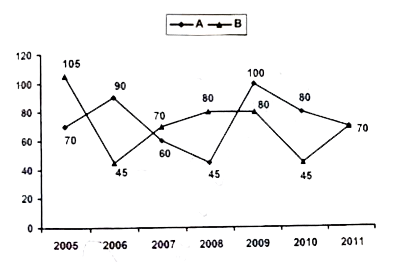
If the total expenditure of company A in 2007 was Rs 150 lakhs what was the total income ?AA) Rs 240 lakhsBB) Rs 250 lakhsCC) Rs 260 lakhsDD) Data inadequateStudy the following graph carefully and answer the given questions :-
The following graph shows the % profit of two companies over the years :-
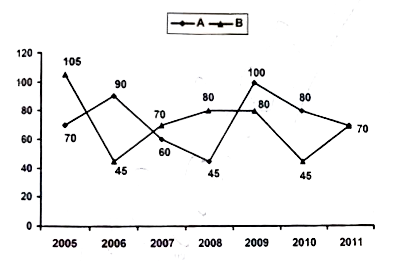
If the total income of company B in 2011 was Rs 200 lakhs what was the expenditure of company A in the same year ?A114.25 lakhB120.10 lakhC100.52 lakhDCan't be determined
Study the following graph carefully and answer the questions that
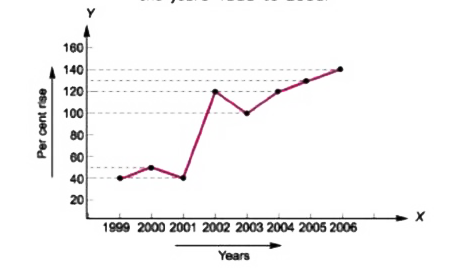
For how many years , the percent rise was more than 100 % ?
View SolutionStudy the following graph carefully to answer the question that follow
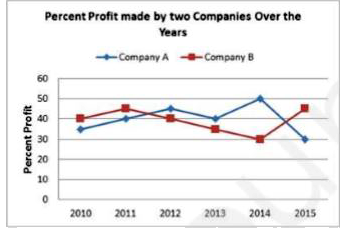
What is the average percent profit earned by company B over all the years together in (approx) ?
View SolutionStudy the following graph carefully and answer these questions :-
Expenditure and profit percent of a company in different years
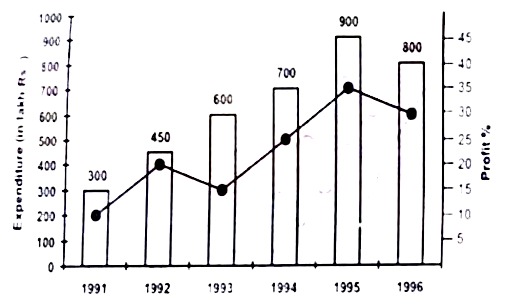
What is the average percentage profit for given years ?
View SolutionStudy the following graph carefully and answer the questions that follow
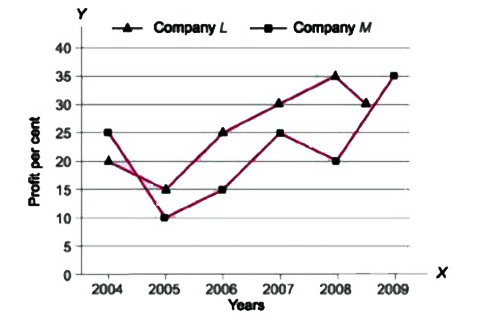
If the profit earned by company L in the year 2005 was ? 1.84 lak , what was the profit earned by the company in the year 2006 ?
View SolutionStudy the following graph carefully and answer these questions :-
Expenditure and profit percent of a company in different years
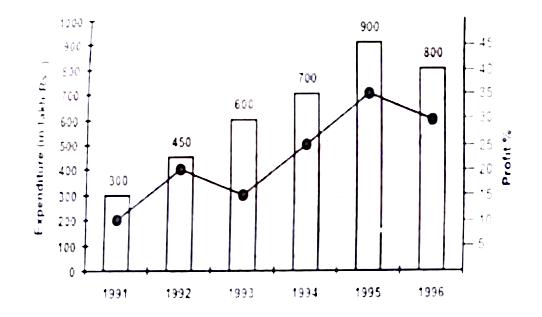
What is the total amount of profit earned in given years ?
View Solution
