If 5% of the total number of cars sold of model E is 750, then what is the average number of cars sold of all the models?
15000
14400
16800
14000
The correct Answer is:B
To solve the problem step by step, we will follow these calculations:
Step 1: Find the total number of cars sold of model E.
We know that 5% of the total number of cars sold of model E is 750. We can set up the equation as follows:
0.05×Total Cars Sold of Model E=750
Let P be the total number of cars sold of model E.
0.05P=750
Step 2: Solve for P.
To find P, we can rearrange the equation:
P=7500.05
Calculating this gives:
P=750×20=15,000
So, the total number of cars sold of model E is 15,000.
Step 3: Determine the value of 1 degree in the pie chart.
From the problem, we know that model E corresponds to 75 degrees in the pie chart. We can find the number of cars represented by 1 degree:
Value of 1 degree=Total Cars Sold of Model EDegrees for Model E=15,00075
Calculating this gives:
Value of 1 degree=200
Step 4: Calculate the total number of cars sold for all models.
The total degrees in a pie chart is 360 degrees. Therefore, the total number of cars sold for all models can be calculated as follows:
Total Cars Sold=Value of 1 degree×360=200×360
Calculating this gives:
Total Cars Sold=72,000
Step 5: Find the average number of cars sold of all models.
To find the average number of cars sold across all models, we divide the total number of cars sold by the number of models (which is 5):
Average=Total Cars SoldNumber of Models=72,0005
Calculating this gives:
Average=14,400
Final Answer:
The average number of cars sold of all models is 14,400.
---
We know that 5% of the total number of cars sold of model E is 750. We can set up the equation as follows:
To find P, we can rearrange the equation:
From the problem, we know that model E corresponds to 75 degrees in the pie chart. We can find the number of cars represented by 1 degree:
The total degrees in a pie chart is 360 degrees. Therefore, the total number of cars sold for all models can be calculated as follows:
To find the average number of cars sold across all models, we divide the total number of cars sold by the number of models (which is 5):
The average number of cars sold of all models is 14,400.
Similar Questions
The given double bar graph shows the sale of mobile phone and cars from 2005 to 2008
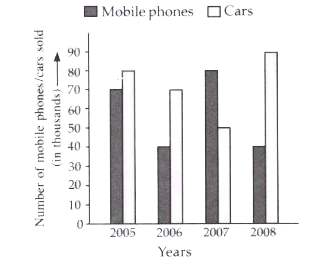
(i) Find the ratio of the tatal number of mobile phones sold in 2006 and 2008 to the total number of cars sold in 2005 and 2007
(ii) What is the average number of cars sold from 2005 to 2008
View SolutionThe given pie-chart shows the distribution (in degrees) of cars sold of difference models by a company in 2015-16.
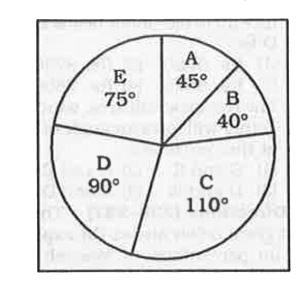
If the number of cars sold of model D is 40500, what is the ratio between the number of cars sold of models D and E ?
View Solution
Knowledge Check
The given pie-chart shows the distribution (in degrees) of cars sold of difference models by a company in 2015-16.
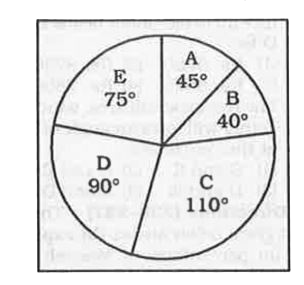
If the number of cars sold of model D is 72900, then what is the total number of cars sold of all the models together by the company ?A291600B208100C162000D214160If the number of cars sold of model D is 72900, then what is the total number of cars sold of all the models together by the company?
A291600B208100C162000D214160If the number of cars sold of model D is 40500, what is the ratio between the number of cars sold of model D and E?
A9:5B6:5C11:9D9:7
The given pie-chart shows the distribution (in degrees) of cars sold of difference models by a company in 2015-16.
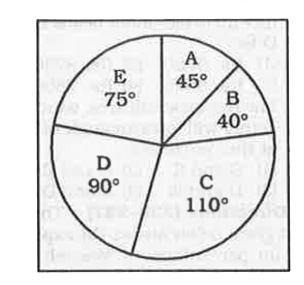
If number of cars sold of model C are 22000, then what will be the difference in the number of cars sold of models A and B ?
View SolutionIf number of cars sold of model C are 22000, then what will be the difference in the number of cars sold of model A and B?
View SolutionWhat was the average number of cars sold by A during Feb-Apr 2016
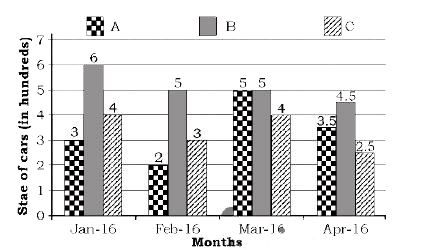
View SolutionIf the number of cars sold of model D is 40500, then how many more cars of model E are sold than that of A?
View SolutionThe given table represents the sale (in thousands) of cars by four companies A,B,C and D in six years. Study the table and answer the questions that follow:
दी गयी तालिका चार कंपनियों - A, B, C और D के द्वारा छः वर्षों में की गयी कारों की बिक्री ( हज़ार में ) दर्शाती है | इस तालिका का अध्ययन करें तथा फिर पूछे गए प्रश्नों के उत्तर दें |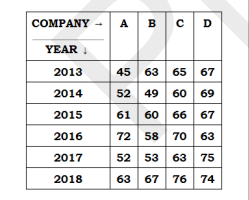 What is the ratio of total number of cars sold by companies A,B and D in 2017 to the total number
of cars sold by all companies in 2018?
कंपनी A, B और D के द्वारा 2017 में बेची गयी कारों की कुल संख्या तथा 2018 में सभी कंपनियों के द्वारा बेची गयी कारों की कुल संख्या के बीच क्या अनुपात है ?
View Solution
