Study the following bar graph and pie-chart carefully and answer the question given below:
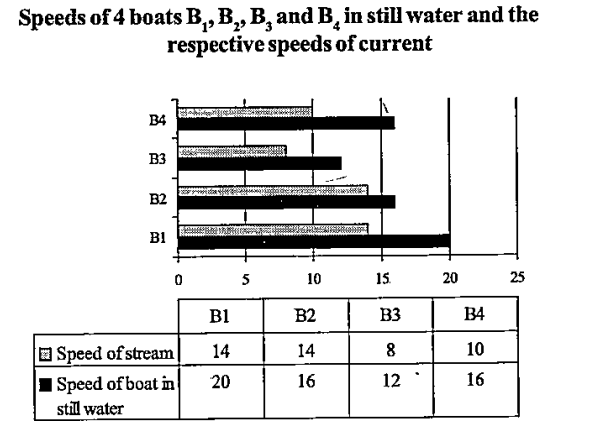
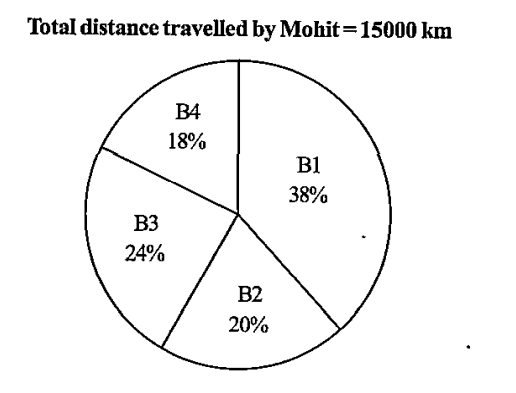
What is the difference between the time taken by boat B1 and boat B2 to travel 300 km upstream?
100 hours
101 hours
99 hours
98 hours
The correct Answer is:A
Step by step video & text solution for Study the following bar graph and pie-chart carefully and answer the question given below: What is the difference between the time taken by boat B1 and boat B2 to travel 300 km upstream? by Maths experts to help you in doubts & scoring excellent marks in Class 14 exams.
Updated on:21/07/2023Similar Questions
Read the following graph carefully and answer the questions given below:
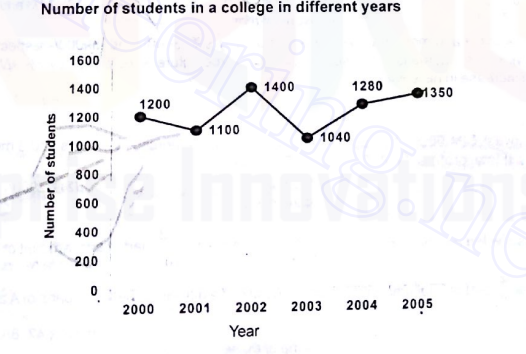
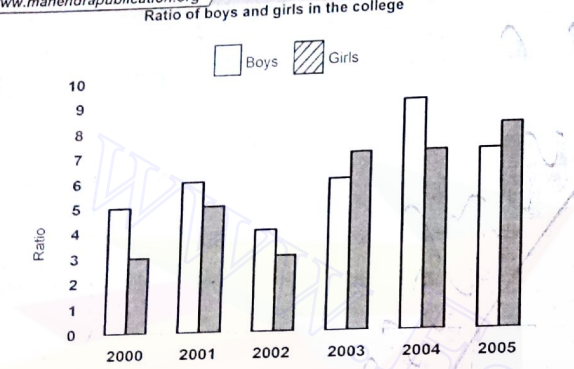
What is the difference between the number of boys and girls in the year 2004 ?
View SolutionStudy the following Pie-Chart carefully to answer the questions given below.
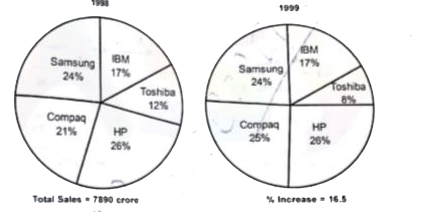
What is the ratio between the Compaq sales in 1998 and that of IBM in 1999 ?
View Solution
Knowledge Check
Study the following graph carefully and answer the question given below-----
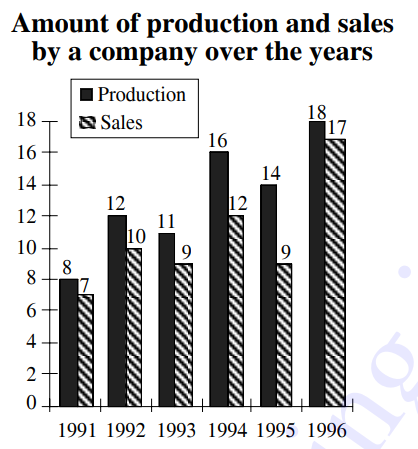
What was the difference between the sales of 1992 and 1995 ?A10 lakh tonnesB50 thousand tonnesC1 lakh tonnesD75 thousand tonnesStudy the following graph carefully and answer the questions given below
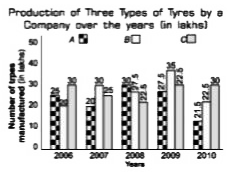
What was the difference between the number of B type tyres manufactured in 2008 and 2009?A100000B2000000C1000000Dnone to theseDirections (Q. Nos. 1 - 5) Study the following graph and pie chart carefully and answer the Questions that follow.
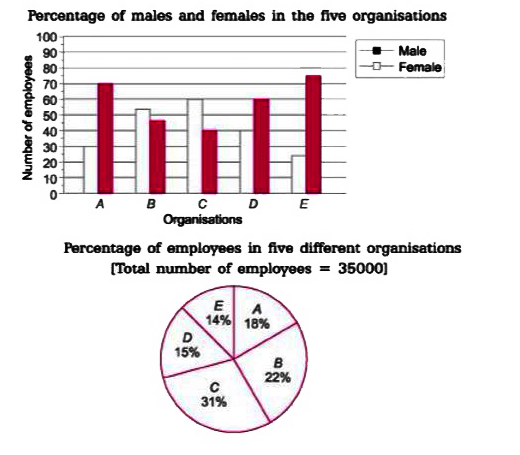
What is the difference between the number of females in organisation B and the number of females in organization .E?A2100B3010C1700D3000
Study the following graph carefully and answer the following questions -----
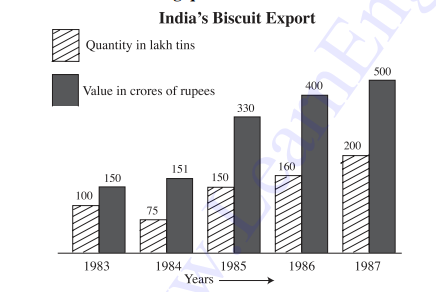
What was the difference between the tins exported in 1985 and 1986 ?
View SolutionStudy the following graph carefully and answer the question given below-----
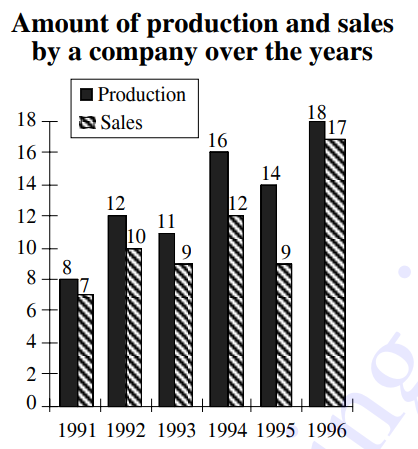
What was the percentage drop in sales from 1992 to 1993 ?
View SolutionStudy the following table carefully and answer the questions given below it-
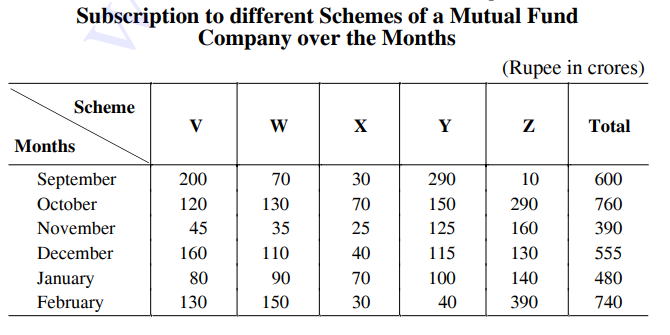
What is the difference in the subscription of V scheme between December and January?
View SolutionStudy the following graph carefully and answer the questions given below it -----
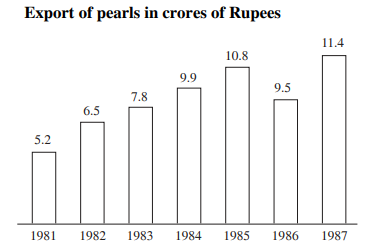
What was the percentage increase in export from 1986 to 1987 ?
View SolutionStudy the following graph carefully to answer the questions given below.
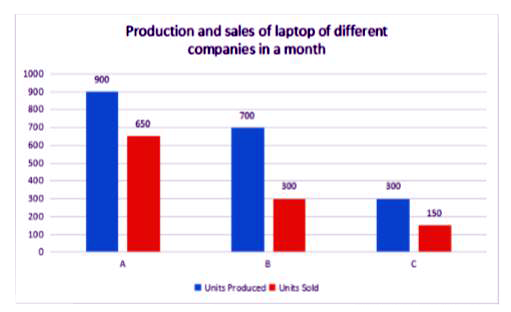
What is the average number of Units produced by all the Companies together?
View Solution