Study the following Pie-Chart carefully to answer the questions given below.
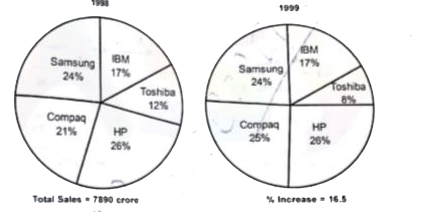
What is the ratio between the Compaq sales in 1998 and that of IBM in 1999 ?
0.94
1.06
1.13
0.89
The correct Answer is:B
Step by step video, text & image solution for Study the following Pie-Chart carefully to answer the questions given below. What is the ratio between the Compaq sales in 1998 and that of IBM in 1999 ? by Maths experts to help you in doubts & scoring excellent marks in Class 14 exams.
Updated on:21/07/2023Topper's Solved these Questions
Similar Questions
Study the following graph carefully and answer the questions given below-
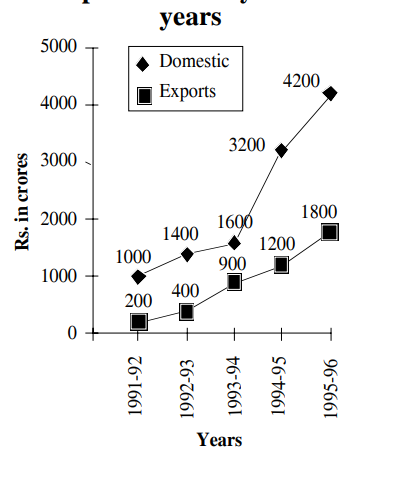
What was the difference between the total hardware sale in export sector in 1992-93 and 1993-94 together and hardware sale in domestic sector in 1993-94?
View SolutionStudy the following Pie-Chart carefully to answer the questions given below.
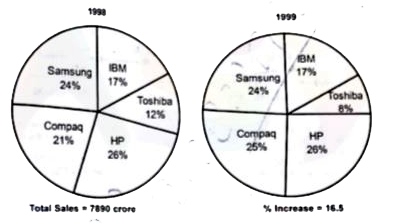
The percentage increase/decrease in the sales of Toshiba in 1999 is approximately-
View Solution
Knowledge Check
Study the following graph carefully and answer the question given below-----
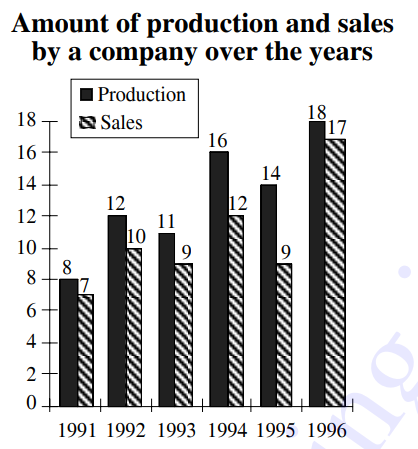
What was the difference between the sales of 1992 and 1995 ?A10 lakh tonnesB50 thousand tonnesC1 lakh tonnesD75 thousand tonnesStudy the following Pie-Chart carefully to answer the questions given below.
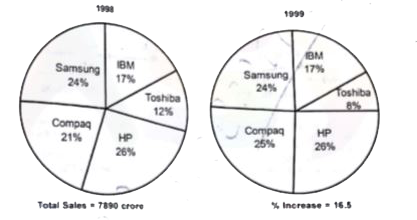
IBM's sales in 1998 is what percentage of the sales of Samsung in 1999 ?A0.4634B0.5234C0.57D0.608Study the following graph carefully and answer the question given below-----
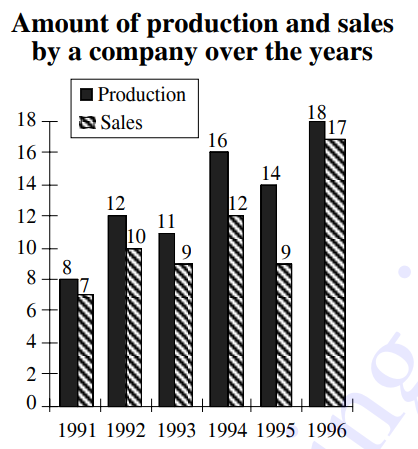
What was the percentage drop in sales from 1992 to 1993 ?A1B10C20D15
Study the following Pie-Chart carefully to answer the questions given below.
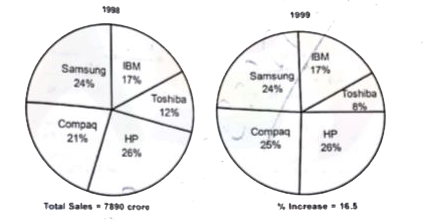
For which brand of computers the sales difference is minimum in terms of absolute value between the two years?a)IBM b)Samsung c)HP d)Toshiba
View SolutionRead the following pie-charts carefully to answer the questions.
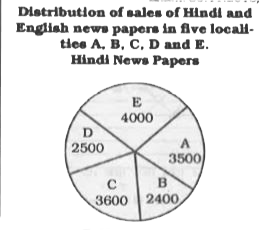
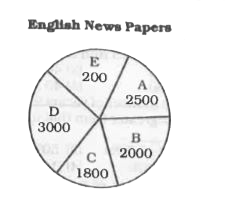
What is the difference between the total sale of English newspapers and the total sale of Hindi newspapers in all the localities together.?
View SolutionStudy the following Pie-Chart carefully to answer the questions given below.
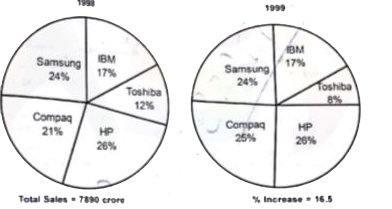
Which brand of computers among those shown exhibited the highest rate of growth in the two years ?
View SolutionStudy the following graph carefully and answer the questions given below –
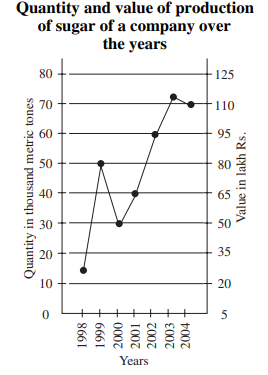
What was the difference between the average production of sugar during the average production of sugar during the year 1998, 1999, 2000 and 2001 and that of 2001, 2002, 2003 and 2004 in thousand metric tons?
View SolutionStudy the following table carefully to answer these questions ---
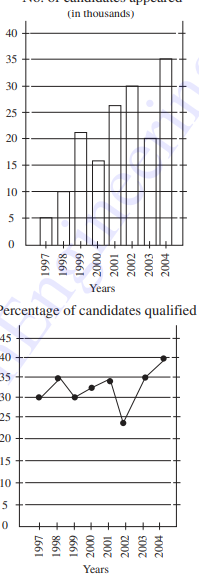
What is the average approximate number of passed students in 1998 all states ?
View Solution
