Refer to the graph and answer the given questions
Data related to number of cookies baked by two Bakeries
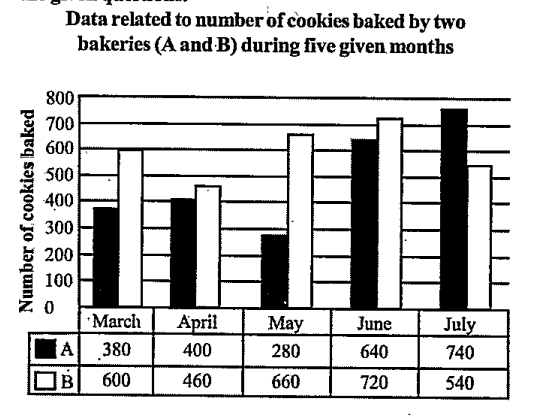
What is the difference between average number of cookies baked by bakery A in March and May together and' average number of cookies baked by bakery B in April and June together?
240
300
260
90
The correct Answer is:C
Step by step video, text & image solution for Refer to the graph and answer the given questions Data related to number of cookies baked by two Bakeries What is the difference between average number of cookies baked by bakery A in March and May together and' average number of cookies baked by bakery B in April and June together? by Maths experts to help you in doubts & scoring excellent marks in Class 14 exams.
Updated on:21/07/2023Similar Questions
Directions: Refer to the following graph and answer the given questions. Data related to the number of shoes sold by two stores (A and B )during five years:
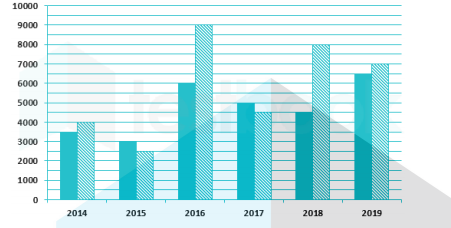
What is the difference between the total number of shoes sold by store A in 2018 and 2019 together and the total number of shoes sold by store B in 2014 and 2015 together?
View SolutionDirections: Refer to the following graph and answer the given questions. Data related to the number of shoes sold by two stores (A and B )during five years:
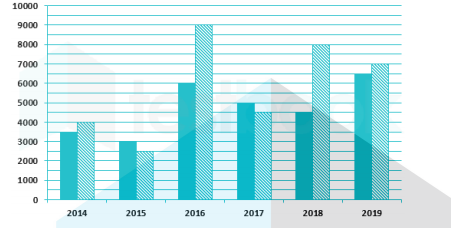
Find the ratio between the total number of shoes sold by stores A and B together in 2016 to the total number of shoes sold by stores A and B together in 2018?
View SolutionDirections: Refer to the following graph and answer the given questions. Data related to the number of shoes sold by two stores (A and B )during five years:
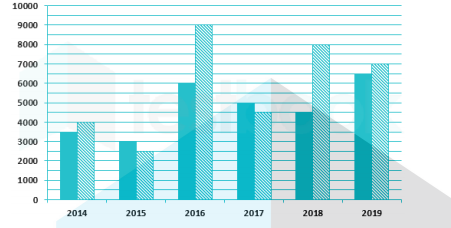
Find the difference between the total number of Shoes sold by Store A and B in all the years together?
View SolutionDirections: Refer to the following graph and answer the given questions. Data related to the number of shoes sold by two stores (A and B )during five years:
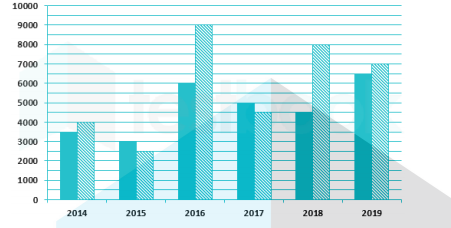
The number of shoes sold by store A decreased by what percent from 2017 to 2018?
View Solution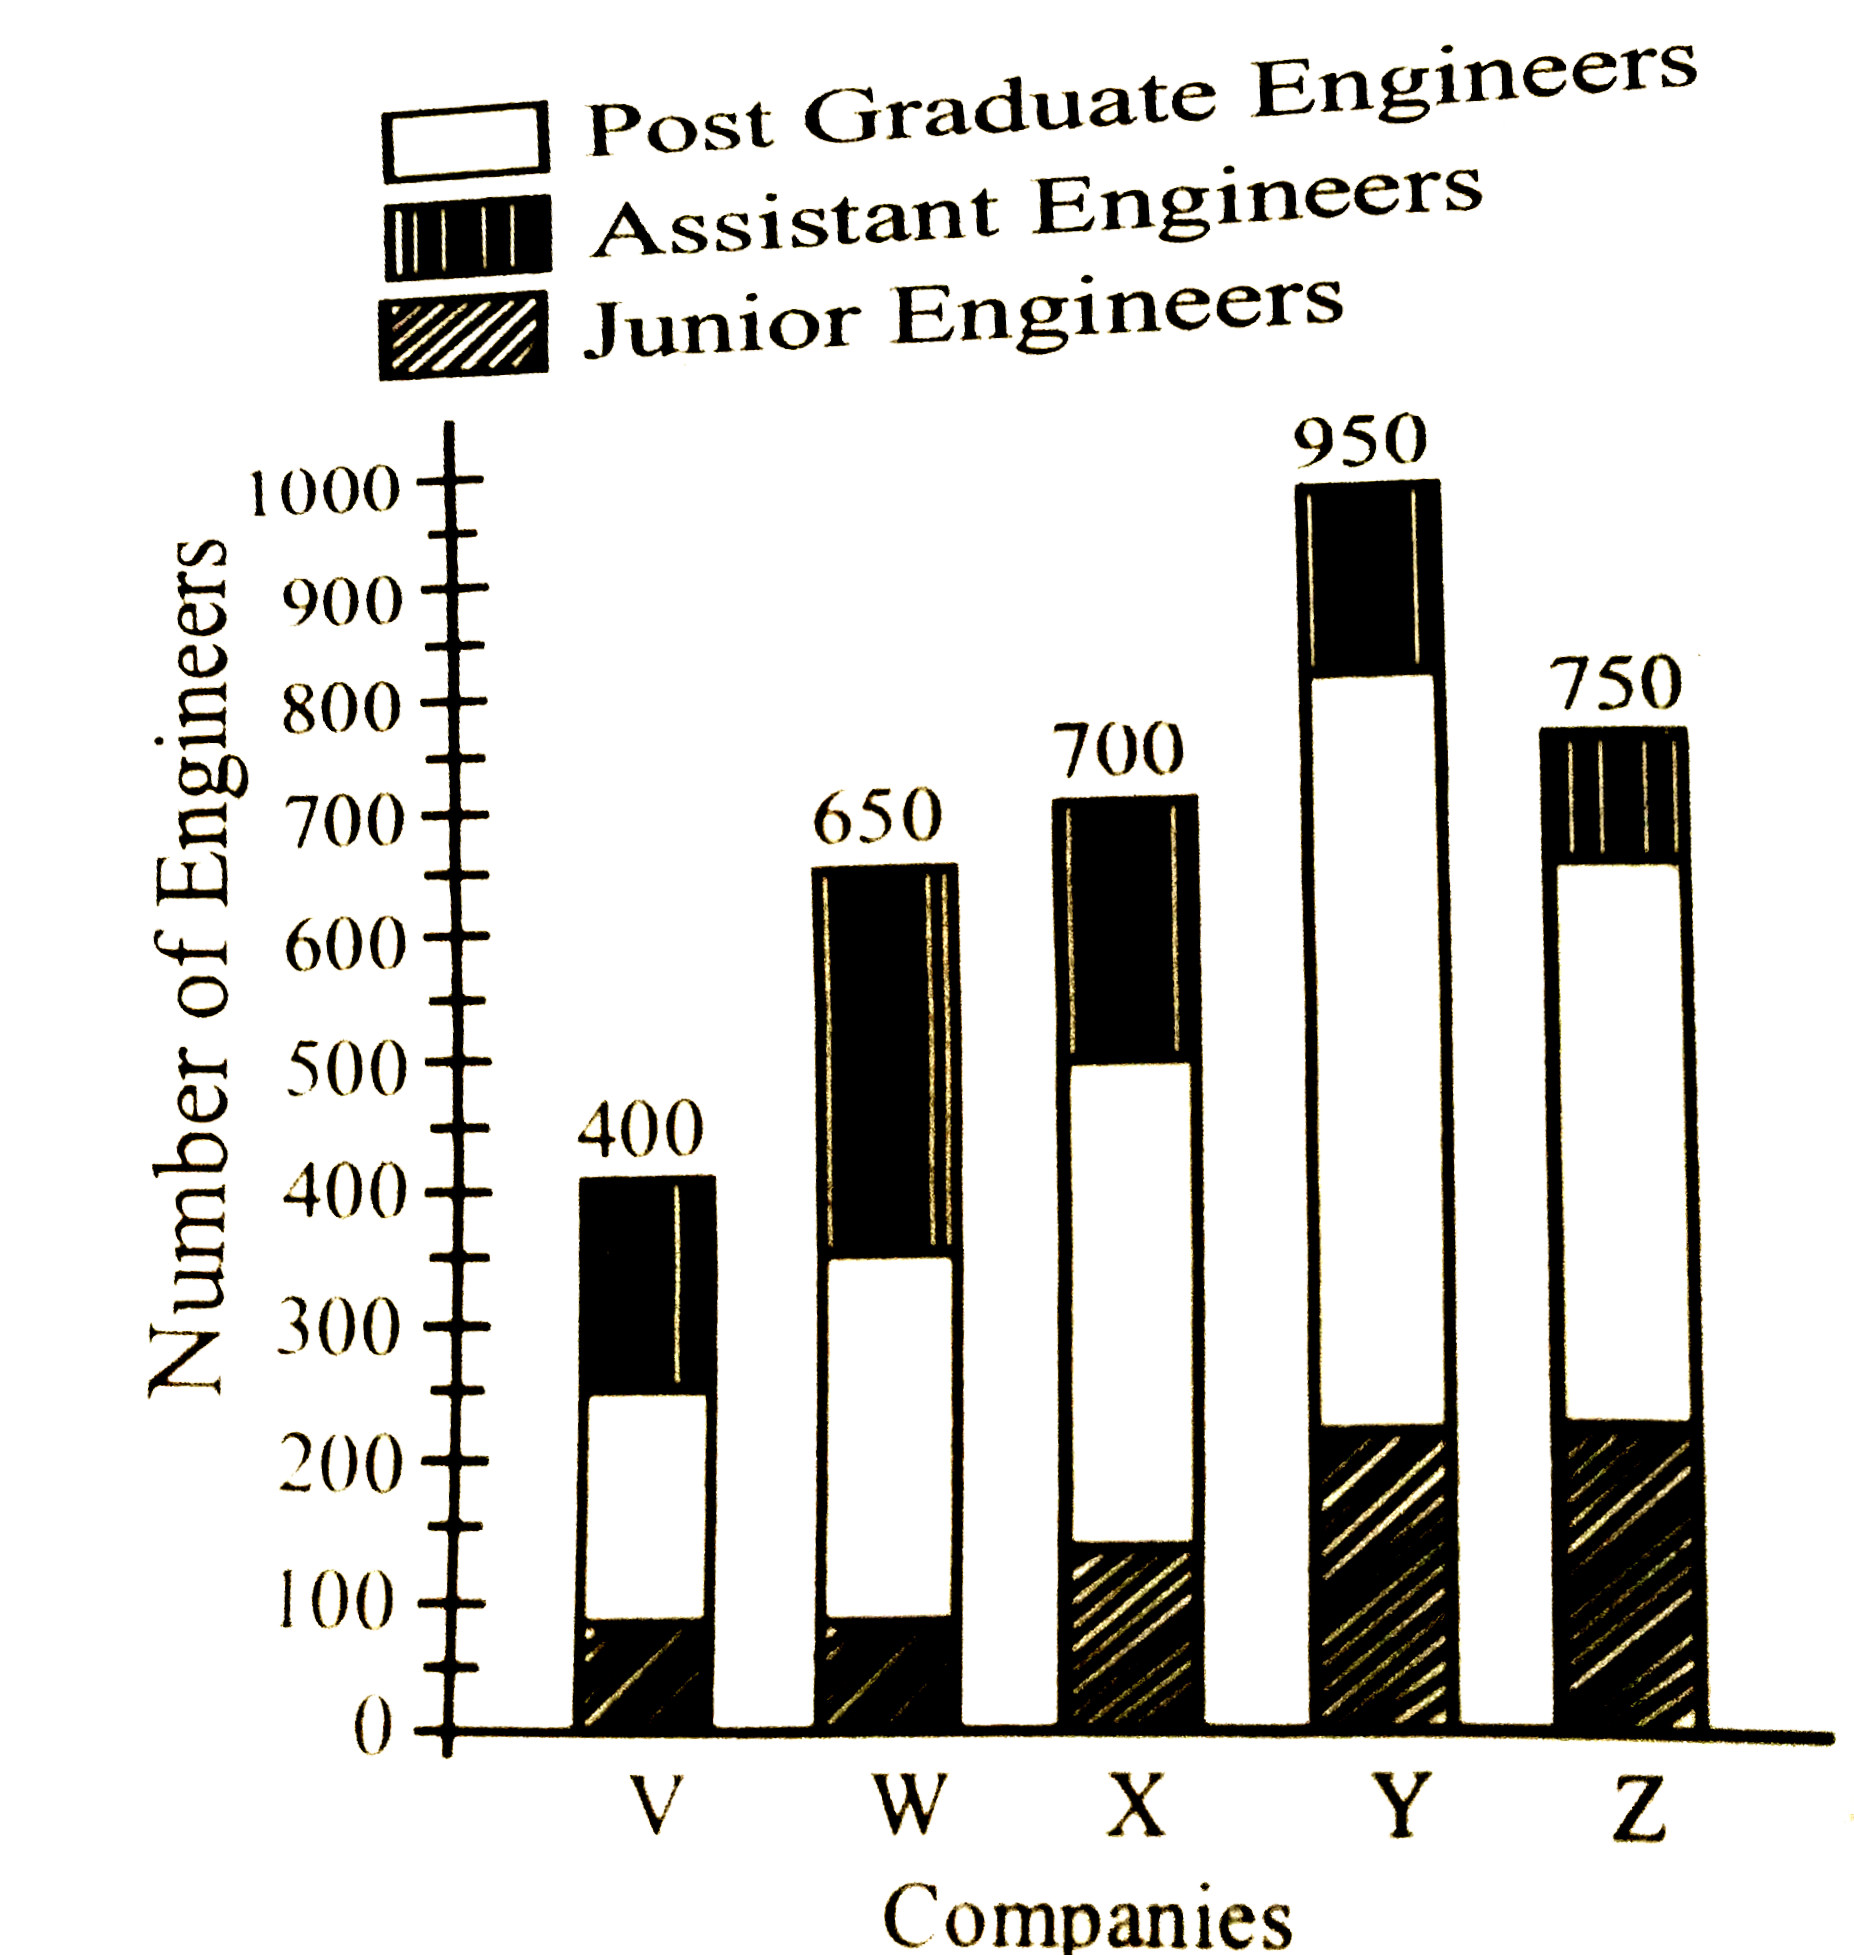
What is the difference between the average number of junior engineers and asistant engineers taking all the companies together ?
View SolutionDirections: Refer to the following graph and answer the given questions. Data related to the number of shoes sold by two stores (A and B )during five years:
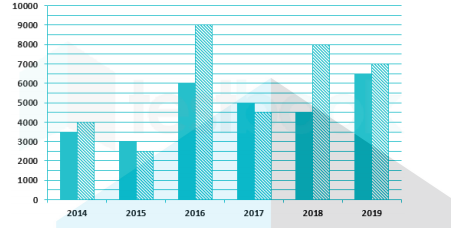
If the respective ratio between the total number of shoes sold by stores A and B together in 2014 and that in 2020 is 5 : 7.What is the total number of shoes sold by stores A and B together in 2020?
View Solution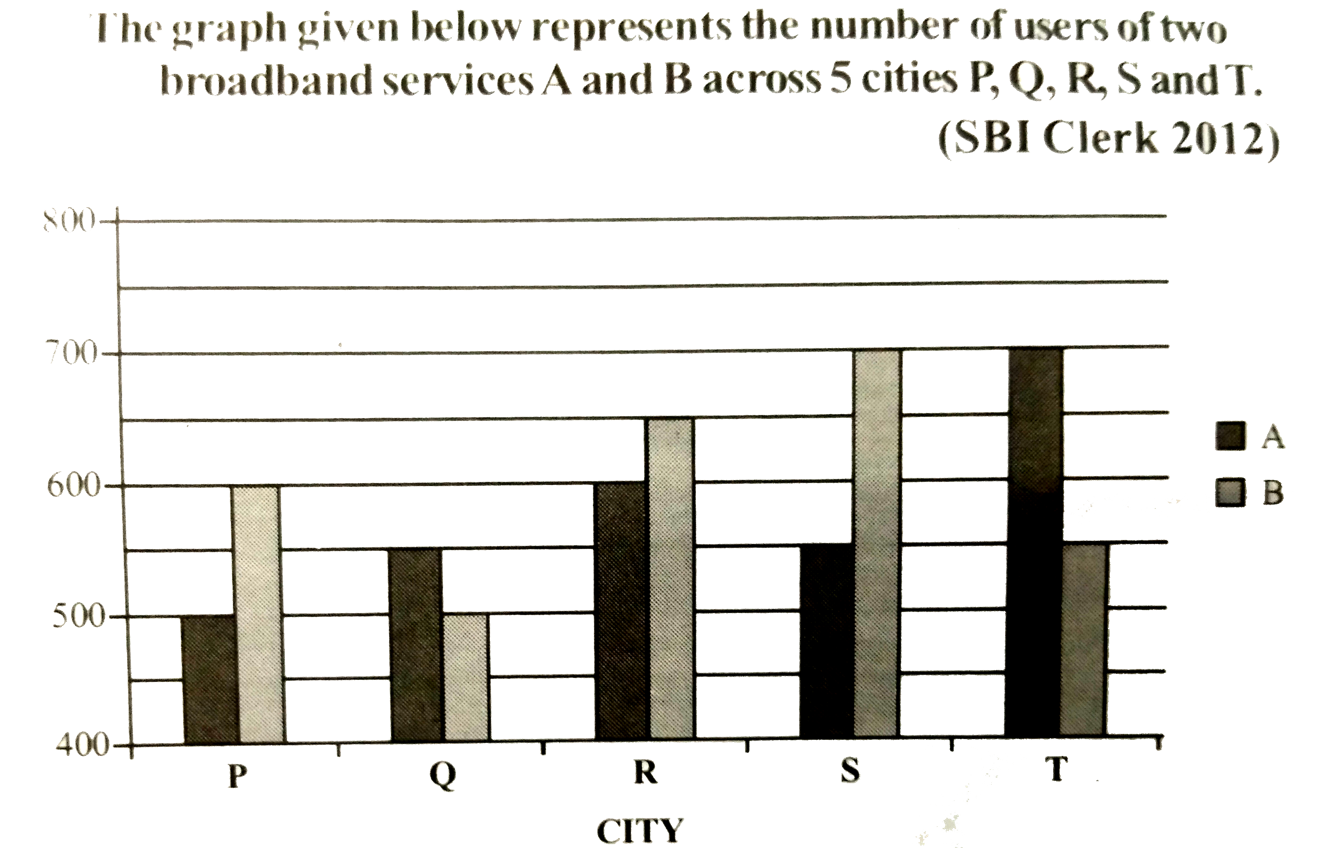
What is the difference between the total number of users of Brand A and B together in city R and the total number of users of brand A annd B together in city P ?
View Solution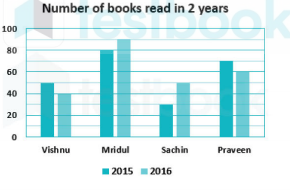
Directions: Read the bar graph carefully and answer the given questions.What is the average of total number of books read by all of them in the year 2016?
View SolutionDirection: Read the following table carefully and answer the questions given below: The given table shows the number of boys and girls in 5 different school:
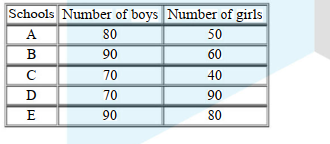
Find the ratio between the average number of girls in school B and D together and the average number of boys in school B and C together.
View SolutionDirections: There are 5 different Buildings A, B, C, D and E and the number of Total number of floors and number of vacant floors given. Read the graph carefully and answer the given questions
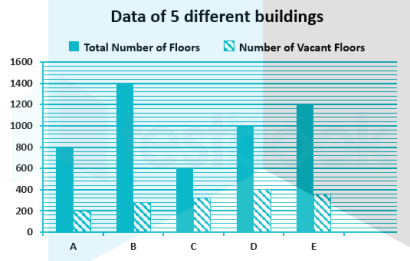
Total Number of floors = Number of Vacant Floors + Number of Occupied floors
Find the difference between the total number of occupied floors of building B and C together and that of buildings D and E together.
View Solution
