Refer to the graph and answer the given questions
Data related to number of cookies baked by two Bakeries
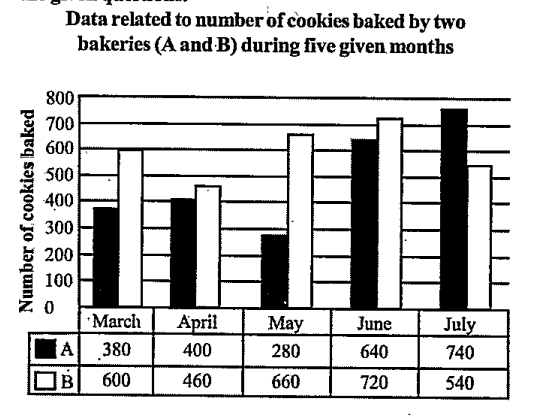
The number of cookies baked by bakery B in June is approximately what per cent of the total number of cookies baked by the same bakery in March and May together?
45
70
51
57
The correct Answer is:D
Step by step video, text & image solution for Refer to the graph and answer the given questions Data related to number of cookies baked by two Bakeries The number of cookies baked by bakery B in June is approximately what per cent of the total number of cookies baked by the same bakery in March and May together? by Maths experts to help you in doubts & scoring excellent marks in Class 14 exams.
Updated on:21/07/2023Similar Questions

The number of females in all the banks together in Delhi are approximately what per cent of the number of males from all the banks together in the same city?
View SolutionDirections: Refer to the following graph and answer the given questions. Data related to the number of shoes sold by two stores (A and B )during five years:
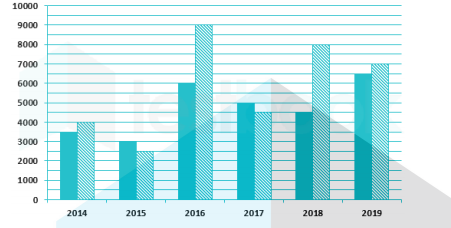
What is the difference between the total number of shoes sold by store A in 2018 and 2019 together and the total number of shoes sold by store B in 2014 and 2015 together?
View Solution
Knowledge Check
The number of tickets of movie B sold in Hyderabad was approximately, what per cent of the total number of tickets of the same movie sold in all the cities together?
A15B24C12D20Ready the following graph carefully and answer the questions given below.
Number of passed students (boys and girls) from different colleges in a year (in thousands)
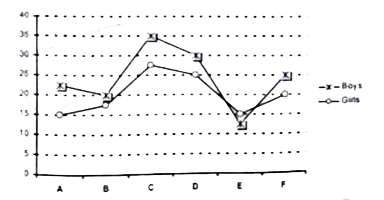
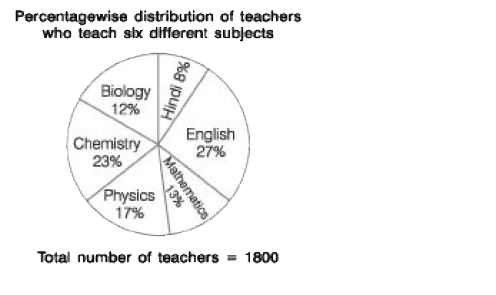
The number of passed boys in college C is approximately what percent of the total number of passed boys in all colleges together ?A20%B35%C24%D29%If two-ninth of the teachers who teach Physics, are female, then number of male Physics teachers is approximately what per cent of the total number of teachers who teach Chemistry?
 A0.57B0.42C0.63D0.69
Directions: Refer to the following graph and answer the given questions. Data related to the number of shoes sold by two stores (A and B )during five years:
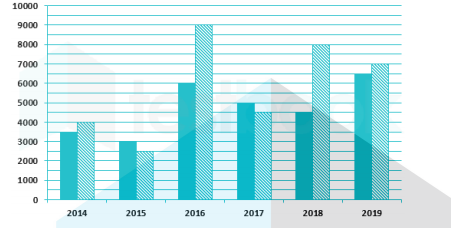
Find the ratio between the total number of shoes sold by stores A and B together in 2016 to the total number of shoes sold by stores A and B together in 2018?
View SolutionDirections: Refer to the following graph and answer the given questions. Data related to the number of shoes sold by two stores (A and B )during five years:
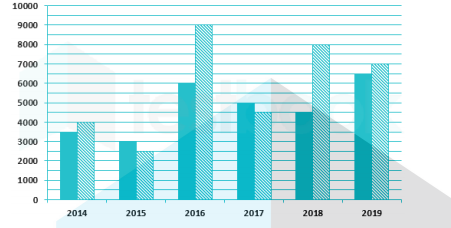
The number of shoes sold by store A decreased by what percent from 2017 to 2018?
View SolutionDirections: Refer to the following graph and answer the given questions. Data related to the number of shoes sold by two stores (A and B )during five years:
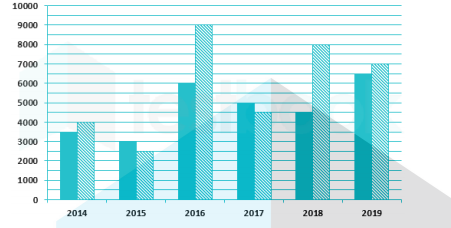
Find the difference between the total number of Shoes sold by Store A and B in all the years together?
View SolutionDirections: Refer to the following graph and answer the given questions. Data related to the number of shoes sold by two stores (A and B )during five years:
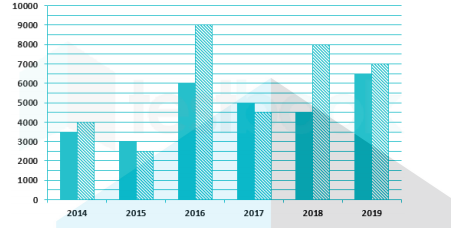
If the respective ratio between the total number of shoes sold by stores A and B together in 2014 and that in 2020 is 5 : 7.What is the total number of shoes sold by stores A and B together in 2020?
View SolutionObserve the bar graph and answer the following questions.
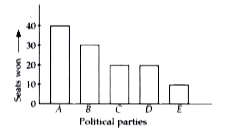
What is the total number of seats won by party A and party B?
View Solution
