Refer to following pie chart carefully and answer the given questions: Percentage wise Distribution of a total of 1800 animals sold by a pet shop in 6 years
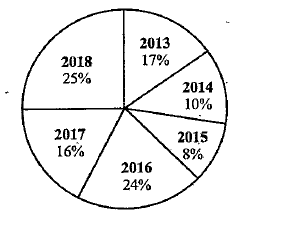
Equal number-of animals sold in 2017 and 2018 were white coloured. If respective ratio between the number of non-white coloured animals sold in 2017 and that in 2018 was 4:7, how many white coloured animals were sold in 2018?
48
90
36
72
The correct Answer is:D
Step by step video, text & image solution for Refer to following pie chart carefully and answer the given questions: Percentage wise Distribution of a total of 1800 animals sold by a pet shop in 6 years Equal number-of animals sold in 2017 and 2018 were white coloured. If respective ratio between the number of non-white coloured animals sold in 2017 and that in 2018 was 4:7, how many white coloured animals were sold in 2018? by Maths experts to help you in doubts & scoring excellent marks in Class 14 exams.
Updated on:21/07/2023Similar Questions
Read the following table carefully and answer the questions given below. Number of Cars (In thousands) of different models and colours sold in two Metro Cities in a year

The total number of blue-coloured cars of model E and D sold in Metro H is exactly equal to the number of white-coloured cars of which model in Metro M?
View SolutionDirections: Refer to the following graph and answer the given questions. Data related to the number of shoes sold by two stores (A and B )during five years:
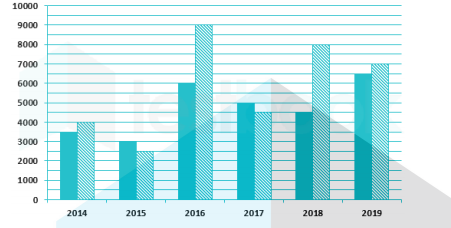
What is the difference between the total number of shoes sold by store A in 2018 and 2019 together and the total number of shoes sold by store B in 2014 and 2015 together?
View Solution
Knowledge Check
Read the following table carefully and answer the questions given below. Number of Cars (In thousands) of different models and colours sold in two Metro Cities in a year

In metro M the number of cars sold is minimum for which of the colour model combinations?AWhite-CBBlue-BCSilver-BDNone of theseRead the following table carefully and answer the questions given below. Number of Cars (In thousands) of different models and colours sold in two Metro Cities in a year

The difference between the white-coloured cars sold in the two metros of which of the following models is the minimum?AABCCDDNone of theseRead the following table carefully and answer the questions given below. Number of Cars (In thousands) of different models and colours sold in two Metro Cities in a year

The total number of silver-colcured cars sold in Metro His approximately what percentage of that in Metro M?A130B140C90D100
Directions: Refer to the following graph and answer the given questions. Data related to the number of shoes sold by two stores (A and B )during five years:
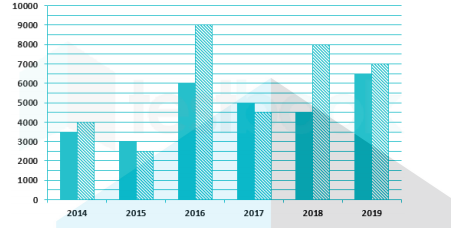
If the respective ratio between the total number of shoes sold by stores A and B together in 2014 and that in 2020 is 5 : 7.What is the total number of shoes sold by stores A and B together in 2020?
View SolutionDirections: Refer to the following graph and answer the given questions. Data related to the number of shoes sold by two stores (A and B )during five years:
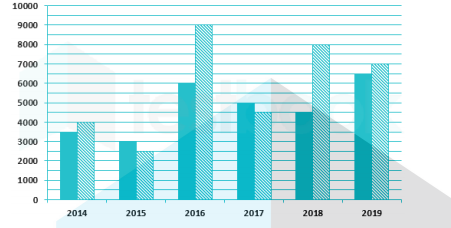
The number of shoes sold by store A decreased by what percent from 2017 to 2018?
View SolutionDirection: Study the following information carefully and answer the given questions: The following pie chart shows the percentage distribution of total number of Apples (Dry +dry)
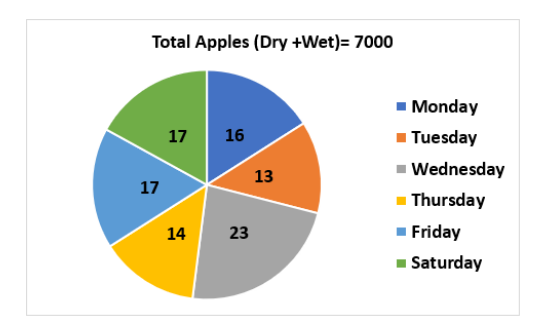
The pie chart2 shows the percentage distribution of total number of Apples (Wet) sold in different days of a week.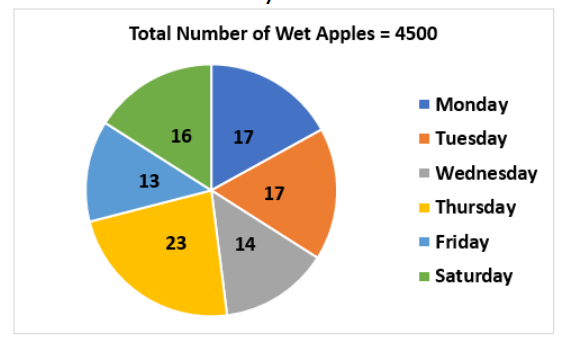
What is the ratio of dry apples sold on Monday to that sold on Saturday?
View SolutionDirections: Refer to the following graph and answer the given questions. Data related to the number of shoes sold by two stores (A and B )during five years:
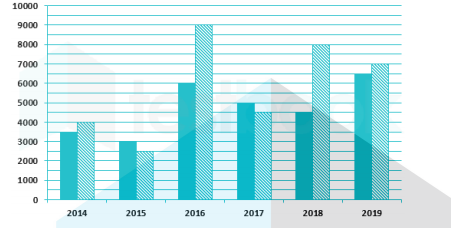
Find the ratio between the total number of shoes sold by stores A and B together in 2016 to the total number of shoes sold by stores A and B together in 2018?
View SolutionRead the following table carefully and answer the questions given below. Number of Cars (In thousands) of different models and colours sold in two Metro Cities in a year

What is the difference between the number of blue-colour cars of model 'C' sold in Metro M and number of red-colour cars of model F sold in Metro H?
View Solution
