In the following questions, the followIng Bar Diagram shows the percentage of 7 coloured balls sold in 5 shops A, B, C, D and E. Study the graph and answer. all the questions.
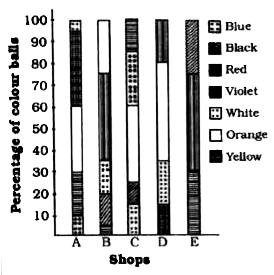
The shops having equal percentage of white balls are :
A and C
C and E
B and C
A and B
The correct Answer is:C
Step by step video, text & image solution for In the following questions, the followIng Bar Diagram shows the percentage of 7 coloured balls sold in 5 shops A, B, C, D and E. Study the graph and answer. all the questions. The shops having equal percentage of white balls are : by Maths experts to help you in doubts & scoring excellent marks in Class 14 exams.
Updated on:21/07/2023Similar Questions
The given bar graph represents the Percentage of non-electrified villages in 6 states A, B, C, D, E and F. Study the graph and answer the question that follows.
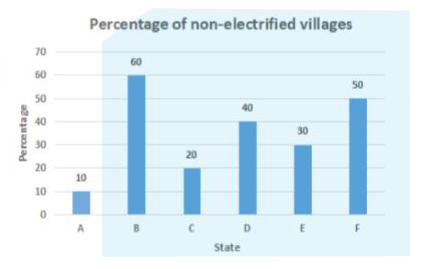
How many states have at most 30% or less non-electrified villages?
View SolutionIn the following questions, the followIng Bar Diagram shows the percentage of 7 coloured balls sold in 5 shops A, B, C, D and E. Study the graph and answer. all the questions.
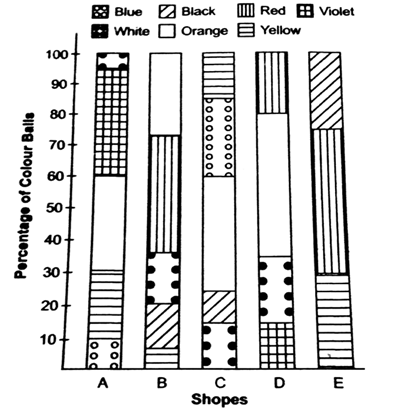
The difference between total number of percentage of violet balls and total number of percentage of blue balls is:
View Solution
Knowledge Check
In the following questions, the followIng Bar Diagram shows the percentage of 7 coloured balls sold in 5 shops A, B, C, D and E. Study the graph and answer. all the questions.
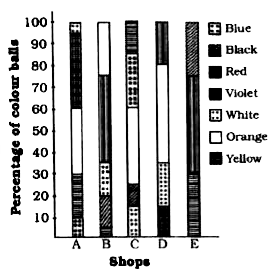
In shop A, the ratio of percentage of violet balls and yellow balls is:A2:7B7:4C6:1D2:4In the following questions, the followIng Bar Diagram shows the percentage of 7 coloured balls sold in 5 shops A, B, C, D and E. Study the graph and answer. all the questions.

The ratio of total percentage of red balls and total percentage of orange balls is :A1:1B4:5C9:11D7:9In the following questions, the followIng Bar Diagram shows the percentage of 7 coloured balls sold in 5 shops A, B, C, D and E. Study the graph and answer. all the questions.
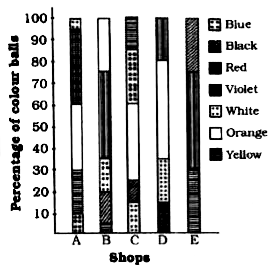
What fraction of the total percentage of colour balls is to the percentage of total yellow balls?A750B320C425D13100
Study the following bar graph and answer the question that follows.
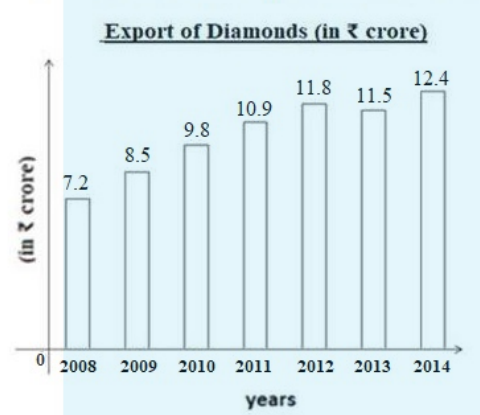
In which year was the maximin percentage increase in diamonds exports compared to the previous year?
View SolutionThe following diagram show the expenditure of a family on various Items A ,B,C, D and E .
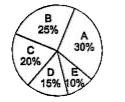
Study the diagram carefully and answer the following questions .
The angle of pie diagram showing the expenditure incurred on item A is
View SolutionThe following diagram show the expenditure of a family on various Items A ,B,C, D and E .

Study the diagram carefully and answer the following questions .
The angle of pie diagram showing the expenditure incurred on item A is
View SolutionThe bar diagram shows the monthly expenditure of a company. Study the graph and answer the questions.
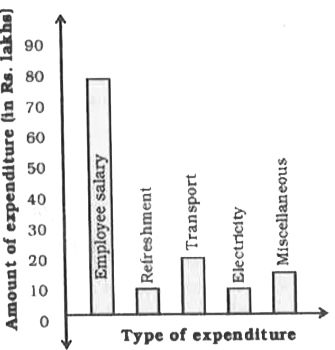
The percentage of money spent on miscellaneous is
View SolutionThe bar diagram shows the monthly expenditure of a company. Study the graph and answer the questions.
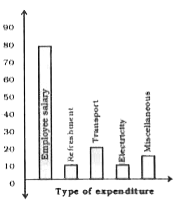
The percentage of money spent on miscellaneous is
View Solution
