Refer to following pie chart carefully and answer the given questions: Percentage wise Distribution of a total of 1800 animals sold by a pet shop in 6 years
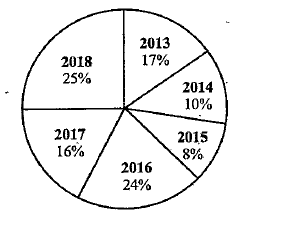
If 35% and 25% of animals sold in 2014 and 2015 respectively were rabbits, total how many rabbits were sold in 2014 and 2015 together ?
90
104
95
99
The correct Answer is:D
Step by step video, text & image solution for Refer to following pie chart carefully and answer the given questions: Percentage wise Distribution of a total of 1800 animals sold by a pet shop in 6 years If 35% and 25% of animals sold in 2014 and 2015 respectively were rabbits, total how many rabbits were sold in 2014 and 2015 together ? by Maths experts to help you in doubts & scoring excellent marks in Class 14 exams.
Updated on:21/07/2023Similar Questions
Directions: Refer to the following graph and answer the given questions. Data related to the number of shoes sold by two stores (A and B )during five years:
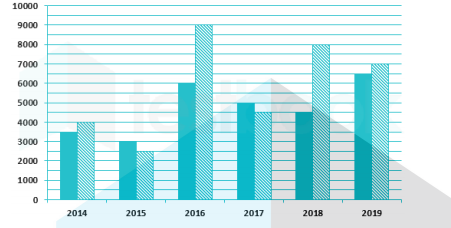
What is the difference between the total number of shoes sold by store A in 2018 and 2019 together and the total number of shoes sold by store B in 2014 and 2015 together?
View Solution(Questions 5-9): Study the following pie-chart and table carefully and answer the questions given below: Percentage-wise Distribution of the Number of Mobile Phones Sold by a Shopkeeper During Six Months (FIGURE) What is the ratio of the number of mobile phones sold of Company B during July to those sold during December of the same company? (a) 119:145 (b) 116:135 (c) 119:135 (d) 119:130 (e) None of these
View Solution
Knowledge Check
Study the graph carefully and answer the following questions.
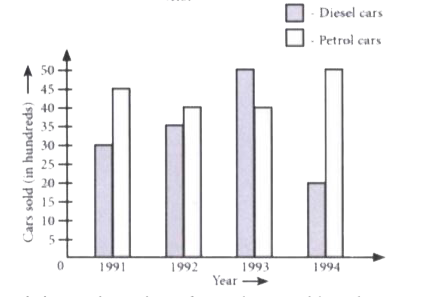
How many cars were sold during the year 1991?A9000B6500C7500D7000Study the graph carefully and answer the following questions.
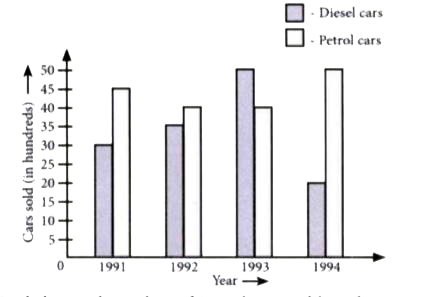
Find the total number of Diesel cars sold in the year 1992 and 1994 together.A2500B5500C1500D4500Study the graph carefully and answer the following questions.
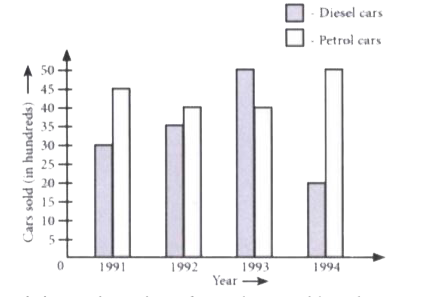
How many more Diesel cars were sold in 1991 than in 1994?A500B1500C1000D2000
Study the following information carefully and answer the given questions: The following bar graph shows the price per square feet of lands in different years
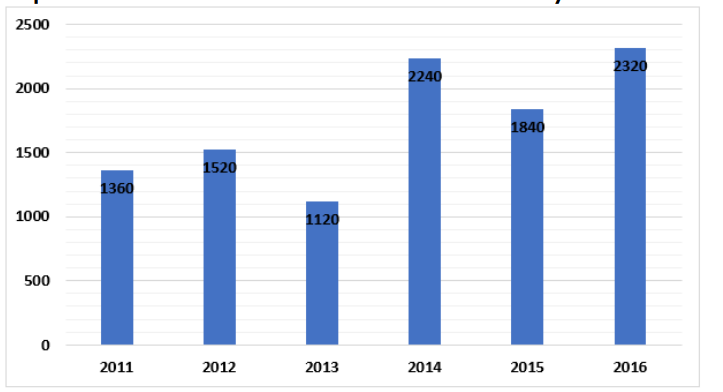
The price per square feet in the year 2011 and 2014 together is approximately what percentage of the price per square feet in the year 2012 and 2015 together?
View SolutionDirections: Read the following Pie chart carefully and answer the following questions:- The pie chart shows the percentage of candidates in 6 different shifts of an examination. Total number of candidates = 5500
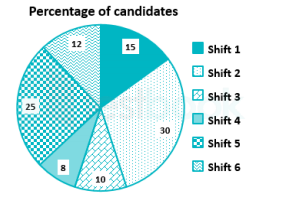
If 215 candidates in shift 2 were absent, then find the number of candidates present in the same shift.
View SolutionDirection: Study the following information carefully and answer the given questions: The following pie chart shows the percentage distribution of total number of Apples (Wet +dry)
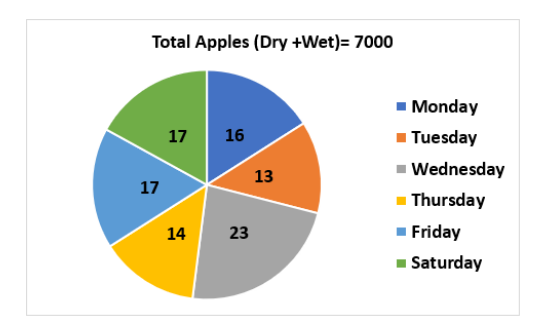
The pie chart2 shows the percentage distribution of total number of Apples (Wet) sold in different days of a week.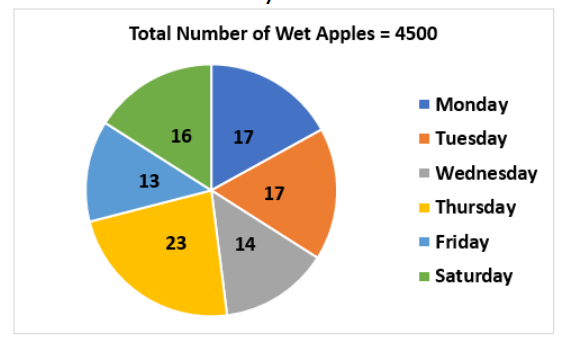
If the Apples (dry) sold on Sunday is 60 % more than the Apples (dry) sold on Saturday. Find the total Apples (dry) sold on Sunday and Saturday together?
View SolutionDirection: Study the following information carefully and answer the given questions: The following pie chart shows the percentage distribution of total number of Apples (Dry +dry)

The pie chart2 shows the percentage distribution of total number of Apples (Wet) sold in different days of a week.
What percentage of dry apples sold on Monday and Tuesday together?
View SolutionStudy the following table carefully and answer the questions given below:
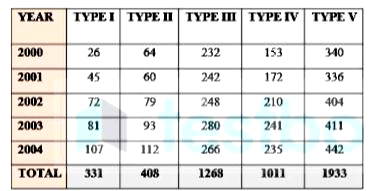
The number of Type I veb.icles sold in 2003 was approximately what percentage of the total number of vehicles sold in 2002?
View Solution
