Direction: Study the following information
carefully and answer the given questions:
The following pie chart shows the percentage
distribution of total number of Apples (Dry +dry)
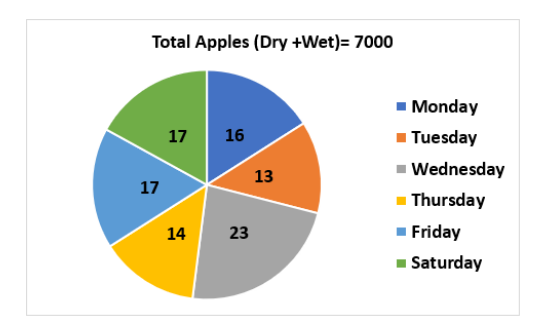
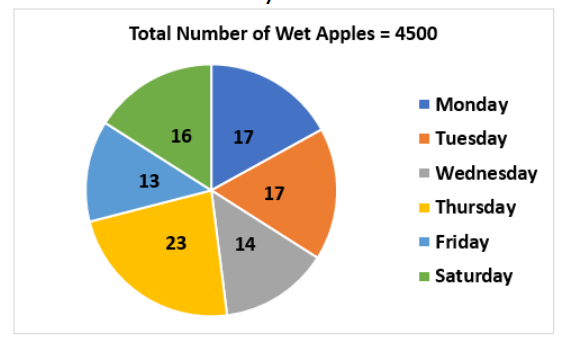
The pie chart2 shows the percentage
distribution of total number of Apples (Wet)
sold in different days of a week.
What percentage of dry apples sold on
Monday and Tuesday together?
10
15
20
25
Step by step video & image solution for Direction: Study the following information carefully and answer the given questions: The following pie chart shows the percentage distribution of total number of Apples (Dry +dry)The pie chart2 shows the percentage distribution of total number of Apples (Wet) sold in different days of a week.What percentage of dry apples sold on Monday and Tuesday together? by Maths experts to help you in doubts & scoring excellent marks in Class 14 exams.
Updated on:21/07/2023Similar Questions
Direction: Study the following information carefully and answer the given questions: The following pie chart shows the percentage distribution of total number of Apples (Dry +dry)

The pie chart2 shows the percentage distribution of total number of Apples (Wet) sold in different days of a week.
What is the ratio of dry apples sold on Monday to that sold on Saturday?
View SolutionDirection: Study the following information carefully and answer the given questions: The following pie chart shows the percentage distribution of total number of Apples (Dry +dry)

The pie chart2 shows the percentage distribution of total number of Apples (Wet) sold in different days of a week.
Find the difference the Apples (Wet) sold on Tuesday to the apples (Wet + Dry) sold on Thursday?
View Solution
Knowledge Check
Study the following pie chart carefully and answer the questions. The pie chart represents the percentage of people involved in various occupations.
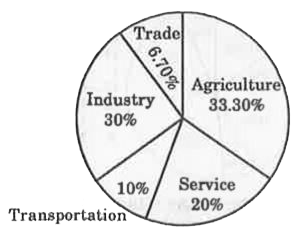
The ratio of the people involved in service to that in industry isA1:2B2:3C3:4D3:2Directions (Q. Nos. 1 - 5) Study the following graph and pie chart carefully and answer the Questions that follow.
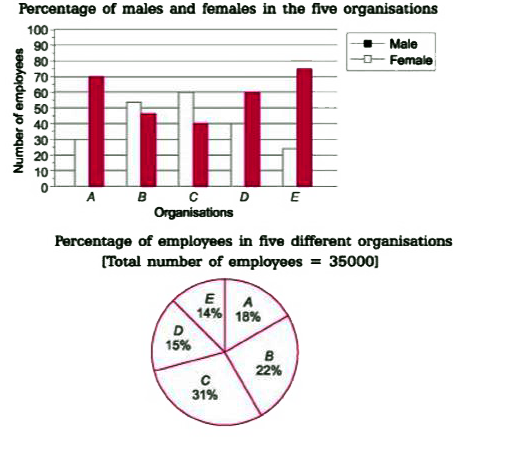
What is the total number of males in organisations A and Ctogether?A6125B8400C8025DNone of the aboveThe following pie-chart shows the percentage distribution of the expenditure incurred in publishing a book. Read the pie-chart and answer the questions.
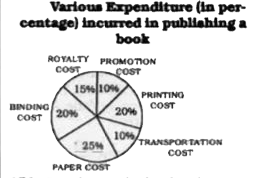
Royality on the book is less than the printing cost by :A20%B5%C25%D3313
Direction: Study the following information carefully and answer the given questions: The following pie chart shows the percentage distribution of total number of Apples (Wet +dry)

The pie chart2 shows the percentage distribution of total number of Apples (Wet) sold in different days of a week.
If the Apples (dry) sold on Sunday is 60 % more than the Apples (dry) sold on Saturday. Find the total Apples (dry) sold on Sunday and Saturday together?
View SolutionStudy the pie chart and answer the question
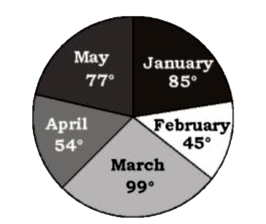
The total number of computers sold in February and April is what percentage more than the number of computers sold in May
View SolutionDirections: Read the following Pie chart carefully and answer the following questions:- The pie chart shows the percentage of candidates in 6 different shifts of an examination. Total number of candidates = 5500
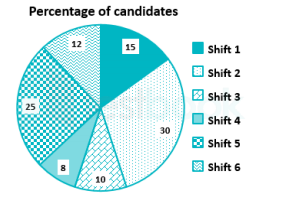
Number of candidates in shift 6 is what percentage more/less than number of candidate in shift 4?
View SolutionThe following pie chart shows the hourly distribution of all the major activities of a student.
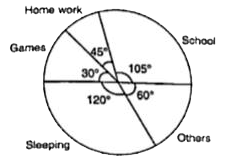
The percentage of time which he spends in school is :
View SolutionStudy the following Pie-Chart carefully to answer the questions given below.
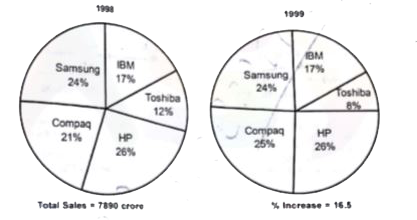
IBM's sales in 1998 is what percentage of the sales of Samsung in 1999 ?
View Solution
