Refer to the pie-chart and answer the given questions.
The following pie-chart refers to the total number of buyers (male+female) in five different shops (A, B, C, D and E) in the month of July Total Number of Buyer’s in Five Shops in July=480
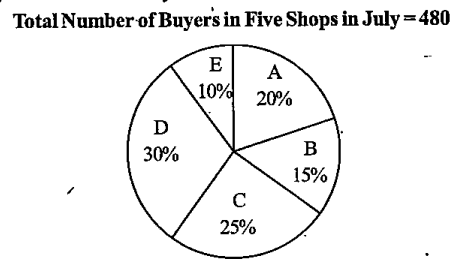
What is the average number of buyers (male+female) in shops C, D and E?
108
112
104
106
The correct Answer is:C
Step by step video, text & image solution for Refer to the pie-chart and answer the given questions. The following pie-chart refers to the total number of buyers (male+female) in five different shops (A, B, C, D and E) in the month of July Total Number of Buyer’s in Five Shops in July=480 What is the average number of buyers (male+female) in shops C, D and E? by Maths experts to help you in doubts & scoring excellent marks in Class 14 exams.
Updated on:21/07/2023Similar Questions
Study the pie chart and answer the question

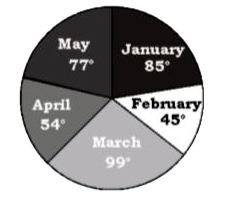
The number of months in which the number of computers sold was above 20% of the total number of computers sold in 5 months was:
View SolutionStudy the given pie chart and answer the question that follows
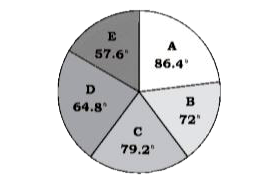
If the total number of students in schools D and E exceeds the number of students in school by x, then x lies between
View Solution
Knowledge Check
The following bar-diagram shows total number of males and females in five different organisations. Study it carefully to answer the questions.
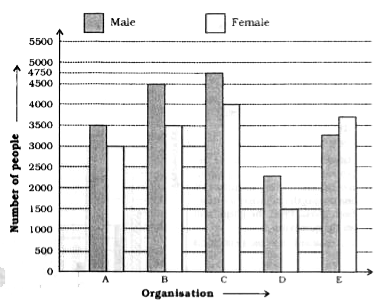
What is the ratio of average number of females from the organisations A, B and C to the average number of males from the organisations C, D and E?A42:41B41:42C40:41D41:40Study the given pie chart and answer the question that follows.
Break-up (degree-wise) of the number of students in five schools (A, B, C, D and E) in a city.
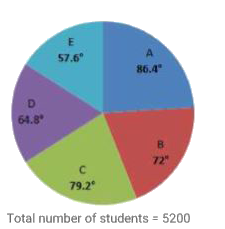
If the total number of students in schools D and E exceeds the number of students in school A by x, then x lies between:A475 and 500B550 and 575C525 and 550D500 and 525The following bar-diagram shows total number of males and females in five different organisations. Study it carefully to answer the questions.
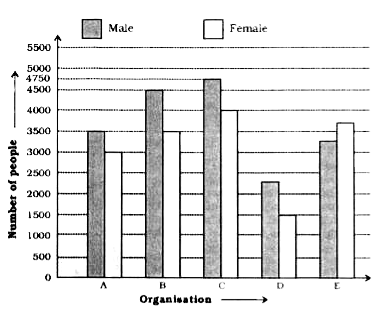
What is the ratio of the number of females from the organisations B and C to the number of males from the organisations D and E?A12:11B12:15C11:15D15:11
Study the pie-chart and answer the question.
Distribution (degree wise ) of the total number of employeesofa company in its five offices A,B,C,D&E.
Total Number of employees = 9200
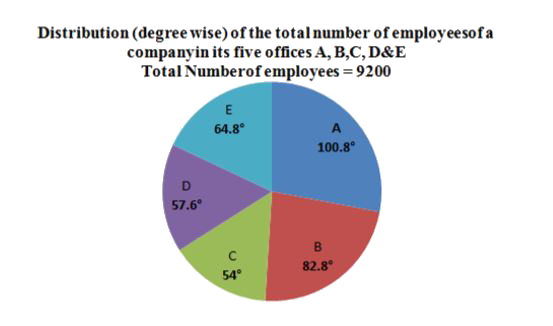
Total number of employees of the company in offices C and D exceeds the number of employees in office B by x, where X lies between:
View SolutionDirections: Study the Pie chart and answer the following question. The pie chart is showing the percentage of different types of shirts sold by five different stores namely A, B, C, D and E.
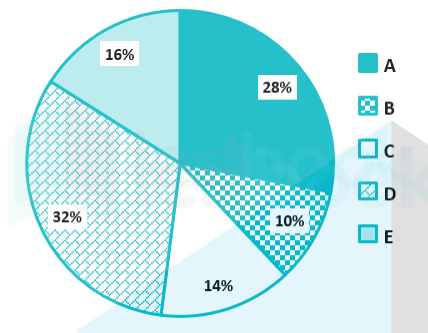
Find the average of shirt sold by store D and E, if the shirt sold by E is 256
View SolutionThe pie chart given below show the number of students who like the five beverages Pepsi, coke Fanta , Frooti and Dew . The total number of students is 540 .
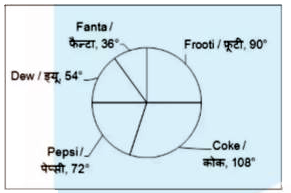
What is the average number of students who likes Coke and Pepsi?
View SolutionStudy the following pie-charts carefully to answer the questions.
Percentage break-up of number of children in five different villages
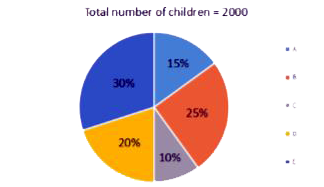
What is the total number of children in village B and E ?
View SolutionThe Bar graph given below presents the number of males and females working in five different companies.
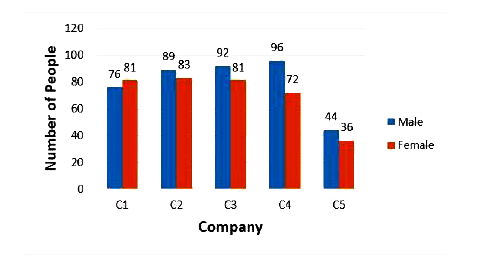
What is the ratio of the total number of males working in the Companies C2 and C3 to the total number of females working in C1 and C5 ?
View Solution
